

Every week, we’ll profile a high yield investment fund that typically offers an annualized distribution of 6-10% or more. With the S&P 500 yielding less than 2%, many investors find it difficult to achieve the portfolio income necessary to meet their needs and goals. This report is designed to help address those concerns.
The Liberty All-Star Equity Fund (USA) is popular enough within the CEF space that I revisit it regularly in this space. With roughly $2 billion in assets and having been around since the mid-1980s, it’s become a portfolio cornerstone for many CEF investors looking for a good way to marry long-term capital growth with high yield.
Unfortunately, that belief may not be entirely justified. It spent most of the 2010s roughly keeping pace with the S&P 500 (with some volatility along the way), but the past three years have largely been a disappointment. Part of that has been a function of the fund’s strategy not aligning with what’s working in the market, but even within its peer group USA has underperformed. Beyond just historical performance, let’s dig into this fund to see how it’s structured and whether it makes sense as a core long-term holding.
Fund Background
USA’s investment objective is to seek total investment return, consisting of long-term capital appreciation and current income. It is a multi-managed fund that allocates its portfolio assets on an approximately equal basis among several independent investment management organizations having different investment styles. Currently, two are growth managers and three are value managers, each being assigned 20% of the portfolio’s total assets to manage.

As I’ve noted in the past, I kind of like this approach to portfolio construction as long as each manager “stays in their lane” so to speak. By that, I mean the value managers stick with their value philosophy and the growth managers stick with their growth philosophy. If you’ve got managers criss-crossing into other strategies, there’s the potential to deviate from the overall portfolio allocation that investors might be expecting. At a high level, there’s no significant evidence that this is occurring. According to the fund’s Q3 report, the value managers have created portfolios with below average P/E’s and the growth managers have created portfolios with above average P/E’s. I’m sure there are some individual holdings in there that are on the far ends of the bell curve, but for the most part, USA’s portfolio is as promised.
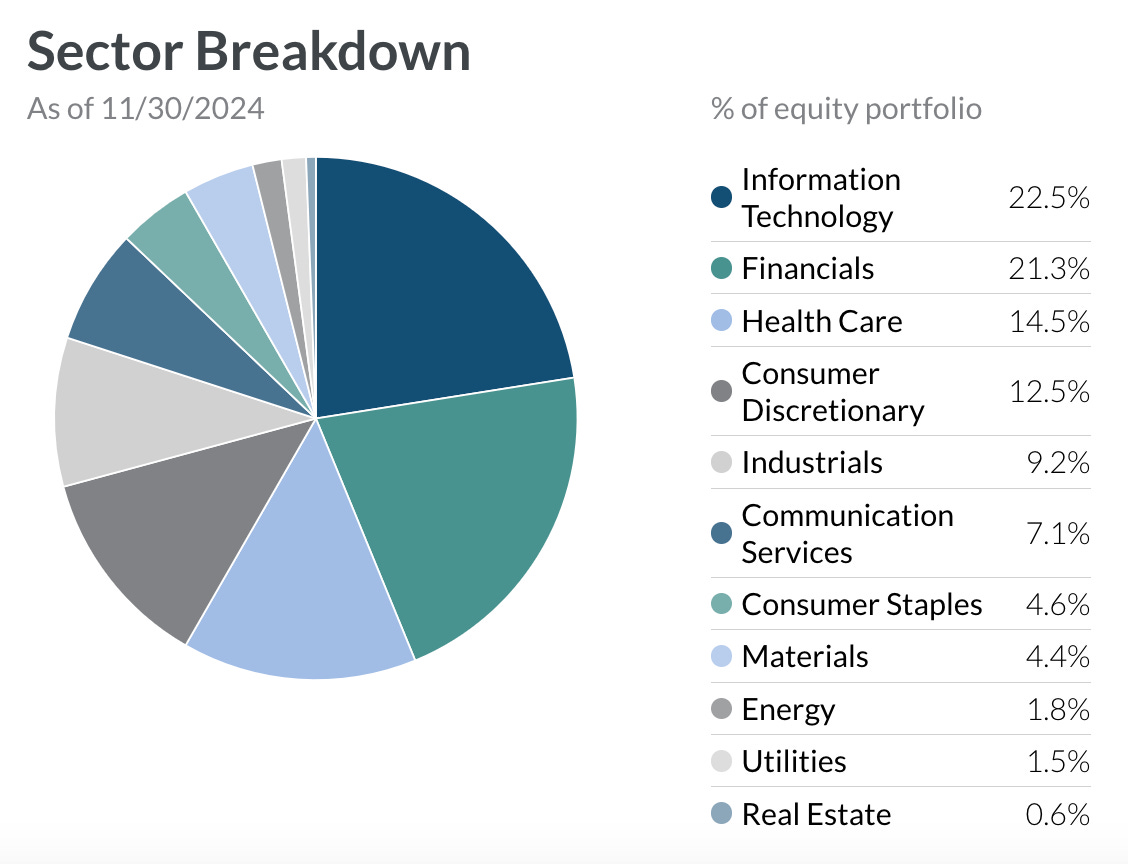
USA’s portfolio reflects a fairly diversified mix of sectors, notably removing about a 10% allocation to tech, which is what the S&P 500 currently has, and distributing elsewhere. The financial sector is the biggest beneficiary of that allocation with healthcare also getting a modest boost. From a 30,000 foot view, USA is underweight to growth sectors, overweight to cyclicals and about same-weight to defensive sectors. This is consistent with what you’d expect from a fund more tilted to value than the index.
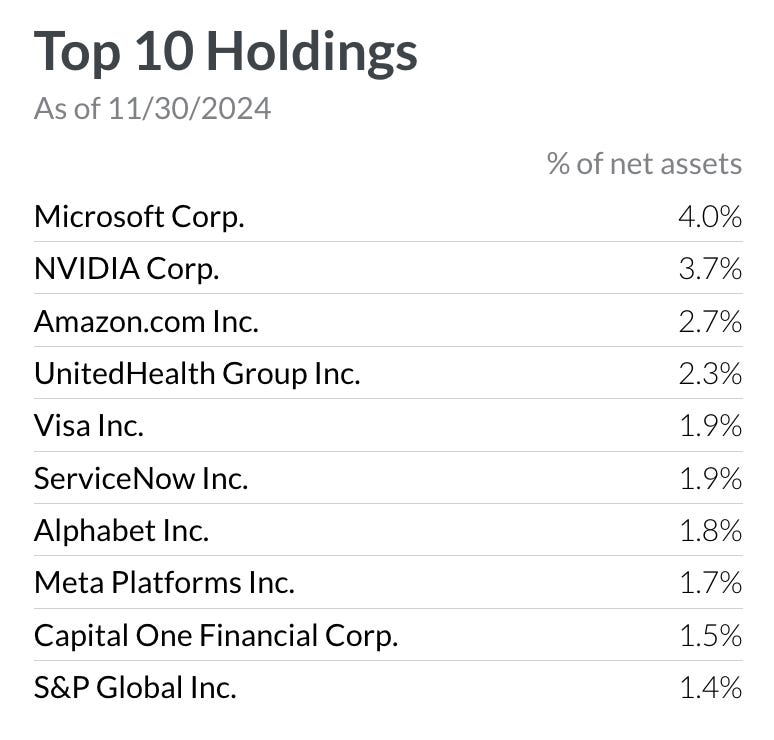
It doesn’t necessarily look that way, however, if you look at the top 10 holdings. Five of the magnificent 7 stocks appear, including those in the top 3 positions. USA isn’t nearly as top-heavy as the S&P 500, which is a good thing, but it goes to show you that even if you wish to diversify your U.S. equity exposure, a lot of managers still focus heavily on the recent mega-cap tech winners.
Special Announcement

Mind the gap!
A substantial, oft-unnoticed gap currently exists in the center of the typical equity allocation. Running Oak's Efficient Growth strategy fills that hole like few do, providing significant value like even fewer do.
Why Invest in Efficient Growth:
Top 2-3 percentile: Running Oak’s Efficient Growth separate account has performed in the top 2 to 3% of all Mid Cap core funds in Morningstar's database over the last 10 years, net of fees.1
Since inception, Efficient Growth has provided 26% more return than the S&P 500 Equal Weight Index and 69% more return than the Russell Mid Cap Index, given the same level of downside risk, gross of fees. (Ulcer Performance Index) 1
Outperforming | Opportune – Mid Cap
The standard equity allocation leaves a large gap in upper Mid, lower Large Cap.2
Mid Cap companies have outperformed Large Cap by 0.54%, annualized, over the last roughly 33 years and outperformed Small by 1.85%.3
Mid Cap stocks are roughly 10% undervalued, per the asset class's CAPE ratio. Large Cap is overvalued by 50 to 100%, depending upon the source. 4
How to Invest
Efficient Growth is currently available as an SMA and ETF. (ETF specifics and audited historical performance can't be shared in the same note. Please reach out for the ticker or more information at seth@runningoak.com.)
In just 18 months, The ETF Which Shall Not Be Named has grown over 13,000% since launch – from 2 to 270mm.
All opinions expressed in this newsletter are those of Running Oak Capital’s and do not constitute investment advice.
1For additional data and context regarding the claims made within this email, please refer to the Disclosures and Additional Data document located here.
2Statements on the standard equity allocation are based on informal feedback and experience from interactions with investors and other financial professionals.
3Invesco: "Why Mid Caps Now"
4Ned Davis Research
Investment Advisory Services are offered through Running Oak Capital, a registered investment adviser.
*Past performance is no guarantee of future results. Performance expectations are no guarantee of future results; they reflect educated guesses that may or may not come to fruition. All indices are unmanaged and may not be invested into directly.
The Standard & Poor’s 500 Index is a capitalization weighted index of 500 stocks designed to measure performance of the broad domestic economy through changes in the aggregate market value of 500 stocks representing all major industries.
The opinions voiced in this material are for general information only and are not intended to provide specific advice or recommendations for any individual. To determine which investments and strategies may be appropriate for you, consult with us at Running Oak Capital or another trusted investment adviser.
Statements on the standard equity allocation are based on informal feedback and experience from interactions with investors and other financial professionals.
Stock prices and index returns provided by Standard & Poor’s.
DISCLAIMER – PLEASE READ: This is sponsored advertising content for which Lead-Lag Publishing, LLC has been paid a fee. The information provided in the link is solely the creation of Running Oak. Lead-Lag Publishing, LLC does not guarantee the accuracy or completeness of the information provided in the link or make any representation as to its quality. All statements and expressions provided in the link are the sole opinion of Running Oak and Lead-Lag Publishing, LLC expressly disclaims any responsibility for action taken in connection with the information provided in the link.
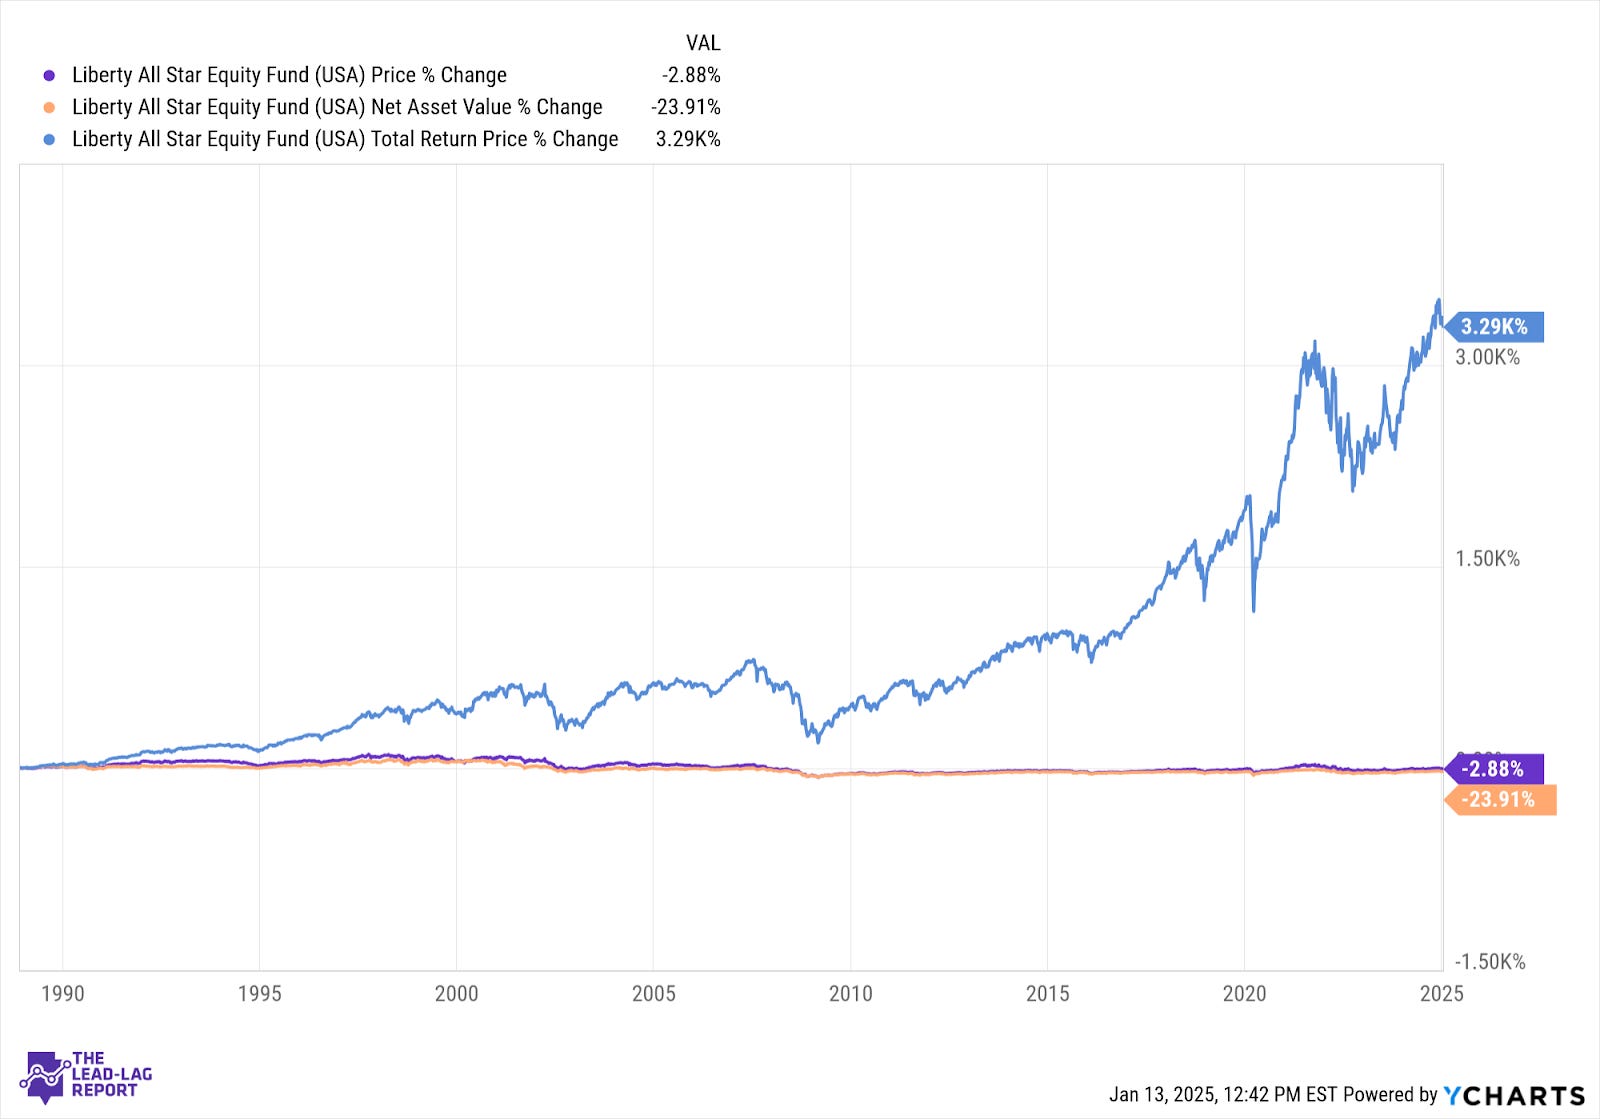
USA was launched in October 1986. Since its inception, the fund has returned a total of 3,290%, which translates to about 9.7% annually.
Jumping the gun a bit, USA comes with a 10% managed annual distribution yield, which means it pays out 10% of the fund’s net assets annually in quarterly increments. Therefore, a 9.7% average annual return means that 1) all of the fund’s total return is coming from those quarterly distributions and 2) the fund has mostly been able to generate the capital gains and income necessary to support the distribution without cratering the NAV (a 23% NAV decay over a period of 38 years is relatively negligible).
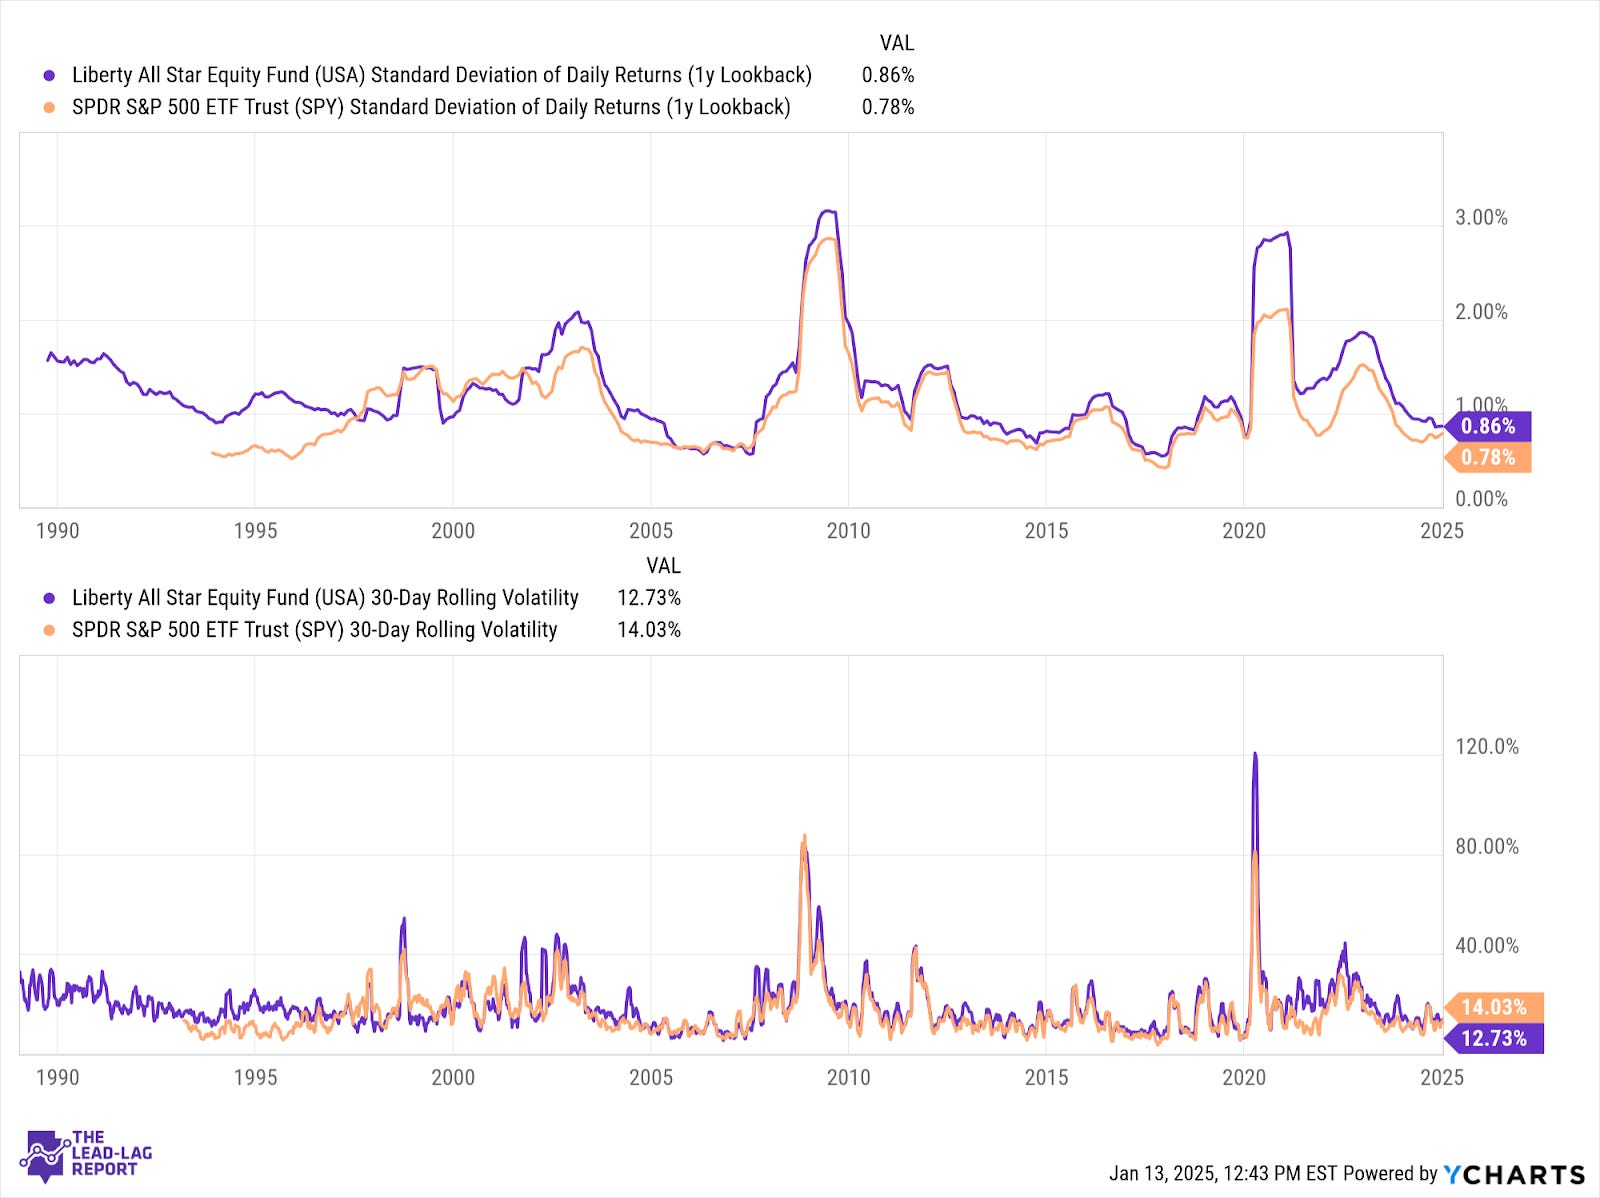
For the most part, USA’s volatility level is comparable to that of the S&P 500. What we’re likely seeing is that the value tilt probably reduces volatility somewhat, but the fluctuating premium/discount to NAV adds some volatility back and then some. Over the long-term, USA has been about 20-25% more volatile with periods of more or less volatility depending on conditions at the time.
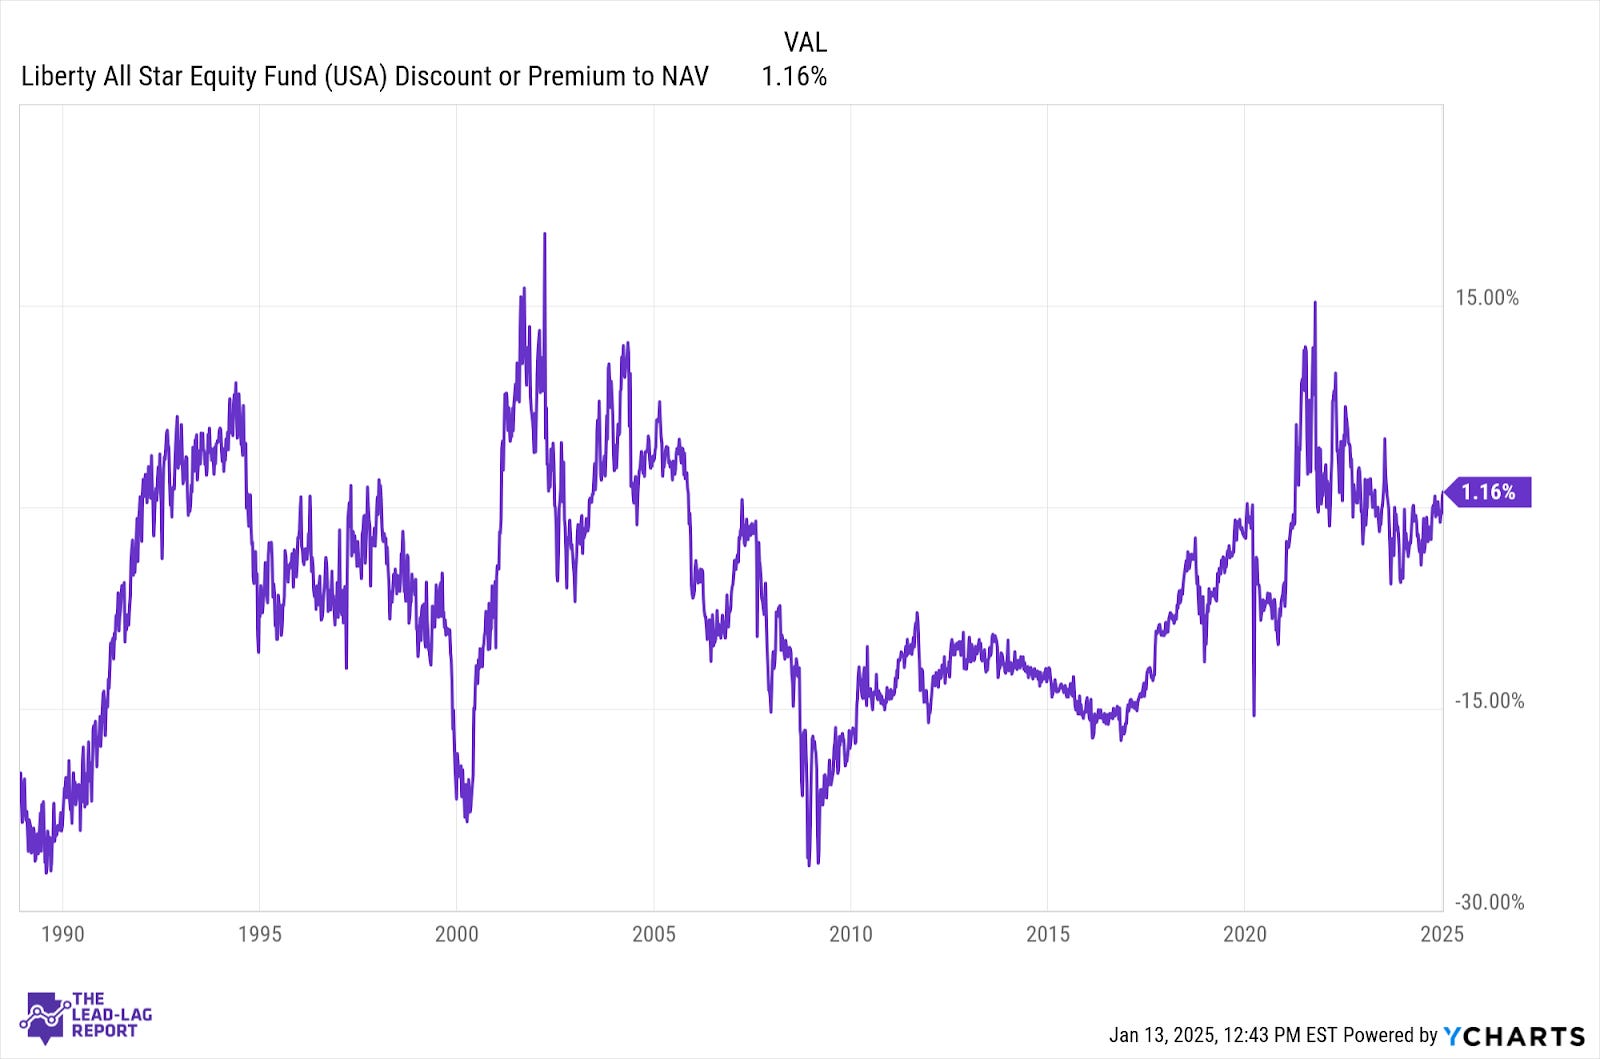
USA has spent significant periods of time trading at a premium to NAV although almost all of the period from 2007 to 2021 saw the fund trade at a discount. The fund traded at a historic premium to NAV during the post-COVID recovery, but the subsequent 2022 bear market brought it back down more closely to its historic range. Even though it’s trading at roughly par value right now, I’d be concerned that this can quickly turn into a wide discount should macro conditions deteriorate. That’s often the case among CEFs and USA has seen that happen multiple times itself in the past.
Macro Environment
USA’s portfolio is about 90% U.S. stocks, so I think we can safely categorize it as a U.S. fund, but it’s also about ⅔ large-caps and ⅓ mid- and small-caps. That doesn’t make it a pure comp to the S&P 500, but it’s probably not that far off either. The mid-cap allocation probably hasn’t done it any favors over the past few years, but historically this narrow segment between large and small companies has been a good source of alpha. That doesn’t help any when the market only cares about a handful of mega-cap tech stocks, but it’s actually a positive over the longer-term.
I think it’s safe to say that U.S. stocks are overvalued historically speaking. Value stocks are less expensive, but still expensive relative to their long-term average. If you’re comparing USA to the S&P 500, I think there’s an argument that USA has less downside risk in a broad valuation contraction, but I think downside risk is substantial nonetheless, especially if the discount expands in the meantime. Given where U.S. economic conditions appear to be heading - little if any rate cut activity from the Fed, geopolitical risk, tariff risk, higher inflation - I think there’s a very good chance that investors are going to be much less inclined to pay premium multiples for expensive U.S. stocks in 2025. Again, that’s probably beneficial for USA on a relative basis looking purely at portfolio composition, but the changing premium/discount to NAV could offset that.
Distribution Policy
USA maintains a quarterly distribution policy that has it paying out a fixed percentage of net assets annually. The policy currently pays an annual rate of 10% based on the NAV as is paid out in quarterly increments.
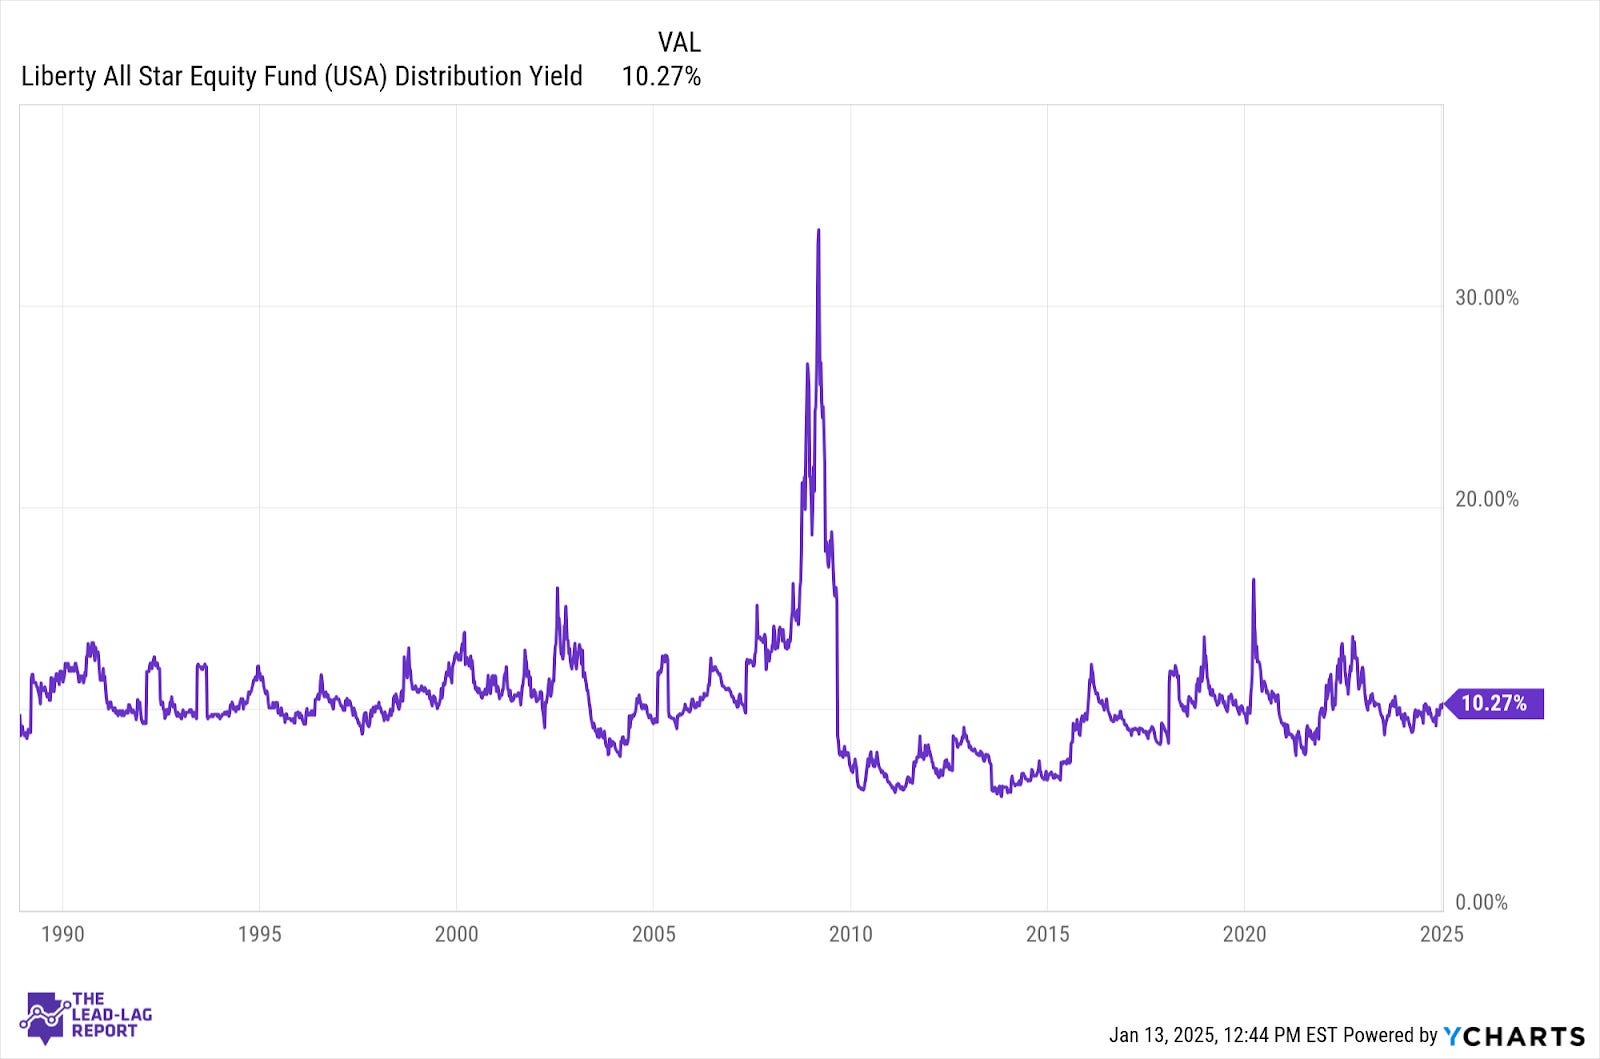
This policy has been in place for a long time, so we can see the distribution yield consistency over time. While that can be a good thing for predictability and helps avoid the risk of a major distribution cut all at once, it will remain variable on a quarter-over-quarter basis (the fund doesn’t even keep distributions steady for a full year before adjusting; they can change every quarter). That also means that the distributions will vary in correlation with overall fund performance. If the fund loses money, for example, your distribution will be reduced as well.
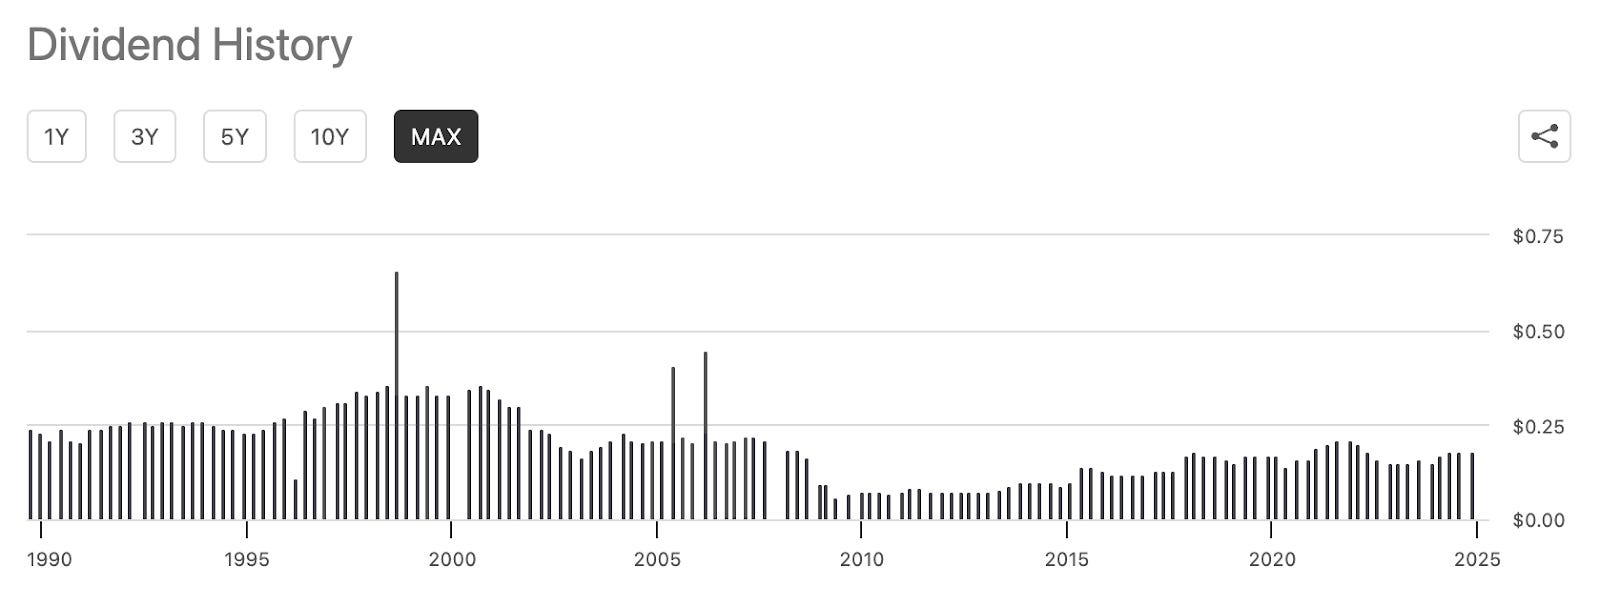
USA had its biggest distributions back in the 1990s and hasn’t really approached that same level on a per-share basis since. Distribution rates have improved over the past decade with performance, but future distributions will again be based on overall fund performance, which may or may not be good in the years ahead.
Advantages
On a sector and style basis, USA is more diversified than the S&P 500 and avoids some of the top-heaviness associated with the index. The fact that five of the top 10 holdings are magnificent 7 names may not be ideal, but at least it minimizes the overweight.
The multi-manager approach is unique within the CEF universe, but I think it has value. If you’re looking for a portfolio with a long-term growth & income objective in mind that doesn’t overdo it with tail risks, having five different managers contribute an equal share to the portfolio is a way to do that. And its 0.90% expense ratio is pretty reasonable for this.
Disadvantages
The managed distribution policy has its advantages, but it may not be ideal for everyone. Distributions fluctuate along with performance, so you could see a cut at the same time your investment is losing money. The quarterly distribution policy also may not be ideal if you’re looking to live off of portfolio income.
The managers used by USA have very mixed track records. Some of their individual funds outside of USA rank in the bottom half of their peer group.
Conclusion
I think that USA on a structural basis works just fine. Its multi-manager approach works for me and it provides a nice split between value and growth. The expense ratio is reasonable and it fixes some of the diversification issues that can be found in the S&P 500.
That being said, I’m not sure it’s been working for the fund. Some of the managers used by USA have mixed track records and the fund’s overall 2-star Morningstar rating suggests that investors haven’t been getting their money’s worth. I can see why the fund is popular, but I think it’s also been riding its 10% distribution yield for a while at the expense of considering the fund on a total return basis.
If the fund had better performance, I might consider it based on how it’s constructed. Considering it’s been an underperformer though, I’m inclined to pass.
The Lead-Lag Report is provided by Lead-Lag Publishing, LLC. All opinions and views mentioned in this report constitute our judgments as of the date of writing and are subject to change at any time. Information within this material is not intended to be used as a primary basis for investment decisions and should also not be construed as advice meeting the particular investment needs of any individual investor. Trading signals produced by the Lead-Lag Report are independent of other services provided by Lead-Lag Publishing, LLC or its affiliates, and positioning of accounts under their management may differ. Please remember that investing involves risk, including loss of principal, and past performance may not be indicative of future results. Lead-Lag Publishing, LLC, its members, officers, directors and employees expressly disclaim all liability in respect to actions taken based on any or all of the information on this writing.