

The markets have gotten off to a rough start in 2025 and the signals are beginning to agree. The short-term utilities signal flips to risk-off and, while lumber/gold is still risk-on at the moment, it’s trending in the wrong direction. Both the stock and bond markets have been spooked by a series of economic data pointing to 1) higher interest rates for longer and 2) the return of inflation.
How To Interpret the Signals: Within each strategy, there is a risk-on and risk-off investment recommendation, with the risk-off option being the more conservative of the two. When a particular signal indicates that investors should be risk-off, for example, subscribers should consider investing in the risk-off option and avoiding the risk-on option. The opposite, therefore, would be true when the signal flips to risk-on. In each strategy, you’d always be invested in one option or the other.
Here’s how to read the scorecard for each strategy:

Some of the strategies will be more aggressive than others. The “Leverage For The Long Run” strategy, for example, uses the S&P 500 and 2x-leveraged S&P 500. The more conservative “Lumber/Gold Bond” strategy, however, uses intermediate-term Treasuries and the S&P 500. In every case, a risk-off signal indicates that you should be invested in the more conservative of the two options, while a risk-on signal indicates you should be invested in the more aggressive one.
For a full user's guide on how to interpret each of the signals and how to put them to work in your portfolio, please click HERE.
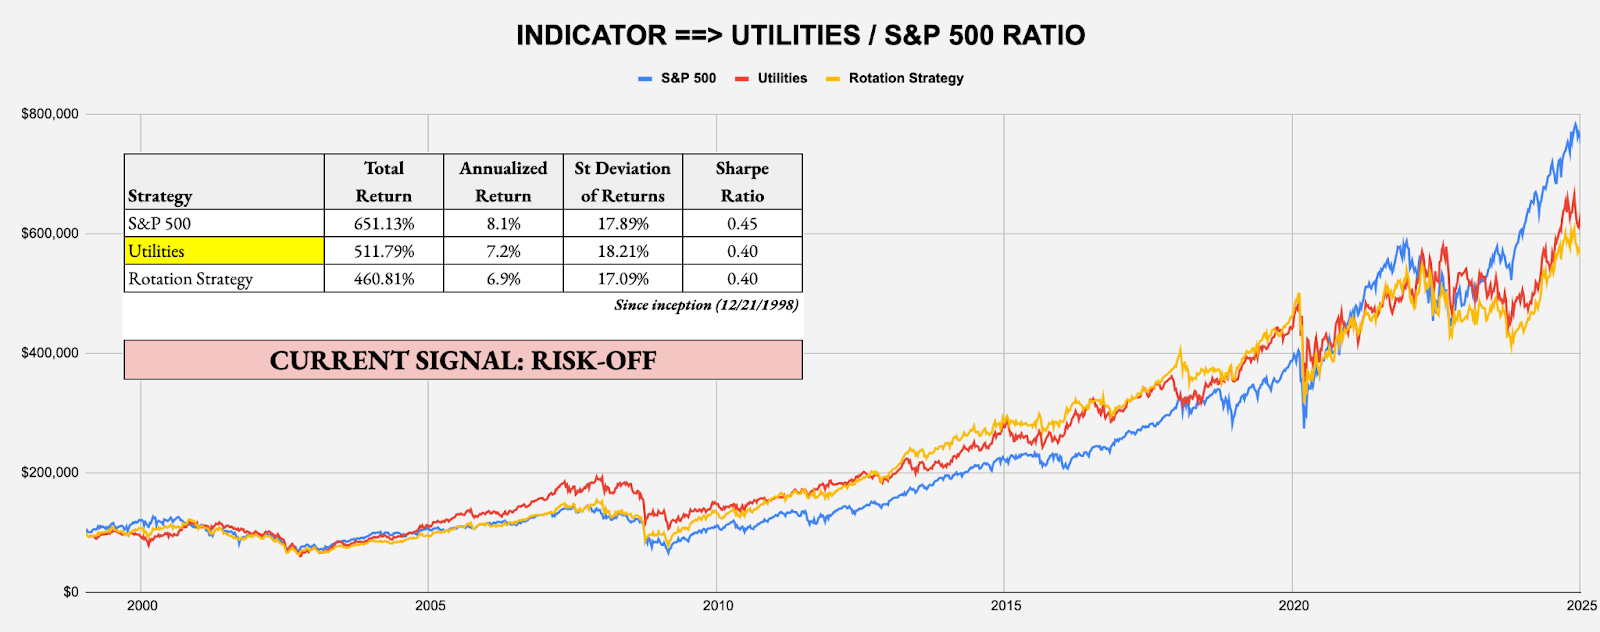
SHORT-TERM SIGNAL: UTILITIES/S&P 500 RATIO
Target Investor: Short-term traders with a higher risk tolerance interested in using an equity momentum strategy to anticipate changes in market risk tolerance.
Current Indicator: Risk-Off
Strategy: Beta Rotation - Example: Invest in Utilities (XLU) over S&P 500 (SPY)
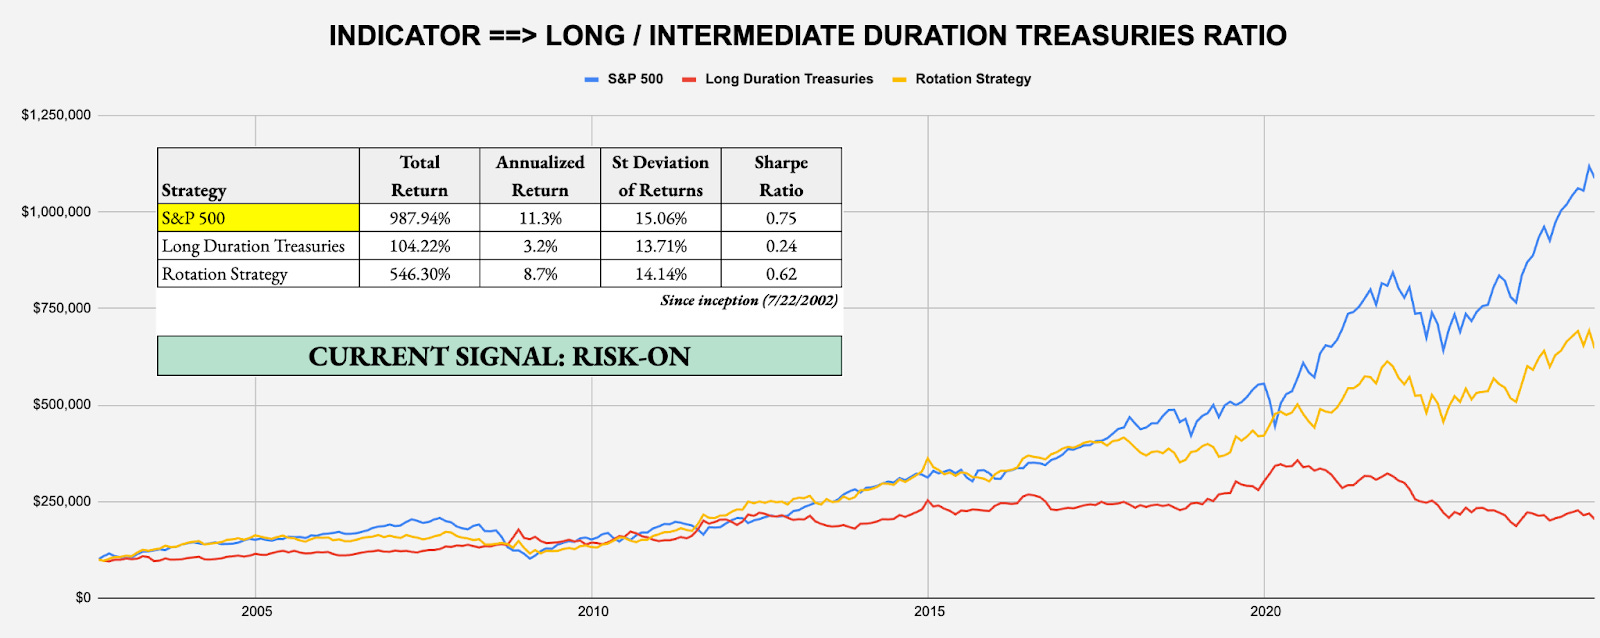
SHORT-TERM SIGNAL: LONG DURATION/INTERMEDIATE DURATION TREASURIES RATIO
Target Investor: Short-term traders with a higher risk tolerance who want to use the activity in the U.S. Treasury market to judge overall risk levels.
Current Indicator: Risk-On
Strategy: Tactical Risk Rotation - Example: Invest in S&P 500 (SPY) over Long-Duration Treasuries (VLGSX)
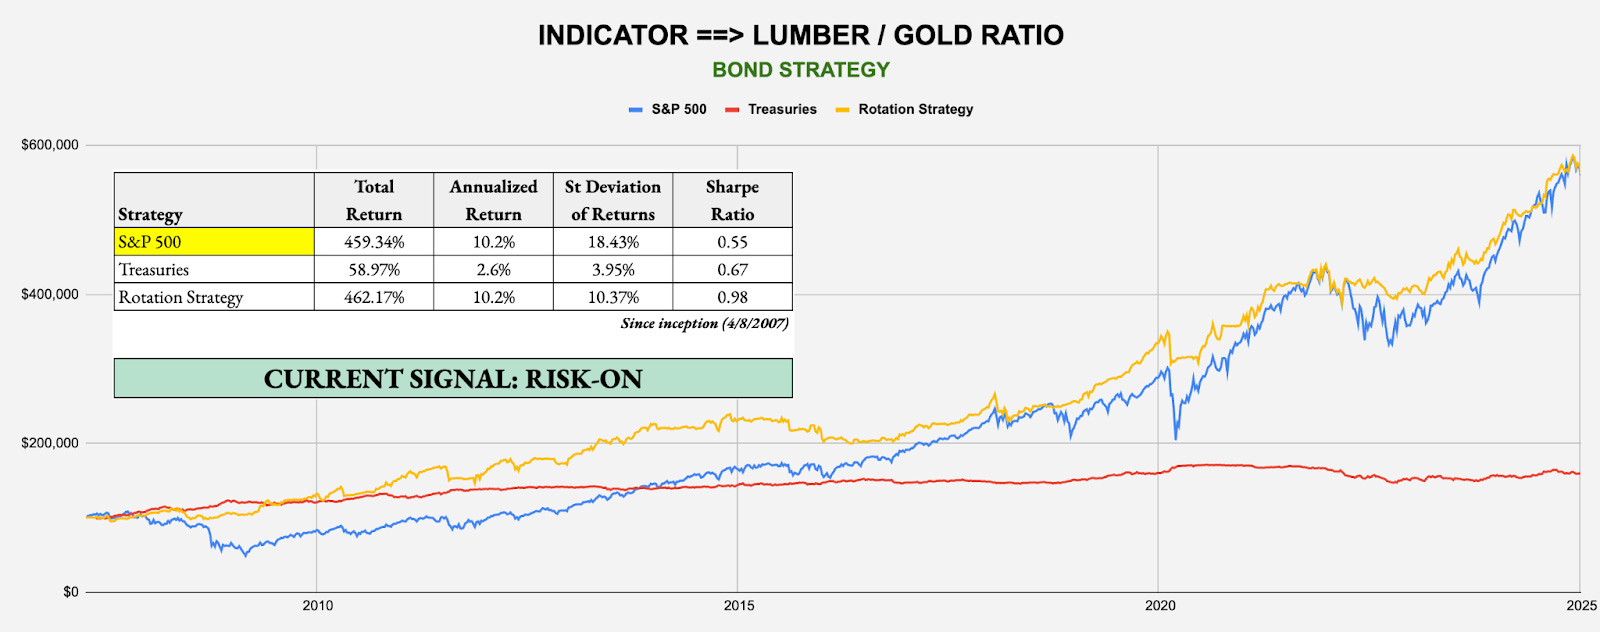
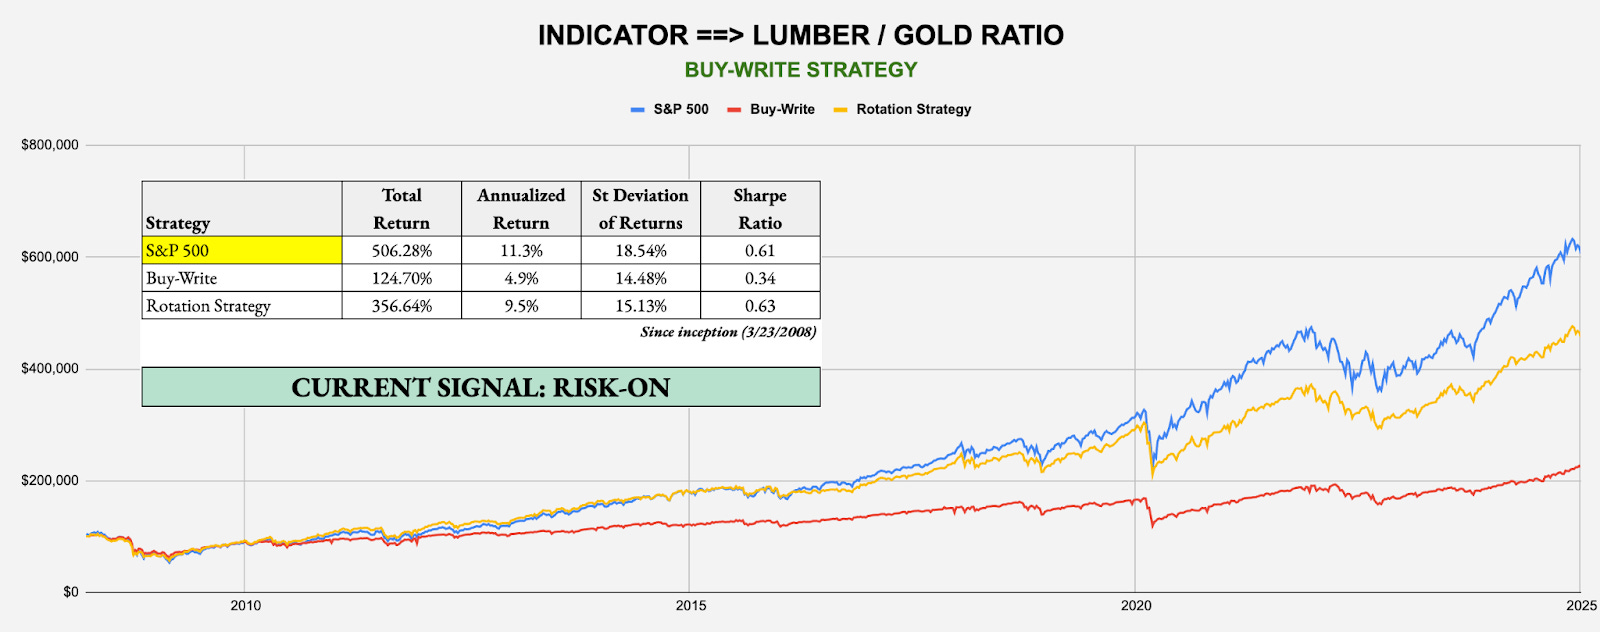
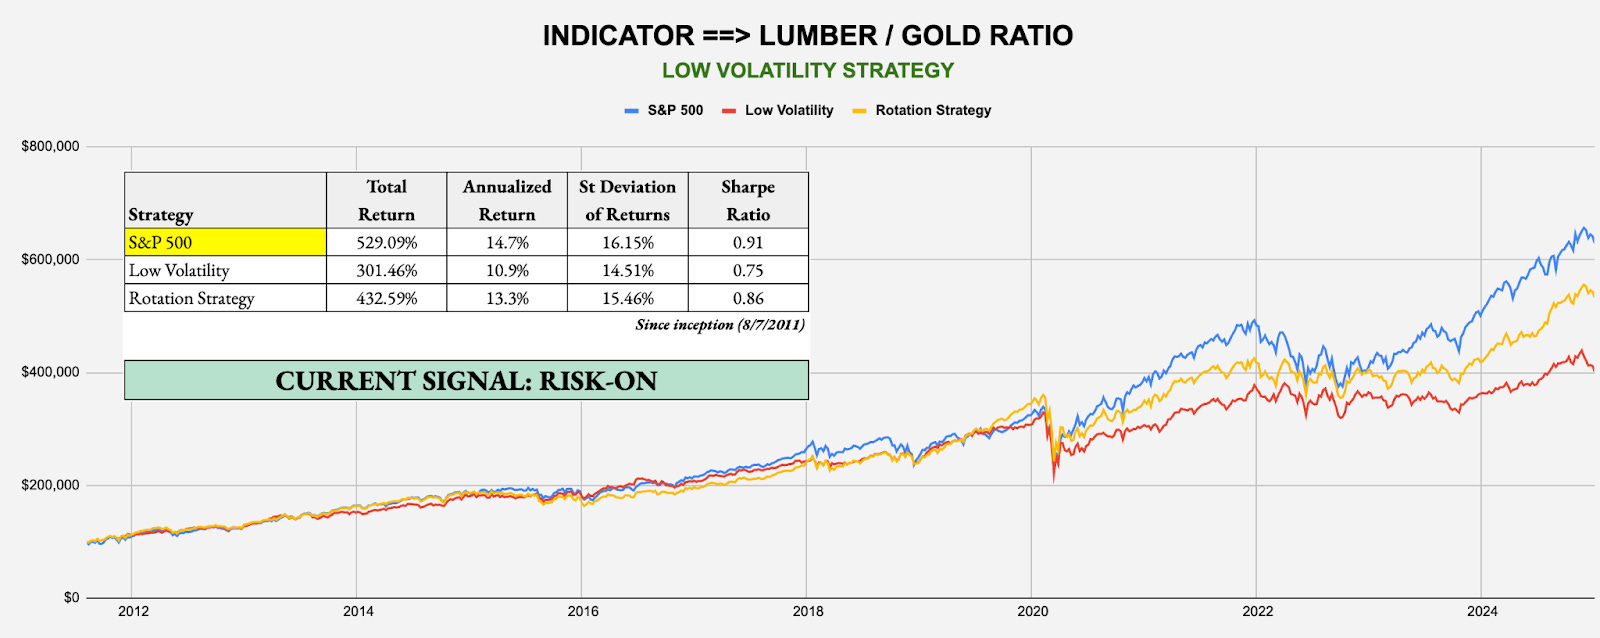
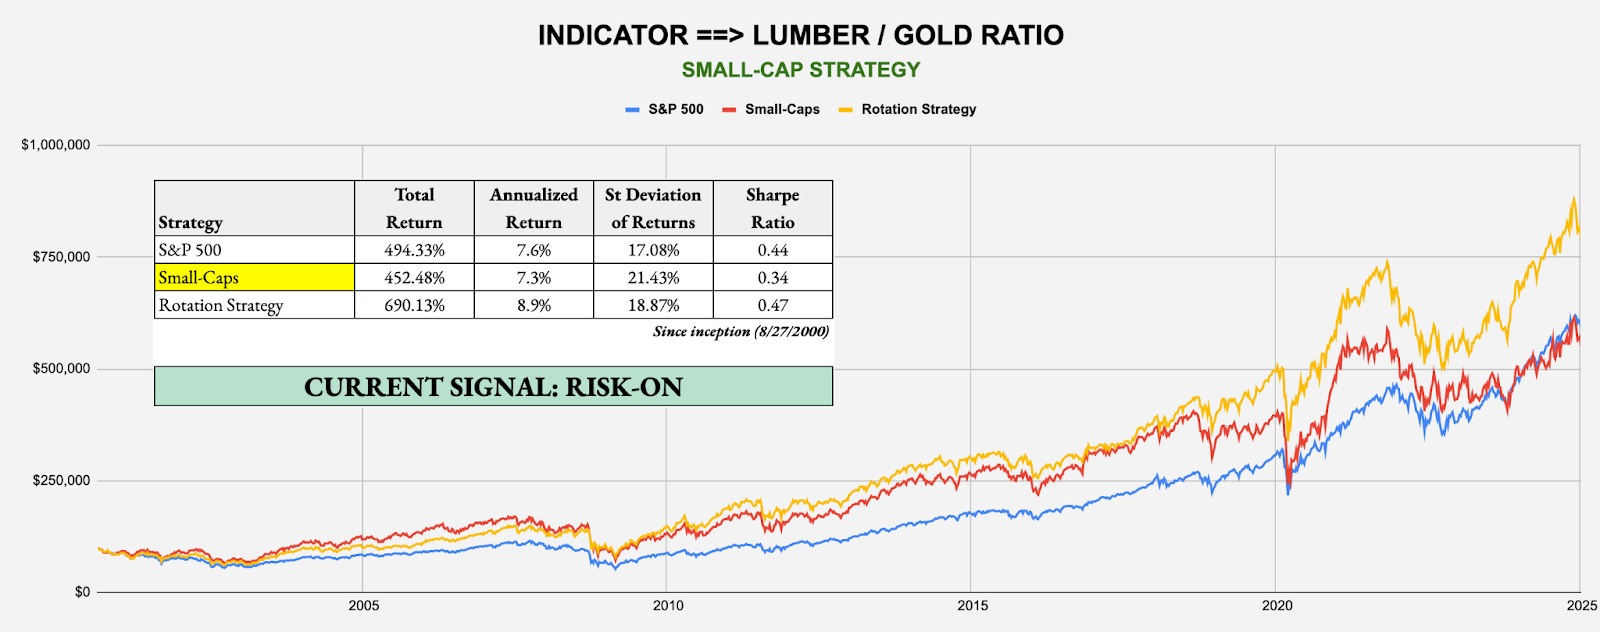
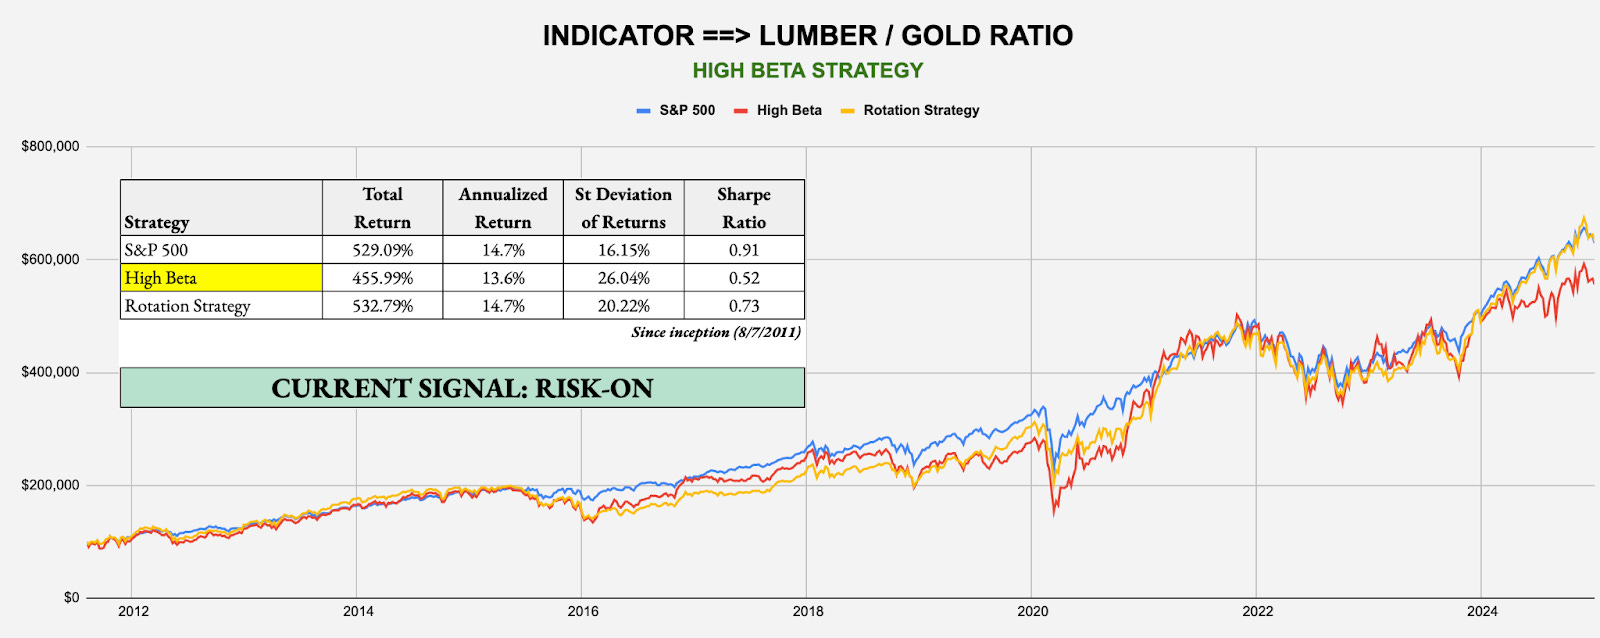
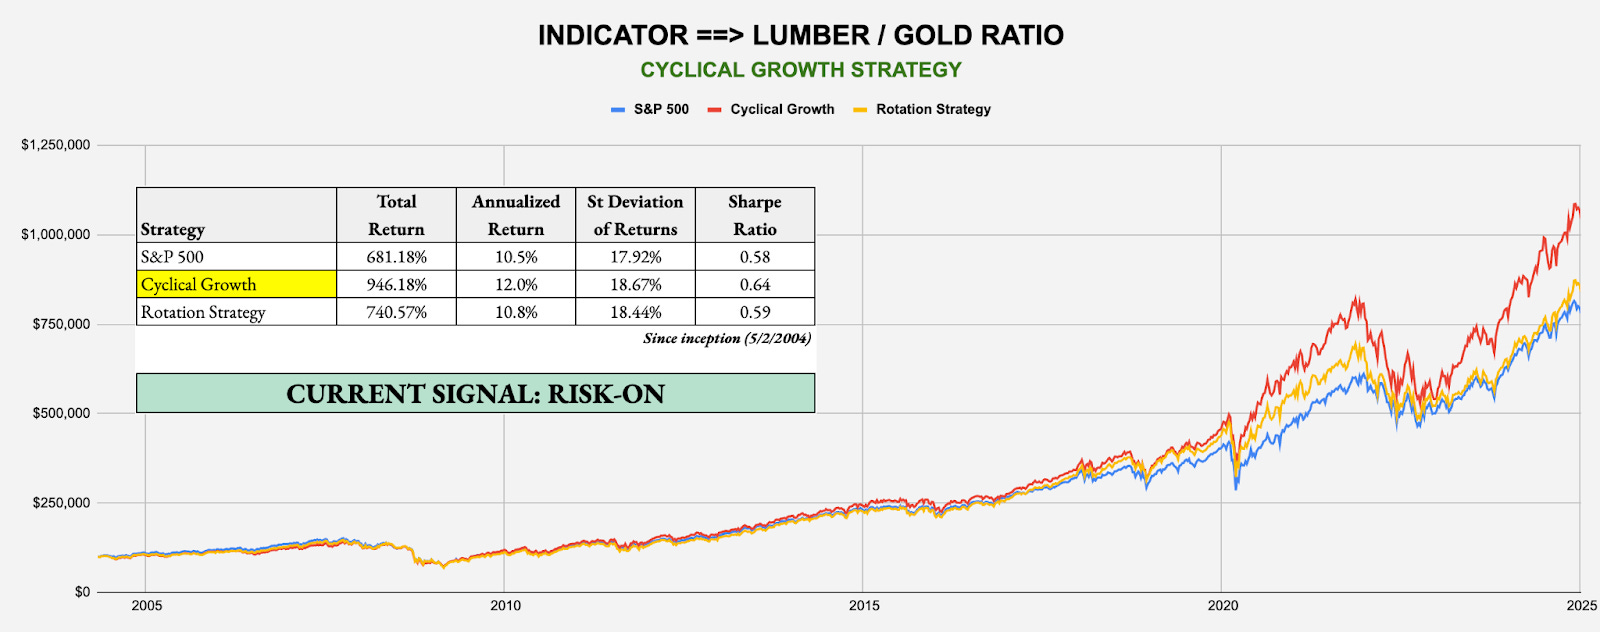
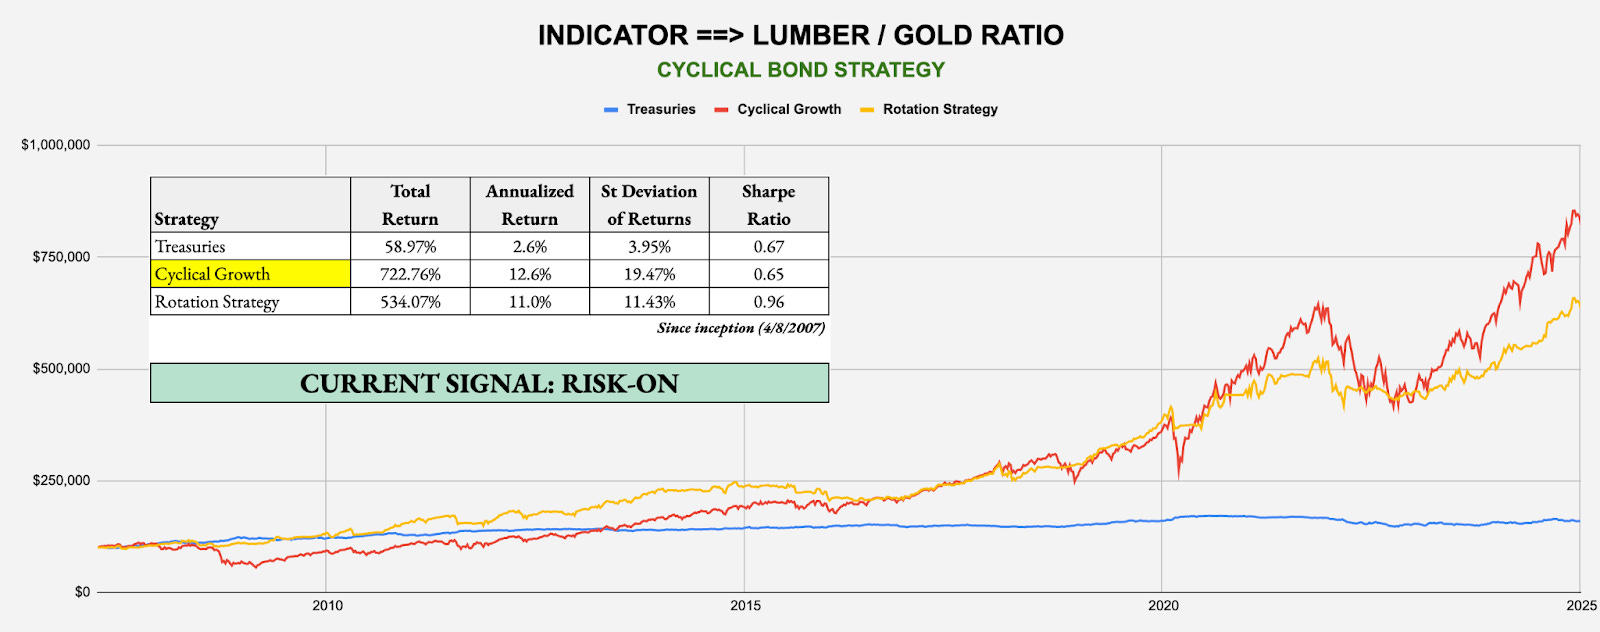
INTERMEDIATE-TERM SIGNAL: LUMBER/GOLD RATIO
Target Investor: Short- and long-term investors willing to trade more frequently using the classic cyclical vs. defensive asset comparison.
Current Indicator: Risk-On
Strategy: Lumber/Gold Bond - Example: Invest in S&P 500 (SPY) over Treasuries (GOVT)
Strategy: Lumber/Gold Buy-Write - Example: Invest in S&P 500 (SPY) over Buy-Write (PBP)
Strategy: Lumber/Gold Low Volatility - Example: Invest in S&P 500 (SPY) over Low Volatility (SPLV)
Strategy: Lumber/Gold Small-Cap - Example: Invest in Small-Caps (VSMAX) over Large-Caps (SPY)
Strategy: Lumber/Gold High Beta - Example: Invest in High Beta (SPHB) over S&P 500 (SPY)
Strategy: Lumber/Gold Cyclical Growth - Example: Invest in Growth (VUG) over S&P 500 (SPY)
Strategy: Lumber/Gold Cyclical Bond - Example: Invest in Growth (VUG) over Treasuries (GOVT)
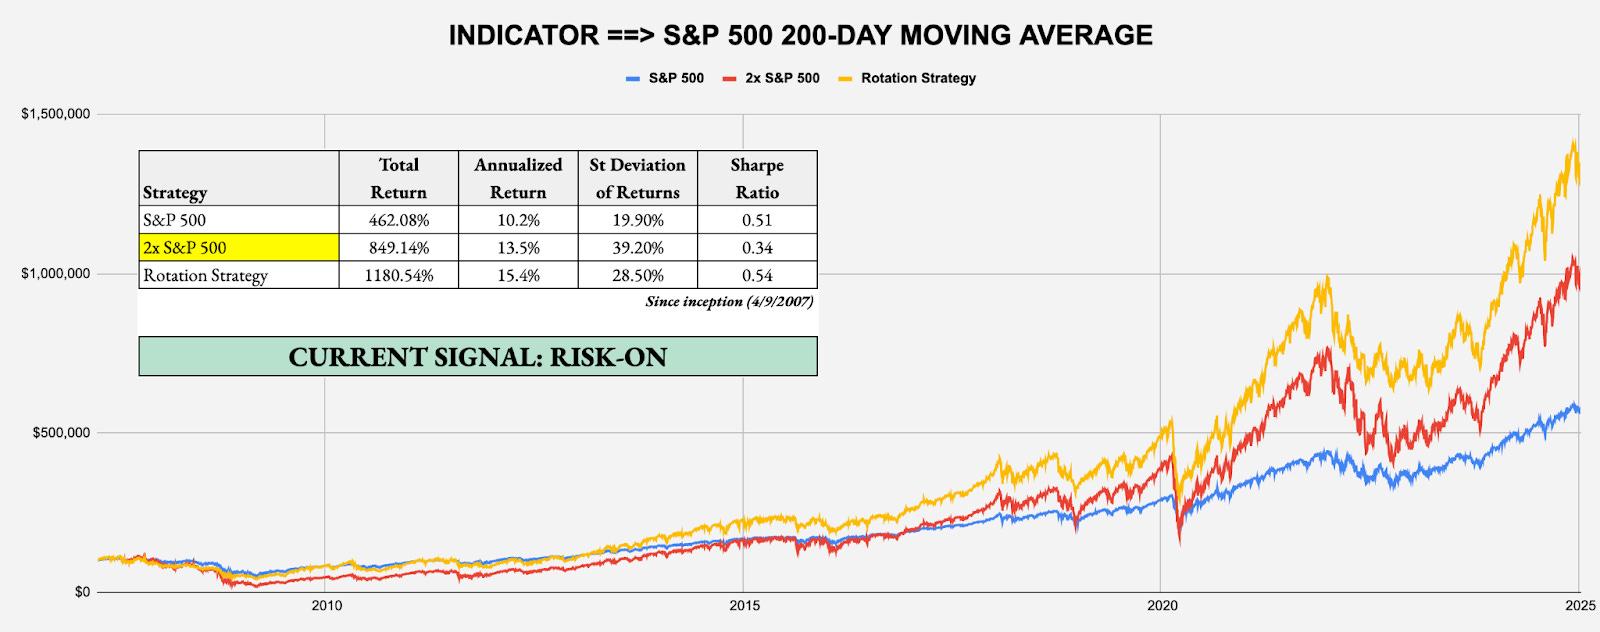
LONG-TERM SIGNAL: S&P 500 200-DAY MOVING AVERAGE
Target Investor: Long-term investors with a higher risk tolerance willing to move to an aggressive strategy when the signal flips to risk-on.
Current Indicator: Risk-On
Strategy: Leverage For The Long Run - Example: Invest in 2x-Leveraged S&P 500 (SSO) over S&P 500 (SPY)
About the Signals: The above trade signals and allocations are taken directly from each of the four award winning white papers I authored, which can be individually read at https://papers.ssrn.com/sol3/cf_dev/AbsByAuth.cfm?per_id=2224980. The underlying commonality across all risk-on/off signals and backtested strategies from these papers is the same: what matters isn’t being up more, but rather being down less. Each strategy historically has significantly outperformed through the avoidance of major drawdowns and volatile periods. The signals can change often from week to week, so it’s important to keep checking The Lead-Lag Report for updates. While not every trade and not every signal will be right, cumulatively over time, the identification of conditions that favor an accident in the stock market can help you slow down entering the storm, even if no one knows the exact mile marker where a crash might occur.
CONCLUSION
It’s interesting to note that the 10-year Treasury yield is almost to the level it was at its peak during the 2022-2023 inflation cycle. That despite the fact that the inflation rate is currently at 2.7% and not 9%. Back then, you had inflationary forces pushing rates higher, but recessionary concerns were also a thing and helping to create some counter-pressure from safety seekers. Today, we’ve got inflation rising, but no recessionary concerns at all. There’s no counter-pressure this time around, which means I wouldn’t be surprised to see the 10-year clear the 5% mark for the first time since 2007. There hasn’t been a “shock” yet, so to speak, but there’s clearly a slow burn of conditions progressively signaling risk-off conditions.
Politics may soon become a factor later this month. I’ve been concerned about how things have been setting up for the second half of January and the transition to a new presidential administration and the policy concerns that come with it figure to play a big role. Things are already shifting in a risk-off direction and it seems more likely than not that conditions could worsen before they improve.
The Lead-Lag Report is provided by Lead-Lag Publishing, LLC. All opinions and views mentioned in this report constitute our judgments as of the date of writing and are subject to change at any time. Information within this material is not intended to be used as a primary basis for investment decisions and should also not be construed as advice meeting the particular investment needs of any individual investor. Trading signals produced by the Lead-Lag Report are independent of other services provided by Lead-Lag Publishing, LLC or its affiliates, and positioning of accounts under their management may differ. Please remember that investing involves risk, including loss of principal, and past performance may not be indicative of future results. Lead-Lag Publishing, LLC, its members, officers, directors and employees expressly disclaim all liability in respect to actions taken based on any or all of the information on this writing.