
A Record Quarter, a 40-Year Yen Low, and a Refuted Peace Trade: Q3 Has Begun
The dot plot beat the peace trade at T+7, exactly as titled. A record quarter and a 40-year yen low now set Q3 terms.

Today’s Lead-Lag Report post is sponsored by TrendSpider

Markets move across multiple dimensions: flows, sector rotation, breadth, momentum, fundamentals, positioning, and risk.
The challenge is not just getting more data. It is turning that data into a repeatable research workflow.
That is where TrendSpider Sidekick excels.
Sidekick is TrendSpider’s AI-powered market analyst and trading assistant designed to help active investors research markets, analyze holdings, review charts, compare fundamentals, and monitor positions from one connected platform.
Sidekick Portfolio Agent allows users to connect supported brokerage accounts and ask Sidekick to analyze their live holdings in real time. That means Sidekick can help review open positions, portfolio weights, current PnL, and exposure across one or multiple accounts.
You can use Sidekick to:
● Analyze your current holdings from a single prompt
● Identify portfolio themes and potential exposure gaps
● Review sector concentration and position-level risk
● Compare fundamentals, technicals, and market context
● Set alerts across active positions without opening every chart manually
● Scan for names that match specific market, technical, or fundamental criteria
● Build a more structured market research and monitoring process
Sidekick helps turn market information into a more actionable research workflow.
Sign up for TrendSpider and experience the power of Sidekick at a steep discount.
Save up to 42% off:
https://trendspider.com?_go=leadlagreport
Receive $355 in free upgrades if you sign up by July 3.
Disclosure: This is a partner offer. Lead-Lag Media may receive compensation if you sign up through this link.
A Record Quarter, a 40-Year Yen Low, and a Refuted Peace Trade: Q3 Has Begun
Let me lead with the scoreboard, because for once it settles an argument rather than starting one. Seven days ago I titled this column “Gold Refused the Peace Trade But Couldn’t Refuse the Dot Plot.” Gold just closed the quarter at $3,969.30 on the COMEX August front-month, down another leg from the $4,129.90 I flagged on June 24, and down roughly 14% on the quarter — the worst three months for the metal since 2013. The $4,320 floor I said would break is not a floor anymore; it is a ceiling. The peace trade that everyone wanted to blame got upstaged by the one thing that actually reprices real assets: a Federal Reserve chair who told the market rates are going higher, and meant it. The verdict on that thesis is not ambiguous. Warsh’s higher-for-longer signal beat Hormuz, exactly as titled, and the same repricing that crushed gold quietly rewrote every other asset class in the closing weeks of Q2.
Here is the part the record-quarter headlines keep burying. The S&P 500 finished the quarter up about 14%, its best since the stimulus-fueled Q2 of 2020, the Nasdaq Composite added roughly 20%, and the Philadelphia Semiconductor Index put up something between 81% and 86% — the best quarter on record for the chip index, surpassing even the dot-com bacchanal of Q1 2000 and its 67.75% print. On Tuesday the S&P rose 1.18% to 7,440.43, the Nasdaq Composite jumped 2.07% to 25,820.14, and the Dow tacked on 0.59% to 52,182.74. That Dow number is a new all-time high. The index reclaimed the 50,000 handle it first crossed back on February 6, surrendered during the Iran war drawdown, and retook in May — so spare me the “first time” framing that is going to litter the financial press this week. What is genuinely new is the level, and the fact that it printed on a day the pension funds were supposed to be selling.
And they were supposed to be selling in size. JPMorgan penciled up to $165 billion in quarter-end equity rebalancing pressure into June 30, one of the largest such mechanical events on record, driven by equities crushing bonds all quarter. The market ate it whole. Alphabet, freshly added to the Dow, jumped 4.8% on its first day as a component; the semiconductors ripped; AeroVironment rose about 17% on earnings. The contradiction I keep coming back to is this: the AI hardware layer went vertical while the hyperscalers who are actually spending the money bled out. The Magnificent Seven are down about 4% year-to-date — Microsoft off 24%, Meta down nearly 15% — while the picks-and-shovels chip suppliers doubled. Markets have decided the near-term monopoly on AI cash flow belongs to whoever sells the shovels, not whoever digs with them. That is a rational bet against $754 billion of projected hyperscaler capex with no clean line of sight to return. It is also the kind of bet that works right up until it doesn’t.
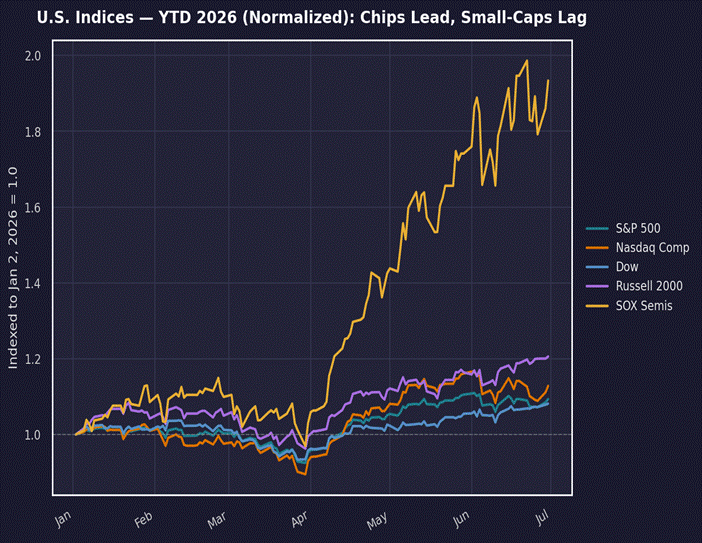
Chart 1 — U.S. indices, indexed to January 2, 2026. The SOX semiconductor complex left every large-cap index behind.
(Continued for paid subscribers)
Cross the Pacific and the same trade shows up with the volume turned to eleven. The Nikkei 225 closed at 70,062.32, up about 37% on the quarter — the best quarter on record — and Korea’s KOSPI put up an almost cartoonish 67.77% to 8,476.48, its biggest quarterly gain since Q4 1998. Taiwan’s Taiex ran roughly 46%. Europe was the tortoise: the STOXX 600 gained about 9.7%, its best quarter since 2020, with the DAX up double digits and the FTSE 100 a comparative laggard near 4% as its commodity and political weightings dragged. The central banks moved with the tape rather than against it. The ECB delivered its first hike since September 2023 on June 11, lifting the deposit rate to 2.25%, and the Bank of Japan raised to 1.00% on June 16 — a 31-year high — while the Bank of England held at 3.75% on a 7-2 vote on June 18, with the two dissenters wanting a hike. This is a synchronized global tightening impulse, and it is happening while equities make records. That combination does not usually end with everyone getting paid.
The divergence between Japan’s equity euphoria and its currency is the single most instructive chart of the quarter. The Nikkei printed the best quarter in its history and the yen printed a 40-year low, settling at 162.42 per dollar — the weakest since December 1986 — even after the BoJ hiked. Rate differentials trump domestic tightening when the other side of the trade is a Fed being repriced toward hikes, and the carry trade that was supposed to unwind simply refused to. Tokyo’s finance ministry is back to jawboning about acting “at any time,” which is what officials say when the intervention clock is running but the ammunition is finite. Foreigners, notably, have been selling into both the Japanese and Korean rallies to rebalance — this is a domestic and retail melt-up, not fresh global conviction, and that is a more fragile foundation than the index levels suggest.
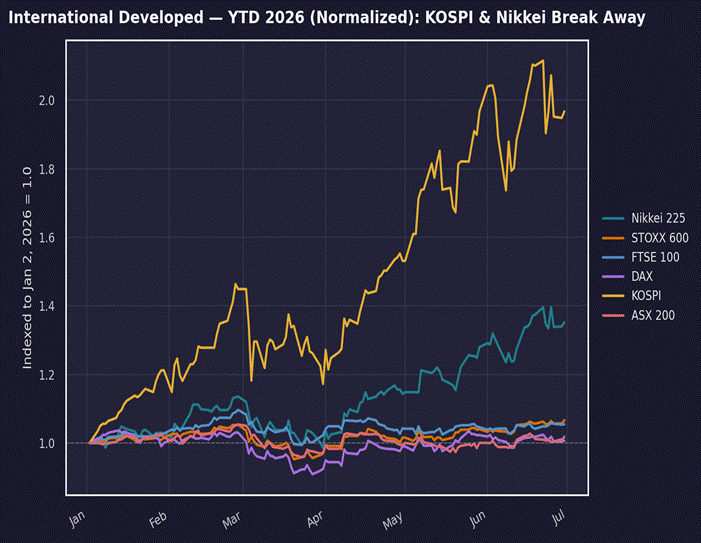
Chart 2 — International developed markets, indexed to January 2, 2026. KOSPI and Nikkei broke away from a plodding Europe.
Emerging markets tell the cleanest version of the whole story, because they separate the winners and the casualties by force. The MSCI EM index leads every major region year-to-date at +26.35%, but strip out TSMC, Samsung, and SK Hynix and that headline evaporates — three memory names carry the bloc. On the other end, MSCI China is down 14.64% year-to-date, its worst relative showing against developed markets since the aftermath of 2001, with Tencent and Alibaba each shedding more than 29%. The China story itself is split down the middle: the domestic CSI 300 is up roughly 26% on the year as A-share chip manufacturers ride the AI capex wave, while offshore Hang Seng fell about 7.5% on the quarter, the worst in Asia. Two markets, one country, opposite directions.
And the genuine wreck is Indonesia, where the Jakarta Composite closed at 5,643.19, down a staggering 35.49% on the year — the worst major equity index on the planet, undone by capital flight, a rupiah at record lows, and civil unrest that traces straight back to imported energy inflation. India held up better in relative terms; the Nifty 50 closed at 23,865.75 and the Sensex at 76,478.67, both slipping on the session as IT names took profit and rate-hike fear crept in, with the Reserve Bank still holding its repo rate at 5.25%. The three-speed EM — chip exporters, a bifurcated China, and Hormuz’s oil-importing victims — is not noise. It is the map of who pays when the war premium and the rate premium move in opposite directions at the same time.
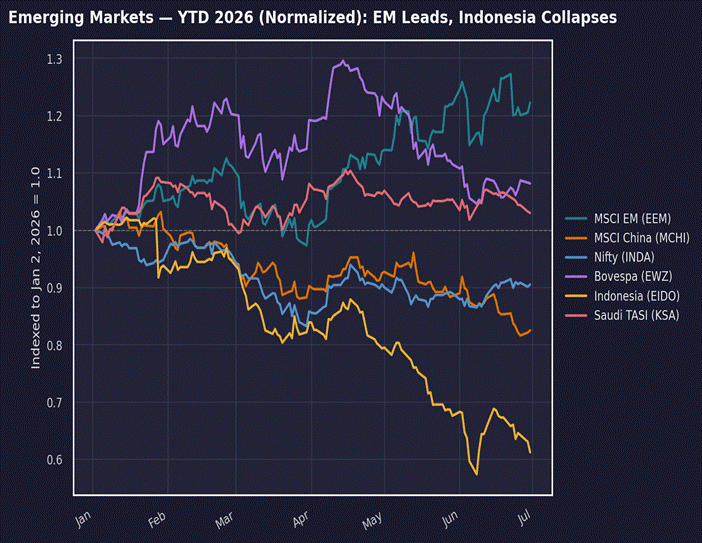
Chart 3 — Emerging markets, indexed to January 2, 2026. EM leads on chips while Indonesia and China diverge sharply.
Which brings me to the corner of the market where my thesis lives and where the regime reset is most visible. Gold at $3,969.30 on the COMEX August contract — spot briefly touched $3,956.92 intraday, breaking the $4,000 handle to the downside — is not the peace-trade story the consensus keeps trying to tell. Brent fell about 38% on the quarter to $72.92 and front-month WTI settled at $69.50, the largest quarterly drop for crude since the COVID collapse, and it happened while the Strait of Hormuz sat physically closed for a 124th straight day. Read that again: the largest oil supply disruption in modern history is still in effect, and oil round-tripped back to pre-war levels anyway, because the market is pricing the probability of resolution ahead of the fact of it. Bitcoin closed near $58,056, down about 12% on the quarter as the AI trade vacuumed up the risk-on liquidity crypto used to command, and ether was worse, near $1,600 for a roughly 25% quarterly loss and its first-ever three straight quarterly declines. The dollar, meanwhile, ground out a fourth consecutive quarterly gain, with the DXY closing at 101.163.
In my view the market is missing that gold, oil, and crypto did not each break for their own idiosyncratic reason — they broke together, on one repricing, and the asset that quietly won the argument is the dollar. Real yields did this. The 10-year TIPS breakeven sits near 2.22% while the nominal 10-year yields 4.36%, an implied real yield above 2% that historically strangles gold, and PCE at 4.1% headline and 3.4% core — the hottest since 2023 — is the reason Warsh can say higher-for-longer with a straight face. Notably, bond volatility is down: the MOVE index sits near 65, off roughly 42% from its Q1 panic peak, which tells me the market believes the hawkish regime rather than fearing it. That is a market on borrowed time only if inflation cools on schedule — and the June flash prints out of Germany at 2.3% and France at 2.0% suggest Europe’s disinflation may arrive faster than America’s.
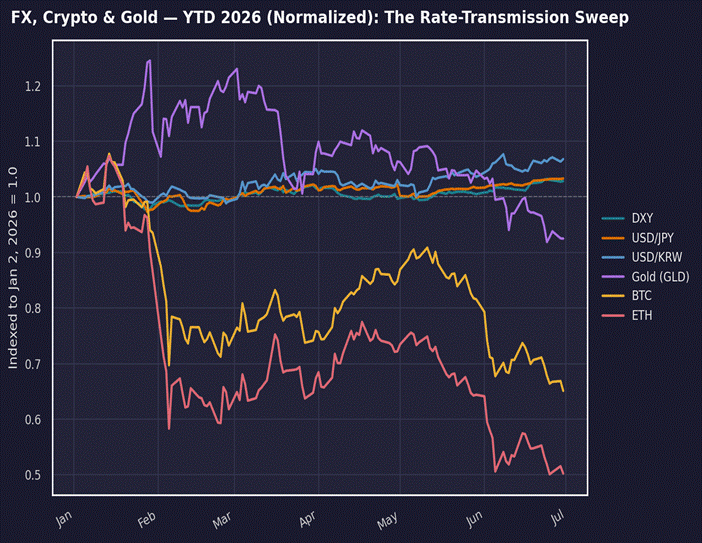
Chart 4 — FX, crypto, and gold, indexed to January 2, 2026. The rate-transmission sweep: real assets down, dollar firm.
What I’m watching next week: Warsh at the ECB’s Sintra forum yesterday, his first major communication since the FOMC, for any hint that the “hawkish hold” tilts toward an actual September move. I’m watching the July jobs report for confirmation that a 7.594-million JOLTS print and a robust labor market keep the hike alive. I’m watching whether the yen’s 40-year low forces Tokyo’s hand on intervention, and whether the ECB’s July path softens now that German and French inflation are undershooting. I’m watching the gold-refusal thesis one more week for a T+14 stamp, though the ink is nearly dry: refuter dominant. And I’m watching the one number that has quietly narrated the entire quarter and will narrate the next — the dollar. It won Q2 without anyone cheering for it. Q3 starts now, and it starts on the dollar’s terms.
The Lead-Lag Report is provided by Lead-Lag Publishing, LLC. All opinions and views mentioned in this report constitute our judgments as of the date of writing and are subject to change at any time. Information within this material is not intended to be used as a primary basis for investment decisions and should also not be construed as advice meeting the particular investment needs of any individual investor. Trading signals produced by the Lead-Lag Report are independent of other services provided by Lead-Lag Publishing, LLC or its affiliates, and positioning of accounts under their management may differ. Please remember that investing involves risk, including loss of principal, and past performance may not be indicative of future results. Lead-Lag Publishing, LLC, its members, officers, directors and employees expressly disclaim all liability in respect to actions taken based on any or all of the information on this writing.