
A Trillion Dollars in the Ground
What the AI Capex Cycle Has in Common With Every Buildout That Came Before It

Today’s Lead-Lag Report post is sponsored by Sparkline
Looking for a fresh take on value investing? ITAN helps investors modernize their U.S. value allocations, providing exposure to innovative, intangible-rich companies at attractive prices.
Learn more by visiting the ITAN Website or contacting the Sparkline Team.
DISCLAIMER – PLEASE READ: This is sponsored advertising content for which Lead-Lag Publishing, LLC has been paid a fee. The information provided in the link is solely the creation of Sparkline Capital. Lead-Lag Publishing, LLC does not guarantee the accuracy or completeness of the information provided in the link or make any representation as to its quality. All statements and expressions provided in the link are the sole opinion of Sparkline Capital and Lead-Lag Publishing, LLC expressly disclaims any responsibility for action taken in connection with the information provided in the link.
A Trillion Dollars in the Ground
KEY HIGHLIGHTS
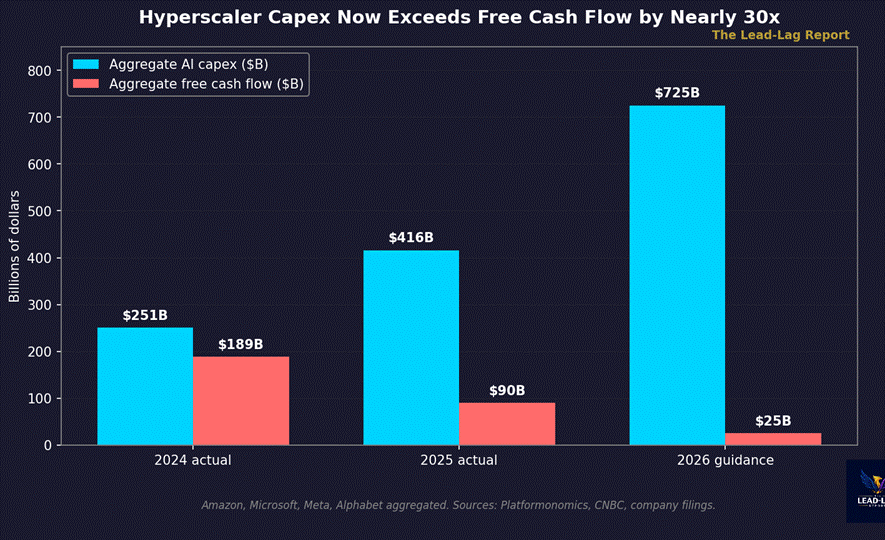
• The four largest hyperscalers spent $416 billion on capex in 2025 and have guided to roughly $725 billion in 2026, while Amazon’s trailing-twelve-month free cash flow collapsed 95%, from $38.2 billion to $1.2 billion.
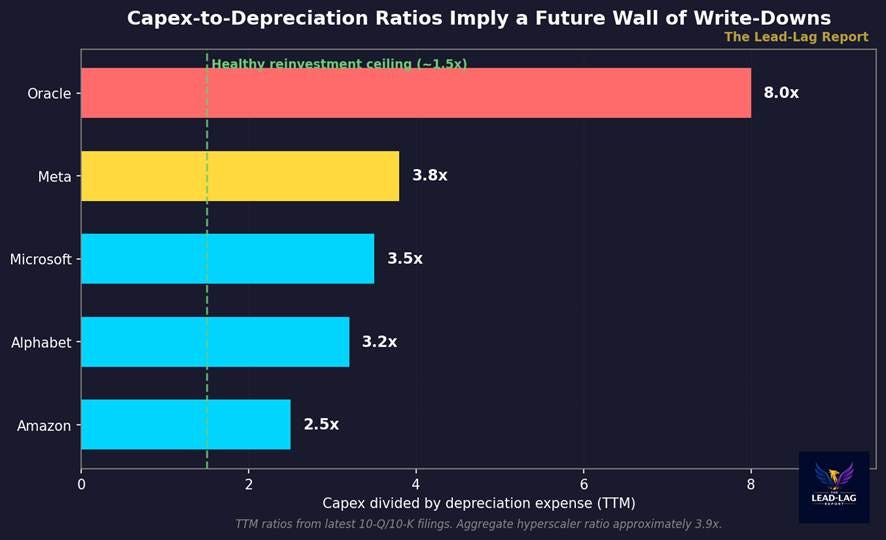
• Aggregate capex now runs about 3.9 times annual depreciation across the hyperscalers. Oracle sits at 8x. These ratios mean the eventual depreciation cliff is being engineered into earnings, not yet absorbed.
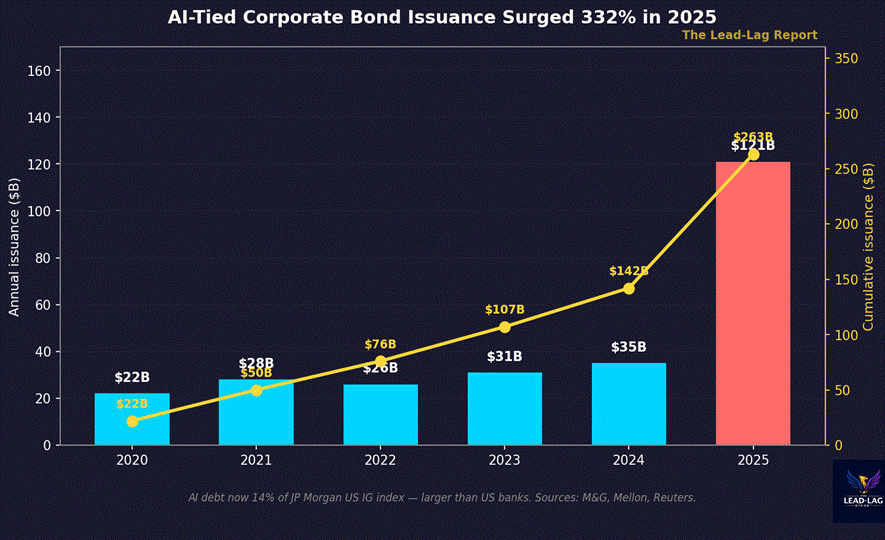
• AI-tied corporate bond issuance hit $121 billion in 2025, a 332% surge versus the 2020-2024 baseline. AI debt is now 14% of the JP Morgan US investment-grade index — a larger weight than US banks.
• Less than 5% of the fiber buried during the 1996-2001 telecom buildout was ever lit. Most of the builders went bankrupt. The shape of that capex curve and the current AI curve are almost identical.
• Microsoft’s annualized AI revenue is roughly $37 billion against $97 billion of LTM capex — about 38% coverage. MIT’s Project NANDA finds 95% of organizations report zero return on generative AI. The demand side is not keeping pace with the supply side.
Every great capex bubble looks the same in real time. The technology is real. The buildout is necessary. The CEOs sound brilliant. The bankers underwrite the bonds. And then, years later, the receiver shows up.
I have spent a lot of time this year trying to figure out where we are in the AI cycle. Not whether AI is real — it is. Not whether it will reshape industries — it already has. The question I keep coming back to is narrower: who pays for the infrastructure, on what timeline, and against what cash flows.
The numbers no longer add up. The four largest hyperscalers spent $416 billion on capex in 2025.[1] Their guidance for 2026 implies roughly $725 billion, a 77% increase in a single year.[2] Amazon’s trailing-twelve-month free cash flow collapsed from $38.2 billion to $1.2 billion — a 95% decline.[3] That is not a slowdown. That is what a company does in the early stages of a buildout it cannot finance from operations.
The Capex-to-Depreciation Math
Here is the equation that matters. Capital expenditure today becomes depreciation expense tomorrow. When capex is roughly equal to depreciation, the business is in steady-state reinvestment. When capex is two times depreciation, the business is growing. When capex is four times depreciation — which is roughly where the hyperscalers sit — the business is making a bet that the future earnings stream will be large enough to absorb the eventual depreciation hit.
The aggregate capex-to-depreciation ratio across the five largest AI infrastructure spenders is approximately 3.9x on a trailing-twelve-month basis.[4] Oracle is at 8x. Meta is at 3.8x. Microsoft is at roughly 3.5x. Alphabet at 3.2x. Amazon at 2.5x. None of these companies has ever operated with a capex-to-depreciation ratio this high for a sustained period.
And there is a second layer hidden inside the depreciation line. Every one of the five major hyperscalers extended the useful life of its server fleet toward six years between 2022 and 2024 — a non-cash accounting change that added roughly $8-9 billion in net income per company per year.[5] Amazon, notably, reversed itself effective January 1, 2025, shortening its assumed useful life back to five years. The IRS, under the MACRS schedule, has always assumed five years.[6] The divergence between GAAP and tax accounting is a flattering temporary distortion of earnings. It will normalize. The One Big Beautiful Bill Act, signed July 4, 2025, made 100% bonus depreciation permanent — a fiscal tailwind that pulls tax shields forward but does not change the underlying economics of the equipment.[7]
The Shape of Every Capex Bubble
History does not repeat, but the shape of a capex bubble has been remarkably consistent across two centuries. The 1873 railroad panic began when Jay Cooke & Co. failed on September 18, 1873, after overextending on the Northern Pacific.[8] The collapse triggered bank runs and a decade-long depression. The technology — transcontinental rail — was real and transformative. The financing structure was not.
The 1996-2001 telecom buildout is closer in form. Telecom carriers deployed roughly $1 trillion in capital, laid an estimated 80 million miles of fiber, and less than 5% of that fiber was ever lit by 2004.[9] WorldCom, Global Crossing, and Winstar filed for bankruptcy. The companies that financed the buildout disappeared. The companies that bought the assets out of bankruptcy at pennies on the dollar — the second-wave operators — became durably profitable. The fiber itself, twenty-five years later, still carries traffic. The technology was right. The first-wave investors were wrong.
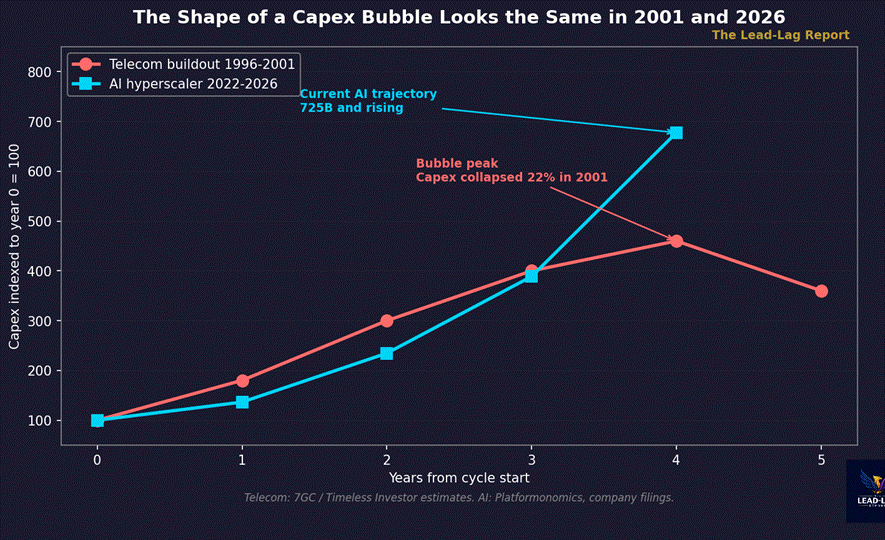
Index the telecom capex curve and the AI hyperscaler capex curve to year zero, and the shapes are nearly identical for the first four years. The telecom curve broke in year five — capex collapsed 22% in 2001. The AI curve has not broken yet. The hyperscaler guidance for 2026 implies that capex grows another 77% from 2025. We are, on the buildout timeline, somewhere between 1999 and 2000.
The Bond Market Has Decided Already
Look at how the AI infrastructure is being financed and the picture sharpens. AI-tied corporate bond issuance was approximately $121 billion in 2025, against a 2020-2024 baseline of roughly $28 billion per year — a 332% surge in a single year.[10] Meta priced $30 billion in September 2025. Oracle priced $18 billion in October 2025 and arranged an additional $38 billion in project finance.[11] AI debt now represents about 14% of the JP Morgan US investment-grade index — a larger weight than US banks, the traditional anchor of the index.[12]
Then there is the pure-play layer. CoreWeave carries approximately $14.8 billion in debt against a debt-to-equity ratio of roughly 4.5x, generated negative $7.25 billion in free cash flow last year, and derives approximately 70% of its revenue from a single counterparty, OpenAI.[13] This is the WorldCom of the cycle. Not in the sense of fraud — nothing is suggested there — but in the structural sense. A pure-play infrastructure operator, levered, single-customer concentration, financing a buildout on assumptions about future demand from a customer that is itself unprofitable. That story has a known ending.
The Demand Side Is Not Showing Up
If the AI capex were producing commensurate revenue, none of this would matter. Microsoft’s annualized AI revenue is approximately $37 billion against LTM capex of approximately $97 billion — about 38% coverage, even if every dollar of that AI revenue dropped straight to free cash flow, which it does not.[14] MIT’s Project NANDA reports that 95% of organizations are seeing zero return on generative AI investments.[15] RAND finds that 80.3% of AI projects fail. Gartner projects that 60% of enterprise AI projects will be cancelled by the end of 2026. McKinsey finds that only 6% of companies see more than a 5% EBIT contribution from AI deployments.[16]
Pivotal Research projects that Alphabet’s free cash flow will decline by approximately 90% between 2025 and 2026 if the company executes on its $180-185 billion capex guidance.[17] That is not a number that survives contact with a shareholder base that has been trained for fifteen years to expect rising cash returns. The discipline cracks somewhere.
Power makes it worse. The PJM 2026/27 capacity auction cleared at $329.17 per megawatt-day — the FERC-approved cap, up from $269.92 the prior year.[18] ERCOT projects peak demand of 367,790 megawatts by 2032, against an 85,508 megawatt peak in 2023 — a 4.3x increase driven primarily by data centers. The Department of Energy projects data centers will consume 12% of US power by 2028, up from 4.4% in 2023.[19] The grid is not configured to deliver that power on the timeline the buildout assumes.
The Other Side
It is worth taking the bull case seriously. Three arguments deserve a full hearing.
First, Jensen Huang has argued repeatedly that compute is revenue — that the infrastructure being built today is the revenue base of tomorrow, and that the right comparison is not telecom fiber but the railroads after the panic, where the long-run economic surplus dwarfed the first-wave losses.[20] He is not wrong about the long arc. He is potentially very wrong about who captures it.
Second, Mary Meeker’s 2025 AI Trends report documents that inference cost has fallen approximately 87% over twelve months.[21] If that deflation curve continues, the gap between AI capex and AI revenue closes from the demand side. Cheaper inference unlocks workloads that today are not economic, and the addressable market expands faster than the supply.
Third — and this is the one I take most seriously — Stanley Druckenmiller opened new positions in Amazon, Meta, and Alphabet in the third quarter of 2025, after the free cash flow concerns had become widely understood.[22] Druckenmiller is not a buy-and-hold investor. He is making a tactical call that the market has overcorrected on near-term cash flow and underpriced the optionality on AI revenue maturation. He has been right about turns like this before.
The contrarian thesis fails only if aggregate hyperscaler AI revenue exceeds aggregate AI capex on a trailing-twelve-month basis by the end of Q4 2026. The current ratio is approximately 0.3 to 0.4x. The gap closes if revenue triples or capex halves. Neither is in the guidance.
The Lead-Lag Dynamic: Capex Is the Lead
The lead-lag relationship in this cycle is unusually clean. Capex is the lead. Revenue is the lag. Bond issuance is concurrent with capex and decoupled from revenue. The spread between the two will close — it always does — and the direction it closes in determines whether this looks like the second wave of telecom or the third wave of railroads.
In every prior buildout, the technology was real, the demand was real, and the long-run economic surplus was enormous. The first-wave investors still lost. The reason is structural, not technological. When you finance a long-duration asset with short-duration capital, mark the depreciation through accelerated lives, and assume the demand curve catches the supply curve before the cash runs out, the math has to break before it heals.
I am not telling anyone what to do with this. I am noting that the shape of the curve, the structure of the financing, and the magnitude of the depreciation cliff all rhyme with episodes that did not end well for the people closest to the buildout. The technology survives. The fiber lights eventually. The companies that finance the first wave usually do not.
Few understand this.
— — —
Notes
[1] Platformonomics, “Follow The CAPEX: 2025 Retrospective.” Aggregate four-hyperscaler capex: approximately $416B in calendar 2025. https://platformonomics.com/2026/02/follow-the-capex-2025-retrospective/
[2] CNBC, “Google, Microsoft, Meta and Amazon to spend more than $700B on AI.” 2026 guidance midpoint: approximately $725B. https://www.cnbc.com/2026/02/06/google-microsoft-meta-amazon-ai-cash.html
[3] TechTimes, “Amazon Free Cash Flow Falls From $38B to $1.2B,” May 19, 2026. Amazon TTM FCF as reported in Q1 2026 10-Q. https://www.techtimes.com/articles/316801/20260519/amazon-free-cash-flow-fall-38-billion-12-billion-bullish-memo-circulating-justify-bigger.htm
[4] Aggregate hyperscaler capex/depreciation ratio approximately 3.9x ($482B LTM capex / $125B LTM depreciation across Amazon, Microsoft, Alphabet, Meta, Oracle). Computed from latest 10-Q/10-K filings.
[5] WireSift, “AI Server Depreciation Schedule Changes.” Hyperscaler useful-life extensions added approximately $8-9B annually in net income per company.
[6] DeepQuarry, “Amazon Reverses Server Lifespan Revision.” Amazon shortened assumed useful life from 6 to 5 years effective January 1, 2025.
[7] ComputeLaw Blog, “Bonus Depreciation and AI Data Centers.” One Big Beautiful Bill Act signed July 4, 2025, restored 100% bonus depreciation permanently.
[8] Harvard Business School Baker Library, “1873: Off the Rails.” Jay Cooke & Co. failure on September 18, 1873.
[9] The Timeless Investor, “They Buried a Trillion Dollars Underground” and 7GC, “AI Capex and the Telecom Bubble: A Comparative Analysis.” Estimated 80 million miles of fiber laid 1996-2001; less than 5% lit by 2004.
[10] M&G Investments, “AI Debt Deluge Hitting Bond Markets” and Mellon Investments, “Record-Breaking AI Debt Issuance 2025.” 2025 AI-tied IG issuance approximately $121B vs $28B average 2020-2024.
[11] Blockchain.news / Kobeissi Letter, “AI Data Center Financing $126B.” Meta $30B September 2025; Oracle $18B October 2025 plus $38B project finance.
[12] Reuters Breakingviews, “Bond Investors Hitch One-Way Ride on AI.” AI debt approximately 14% of JP Morgan US IG index.
[13] Macrospire, “CoreWeave Q4 2025 Analysis” and CoreWeave IR. Approximately $14.8B debt, 4.5x D/E, -$7.25B FCF, approximately 70% revenue from OpenAI.
[14] Microsoft FY2026 Q3 results. Annualized AI revenue approximately $37B against LTM capex approximately $97B.
[15] Analysis Atlas, “Generative AI Enterprise Adoption 2026,” citing MIT Project NANDA. 95% zero-ROI finding.
[16] RAND, Gartner, McKinsey enterprise AI deployment surveys, 2025-2026. 80.3% project failure rate; 60% cancellation by end-2026; 6% material EBIT contribution.
[17] Pivotal Research, Alphabet capex/FCF projection. 2025 capex $91B to 2026 guidance $180-185B; approximately 90% FCF decline.
[18] PJM Interconnection, “2026/27 Base Residual Auction Official Results.” Clearing price $329.17/MW-day, FERC-approved cap.
[19] ERCOT, “Preliminary Long-Term Load Forecast 2026-2032” and Lawrence Berkeley National Laboratory, “2024 US Data Center Energy Usage Report.” ERCOT 2032 forecast 367,790 MW vs 85,508 MW 2023 peak; DOE projects data centers 12% of US power by 2028 up from 4.4% in 2023.
[20] Fortune, “Jensen Huang: $700B AI Capex Just the Start,” and Benzinga, “Nvidia CEO Pushes Back on Capex Fears.”
[21] TBPN Digest, “Mary Meeker AI Trends Report 2025.” Inference cost approximately -87% over twelve months.
[22] Yahoo Finance, “Druckenmiller All In on AI.” Q3 2025 13F filings showed new positions in Amazon, Meta, and Alphabet.
The Lead-Lag Report is provided by Lead-Lag Publishing, LLC. All opinions and views mentioned in this report constitute our judgments as of the date of writing and are subject to change at any time. Information within this material is not intended to be used as a primary basis for investment decisions and should also not be construed as advice meeting the particular investment needs of any individual investor. Trading signals produced by the Lead-Lag Report are independent of other services provided by Lead-Lag Publishing, LLC or its affiliates, and positioning of accounts under their management may differ. Please remember that investing involves risk, including loss of principal, and past performance may not be indicative of future results. Lead-Lag Publishing, LLC, its members, officers, directors and employees expressly disclaim all liability in respect to actions taken based on any or all of the information on this writing.