

Below is an assessment of the performance of some of the most important sectors and asset classes relative to each other with an interpretation of what underlying market dynamics may be signaling about the future direction of risk-taking by investors. The below charts are all price ratios which show the underlying trend of the numerator relative to the denominator. A rising price ratio means the numerator is outperforming (up more/down less) the denominator. A falling price ratio means underperformance.
LEADERS: ANOTHER TECH-ONLY RALLY
Technology (XLK) – Safe To Test The Waters
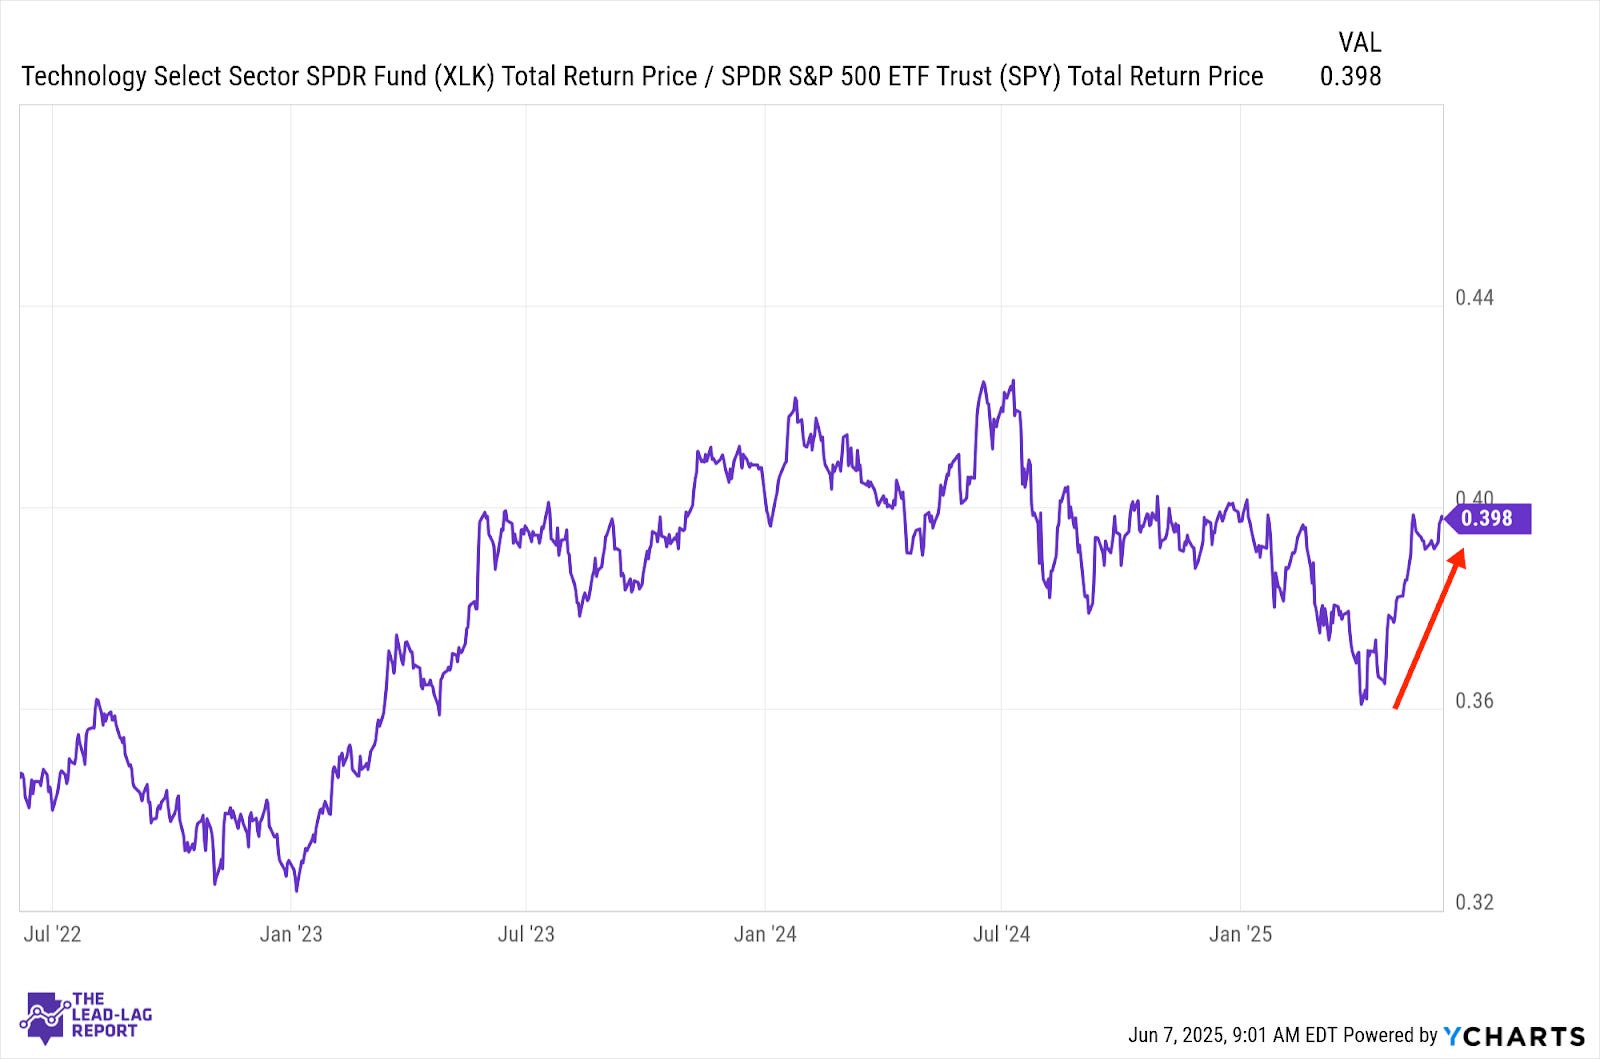
Investors have largely pivoted back into a bullish mood. A generally positive report on the labor market last week has seemed to confirm to investors that recession is not an immediate risk and it’s safe to test the water again on riskier assets. Inflation has not spiked (yet) and stocks could continue pushing higher as long as the status quo is maintained and there aren’t any systemic shocks.
Industrials (XLI) – Reshoring Driving Revenue Growth
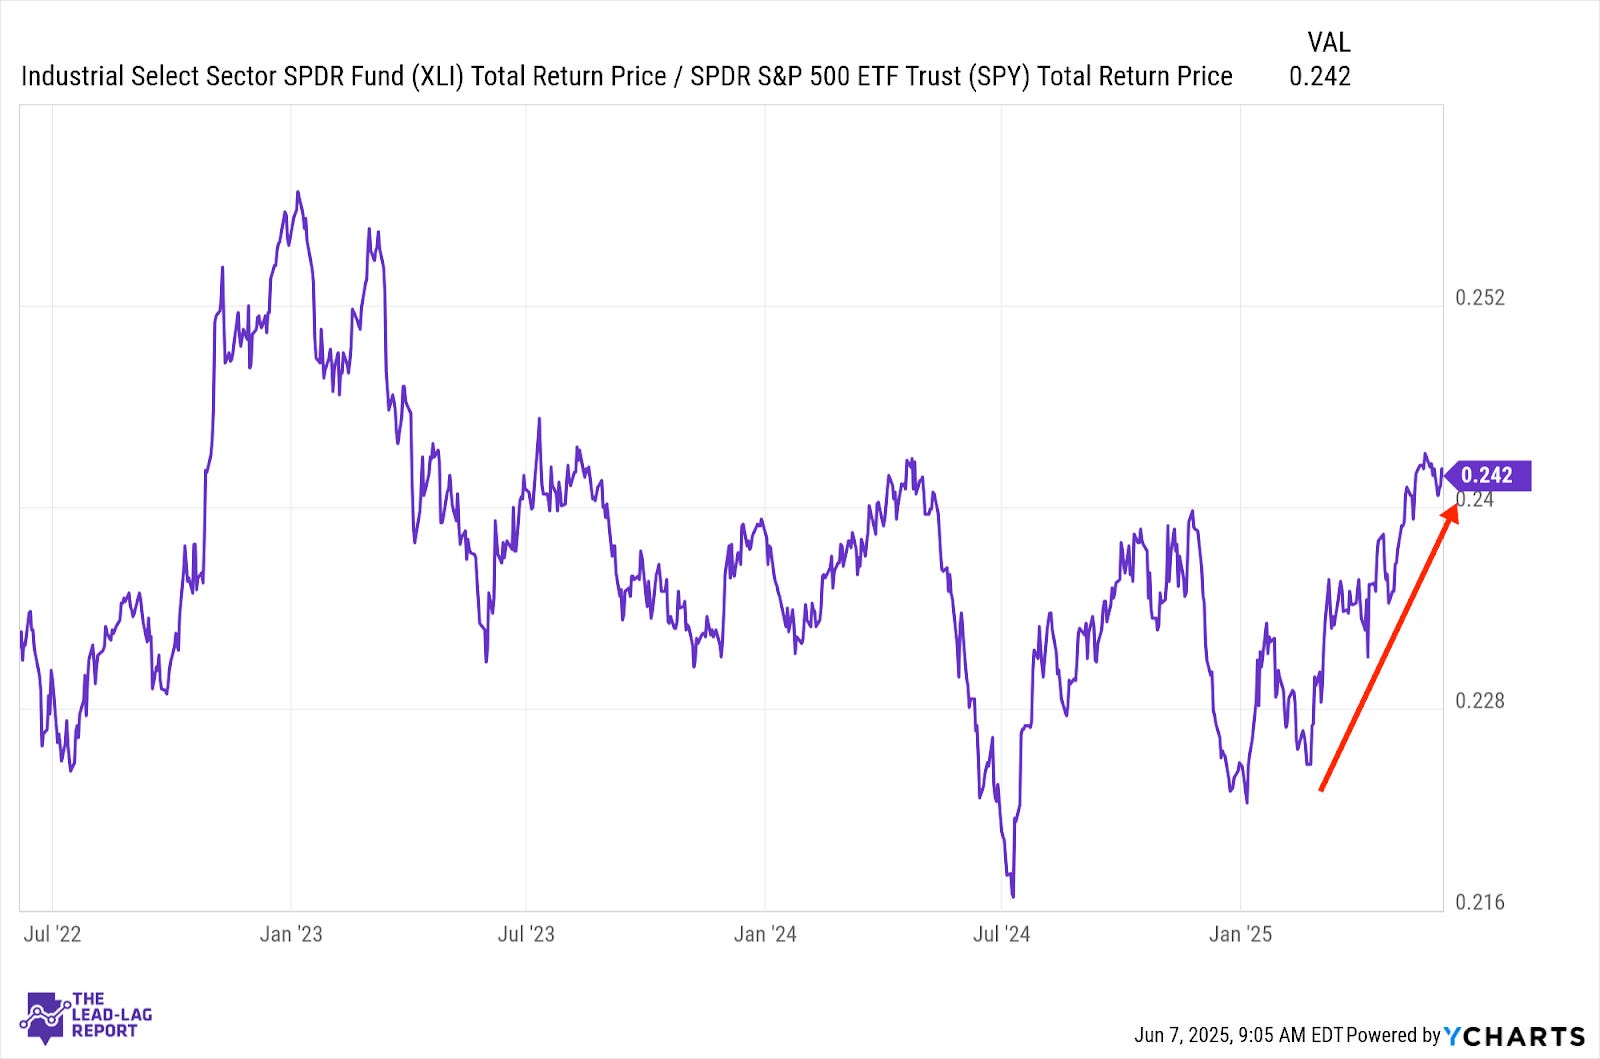
Industrials just keep plowing ahead to lead this market higher and now stand as the only sector sitting on a double-digit year-to-date gain. The shift towards factory reshoring, while choppy in its execution, has favored U.S. manufacturers and that’s helped deliver solid earnings growth this year and expected strength in both revenue and earnings growth in the next couple of years as well.
Treasury Inflation Protected Securities (SPIP) – A Cap On Risk
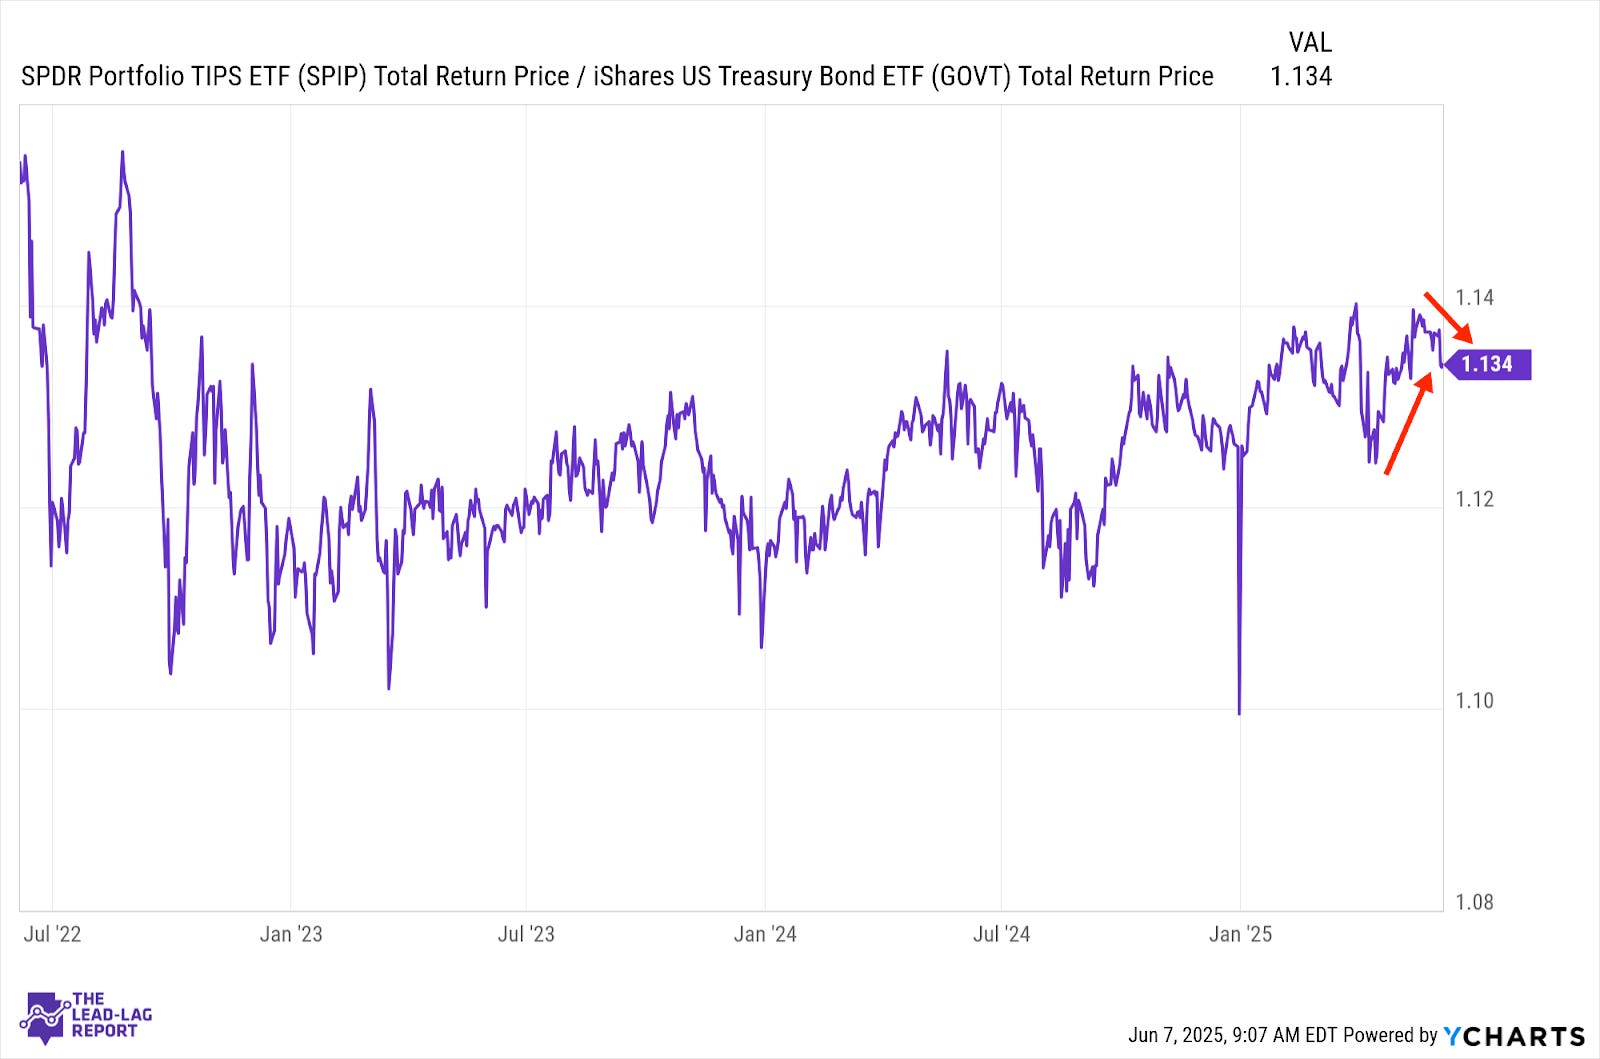
Last week’s jobs report may be considered slightly inflationary, but we still have yet to see any major pulse in inflation protection in either direction going back a while. While tariffs likely pose the biggest threat at the moment, the market seems content with the idea that neither side ultimately wants to see things get out of hand and that should put a cap on inflation risk.
Junk Debt (JNK) – A Pair Of Tailwinds
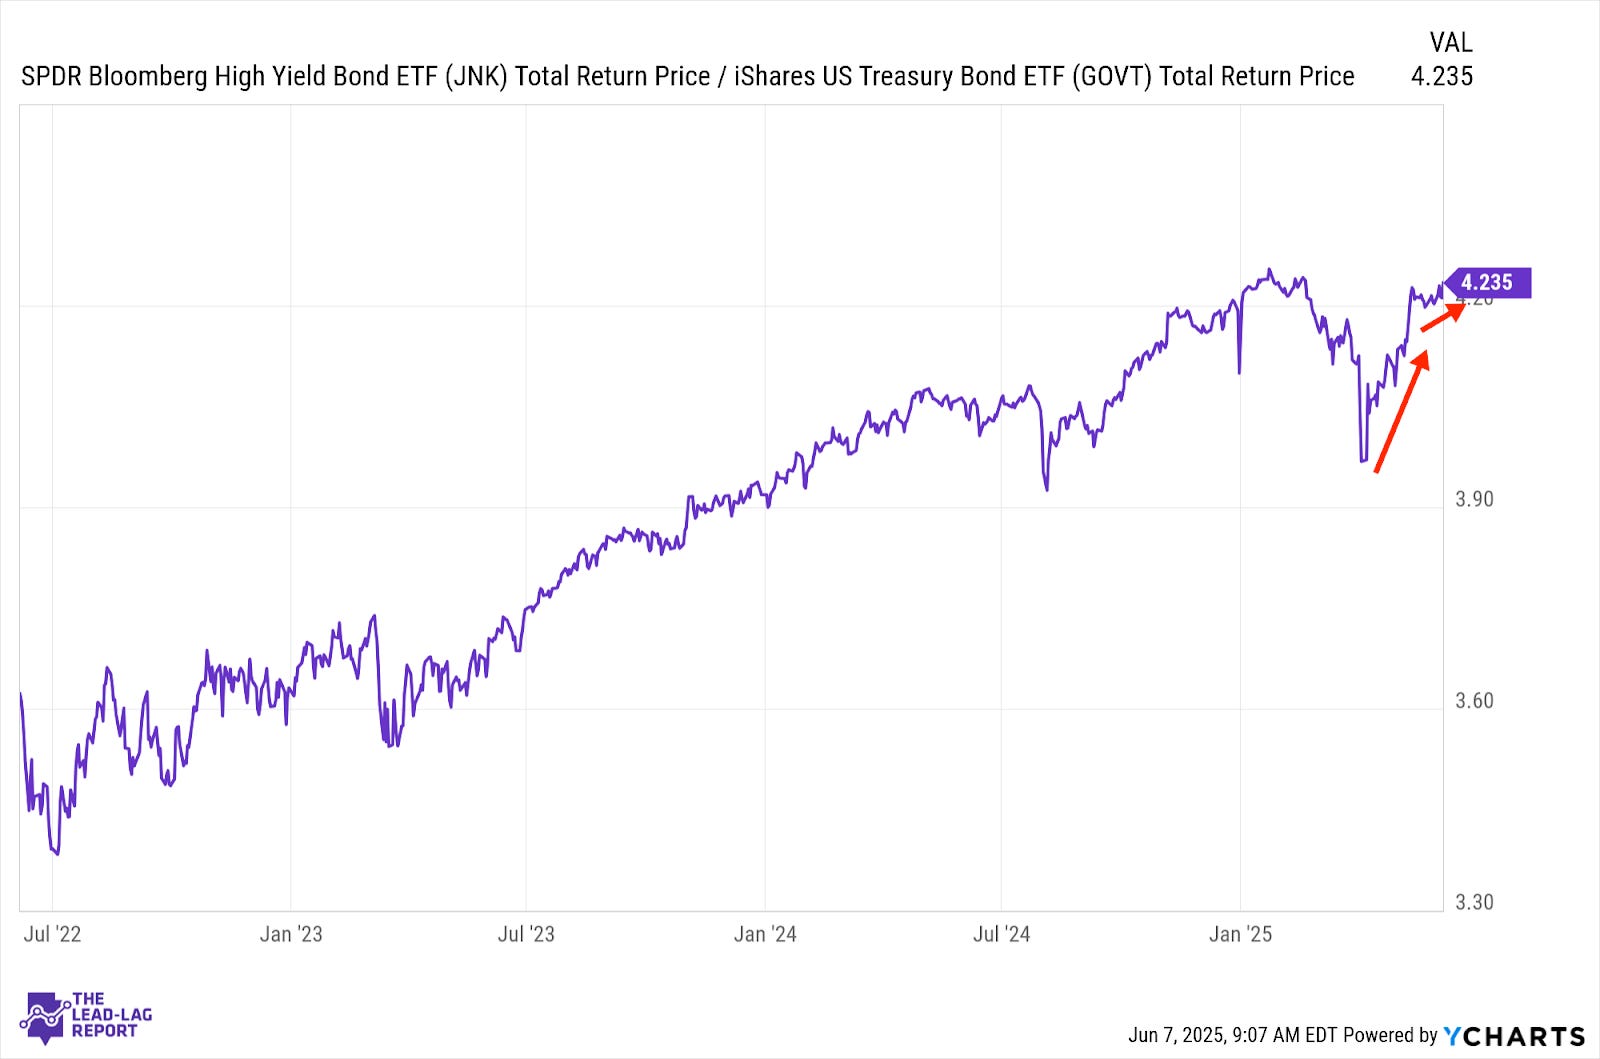
This ratio is nearly back to its highs, reflecting the risk-on momentum that’s been building for more than a month. Overall, there’s a durability with junk bonds that’s undeniable, even if I feel that credit risks aren’t being properly reflected. If growth rebounds in Q2, which seems likely, and tariffs generally remain stable, it creates a series of tailwinds that could really help high yielders, especially against Treasuries.
Special Announcement

Looking for a fresh take on value investing? ITAN helps investors modernize their U.S. value allocations, providing exposure to innovative, intangible-rich companies at attractive prices.
Learn more by visiting the ITAN Website or contacting the Sparkline Team.
DISCLAIMER – PLEASE READ: This is sponsored advertising content for which Lead-Lag Publishing, LLC has been paid a fee. The information provided in the link is solely the creation of Sparkline Capital. Lead-Lag Publishing, LLC does not guarantee the accuracy or completeness of the information provided in the link or make any representation as to its quality. All statements and expressions provided in the link are the sole opinion of Sparkline Capital and Lead-Lag Publishing, LLC expressly disclaims any responsibility for action taken in connection with the information provided in the link.
European Banks (EUFN) – The Investment Case Builds
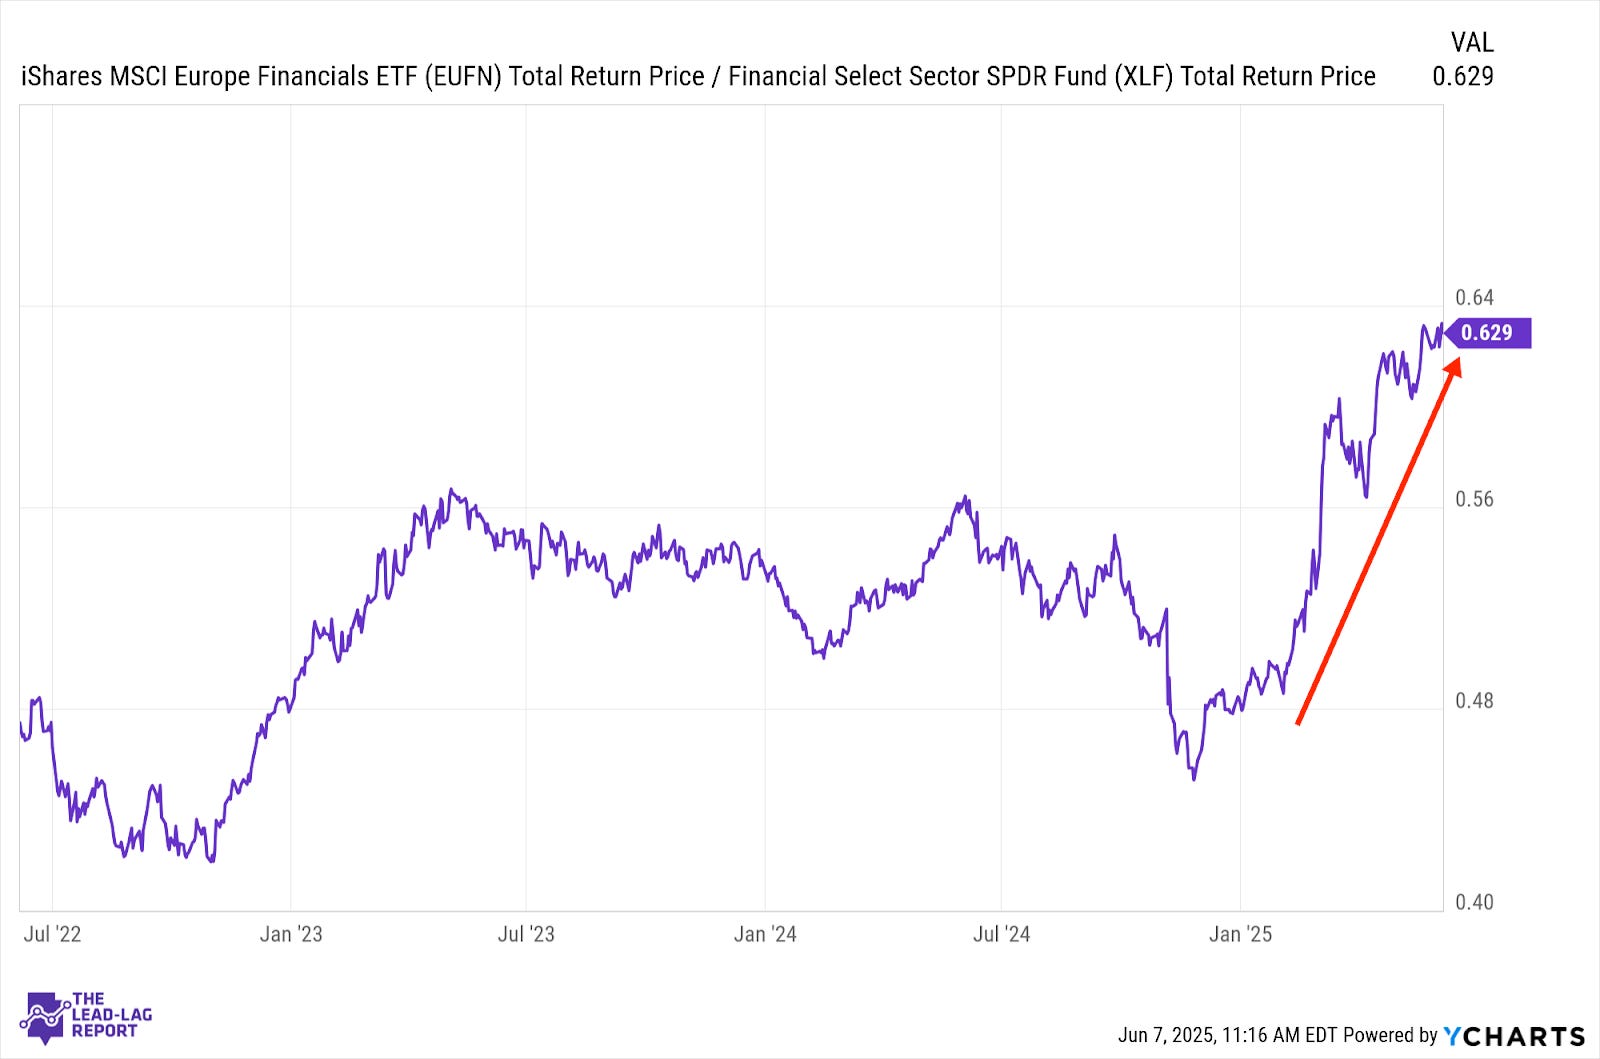
After a lengthy run, U.S. financials have begun underperforming as Treasury yields rise and confidence in the dollar diminishes. That has re-accelerated the uptrend for Euro financials, although there’s a fairly good investment case independent of what U.S. banks do. The ECB has been able to step in with monetary support, the nascent expansion has thus far been holding up and the value is certainly better.
Emerging Markets Debt (EMB) – Firmly Back In Favor
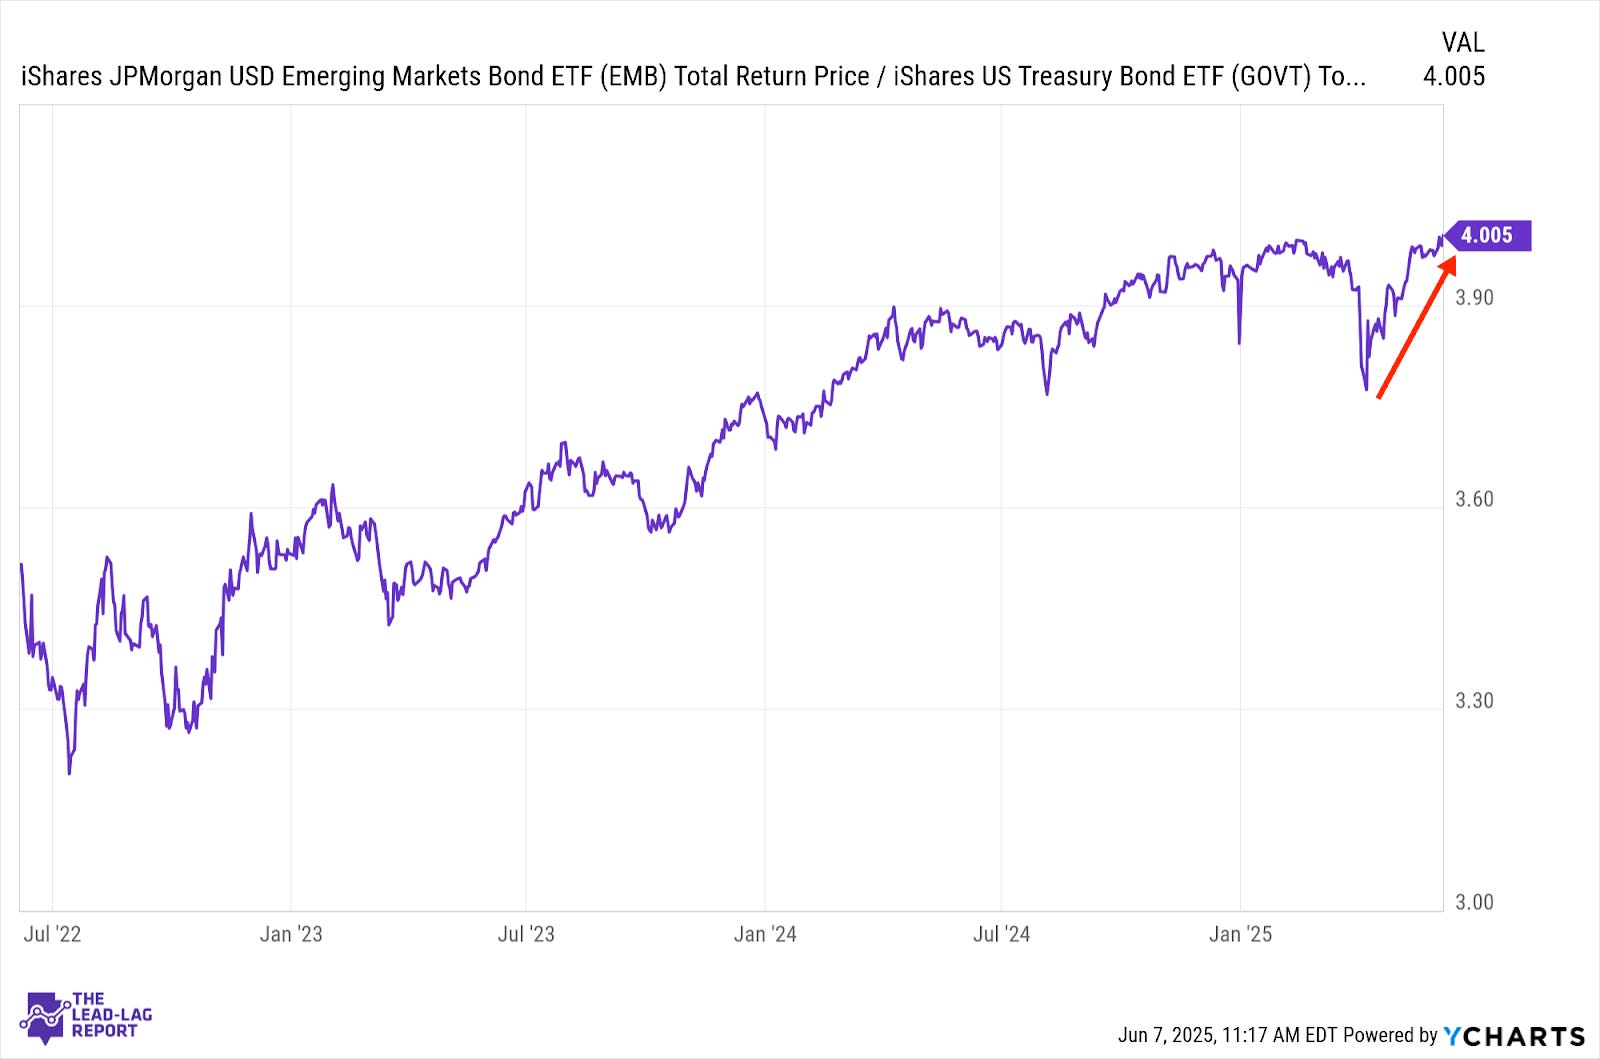
Lower-rated debt is certainly back in favor again. The global pulse is towards additional monetary support and the case for emerging markets may be improving. The Latin American markets have been doing especially well and several of these economies have been fairly insulated from the Trump trade war. Yields of around 7% also look comparatively attractive.
LAGGARDS: HOW DANGEROUS IS THE DOLLAR-TREASURY DISCONNECT?
Communication Services (XLC) – Stuck In A Holding Pattern
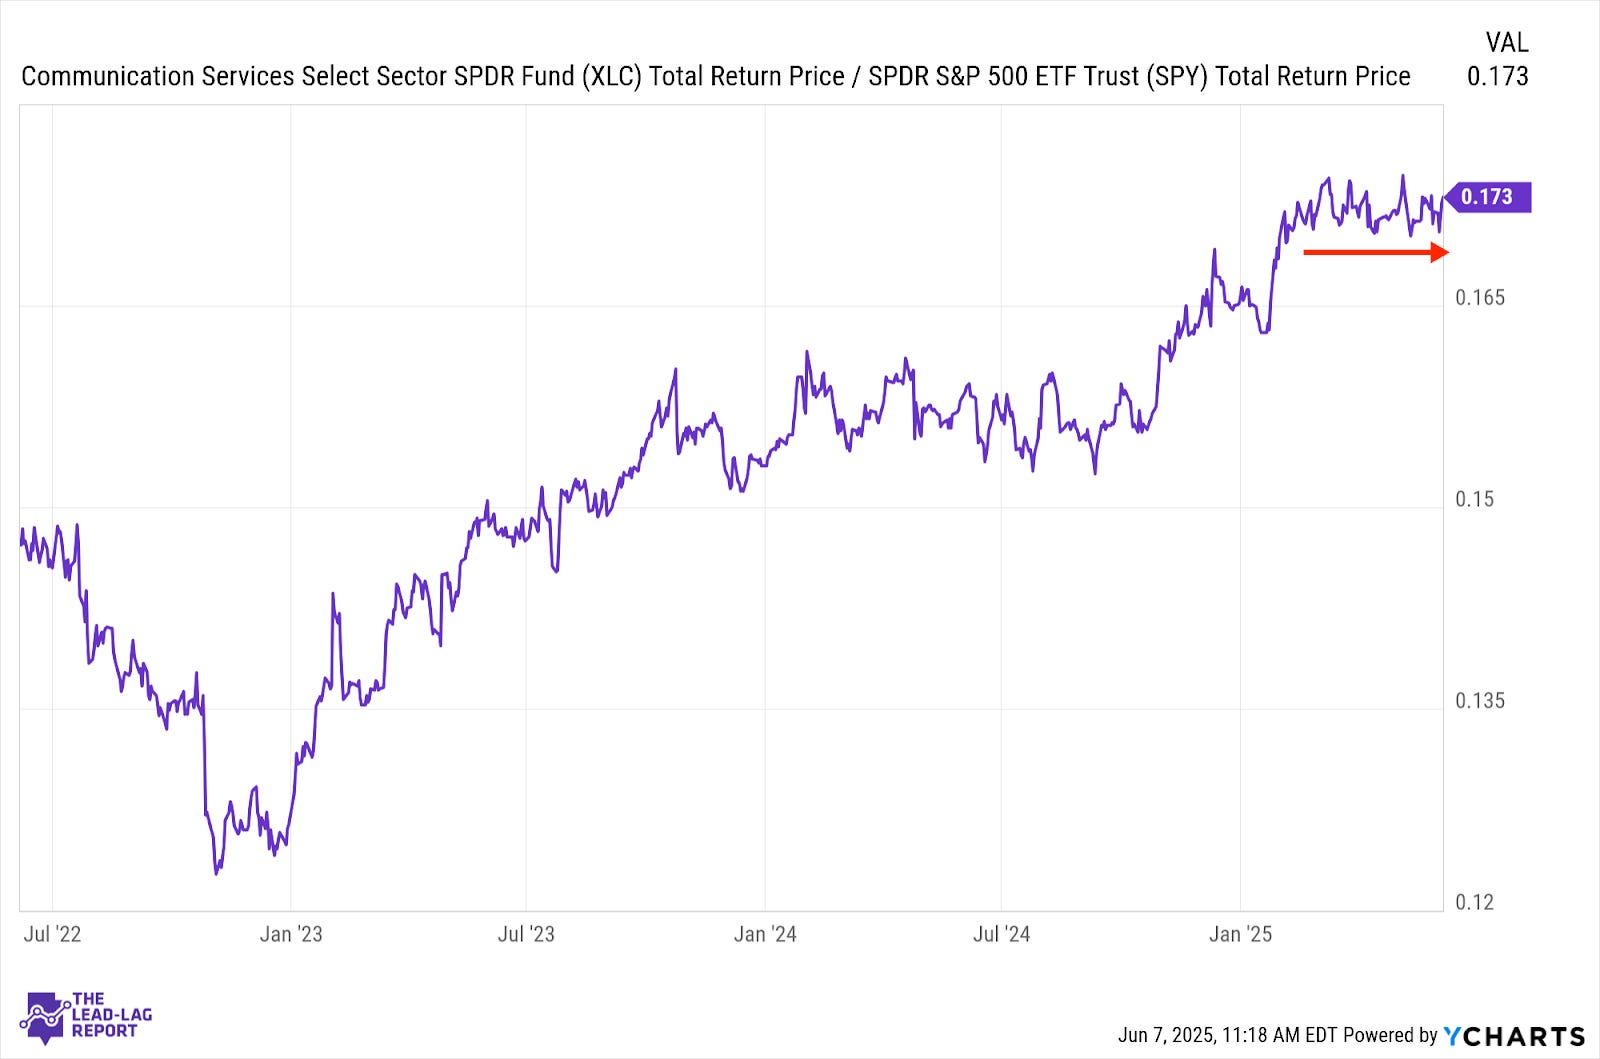
While growth stocks have reaffirmed their market leadership, the composition of that outperformance has been bifurcated. Most of the gains have come from tech, while this sector has remained in a holding pattern. When this sector’s two mag 7 components aren’t driving the market’s gains like they were two years ago, this appears to be a very balanced group.
Consumer Discretionary (XLY) – The Tesla Effect
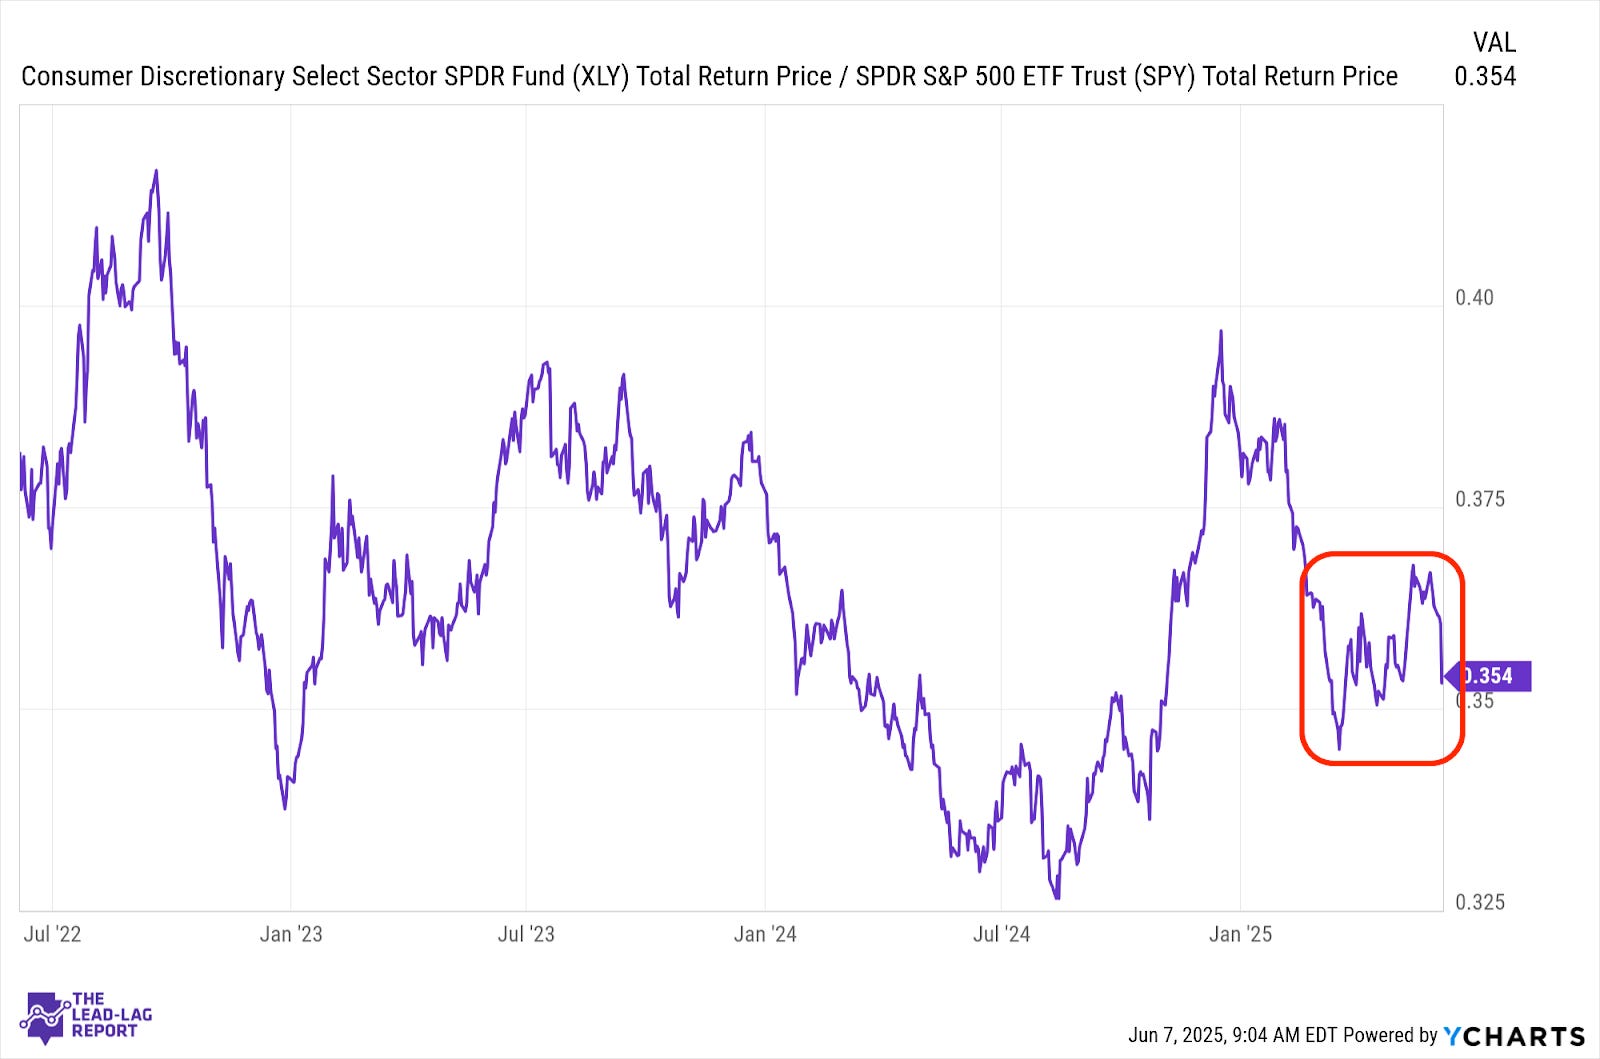
Investors have favored growth over value for roughly two months, but not all sectors are being treated equally. Retail stocks have struggled to gain any consistent momentum as the generally healthy high level economic data is being countered by evidence that the consumer still has its challenges. Last week’s plunge in this ratio was heavily influenced by Tesla’s drop. Even without it, there’s still a lot of choppy sideways action.
Utilities (XLU) – Several Factors Working Against It
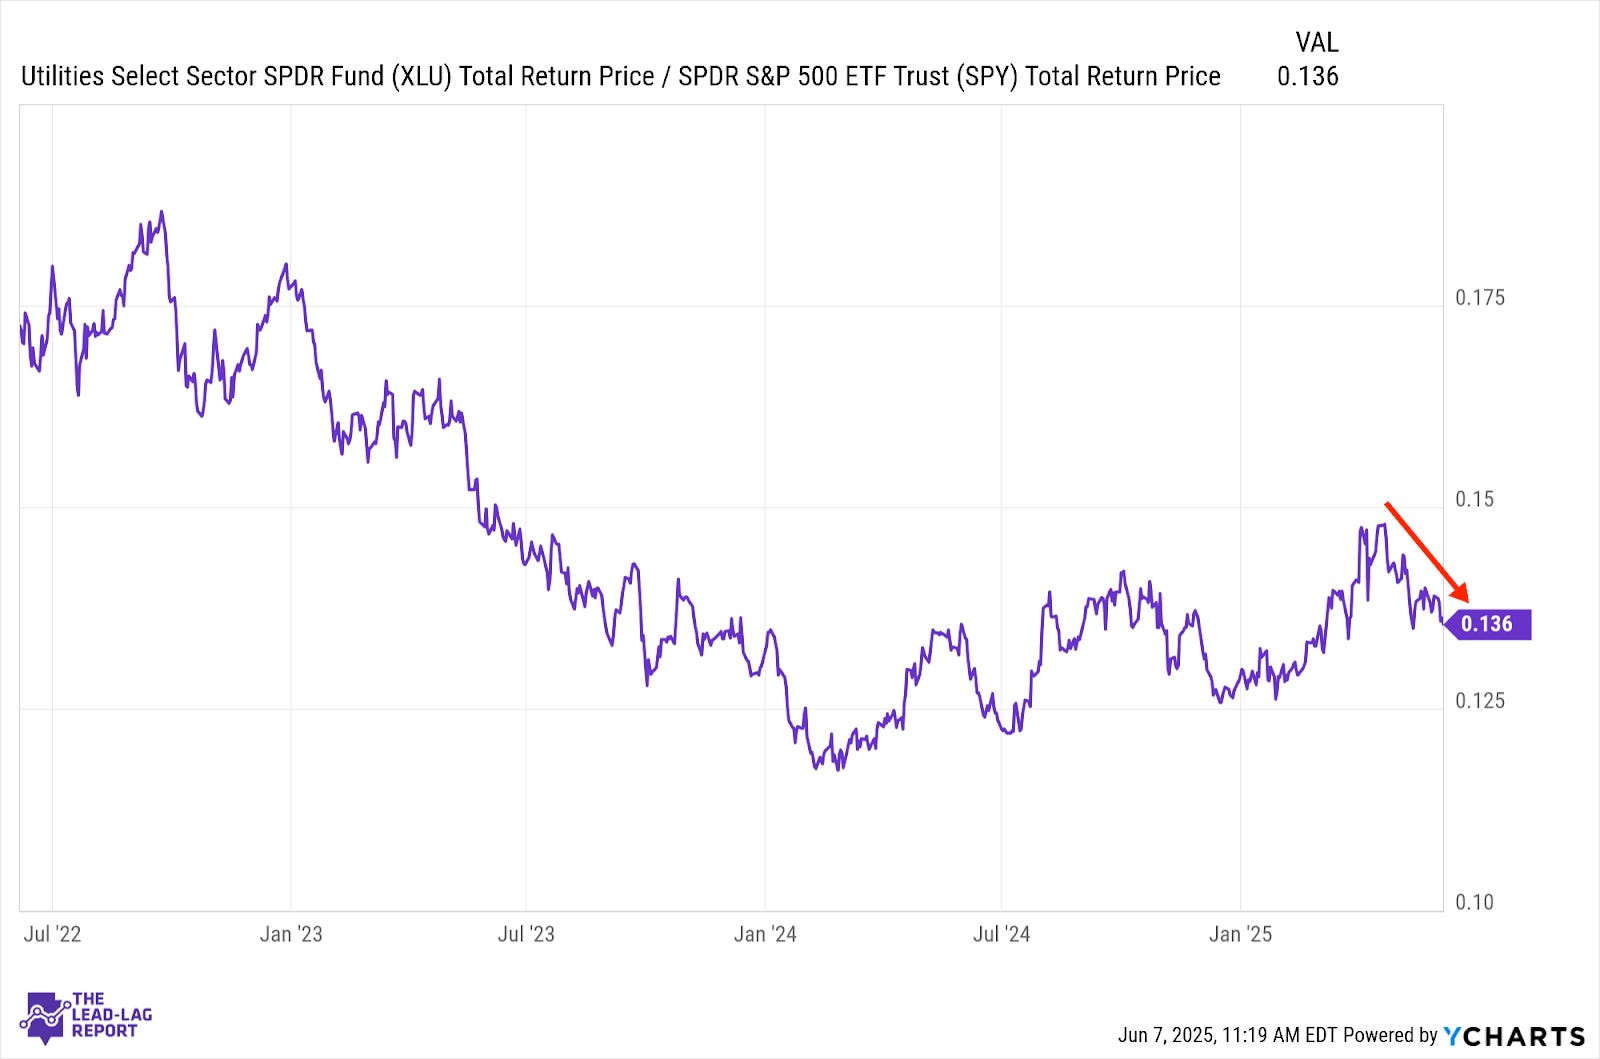
Utilities have correctly signalled that the market has shifted back to risk-on in recent weeks. The cooling of trade tensions and the delays in the more punitive tariffs have brought a sense of relative calm back to the markets. With the labor market still looking steady for the time being, growth poised for a rebound and rates remaining elevated, this sector has a number of factors working against it at the moment.
Real Estate (XLRE) – Yields Creating Pressure
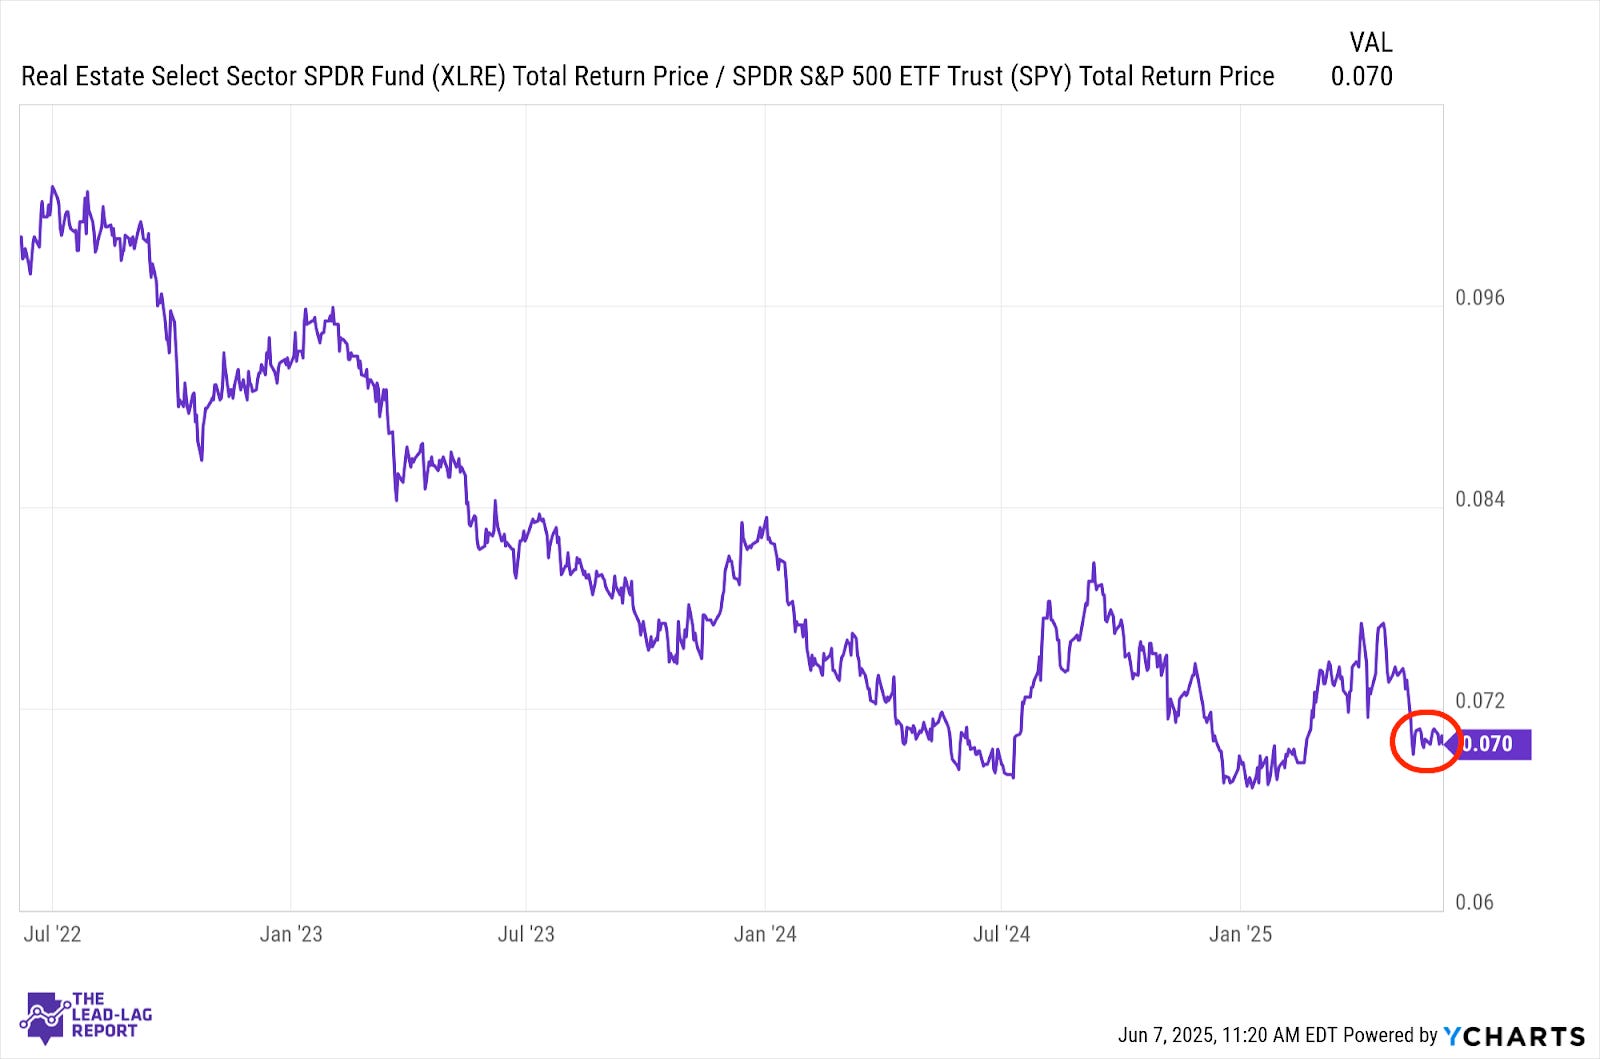
Despite volatility in yields, real estate is finding a little stability here. REITs haven’t really gotten a lot of attention here due to everything going on in geopolitics, but conditions haven’t been favorable. The housing market has been resilient, but supply & demand are beginning to balance out and yields remaining stuck around 4.5% are going to create further pressure.
Consumer Staples (XLP) – No Longer Taking Advantage Of Volatility
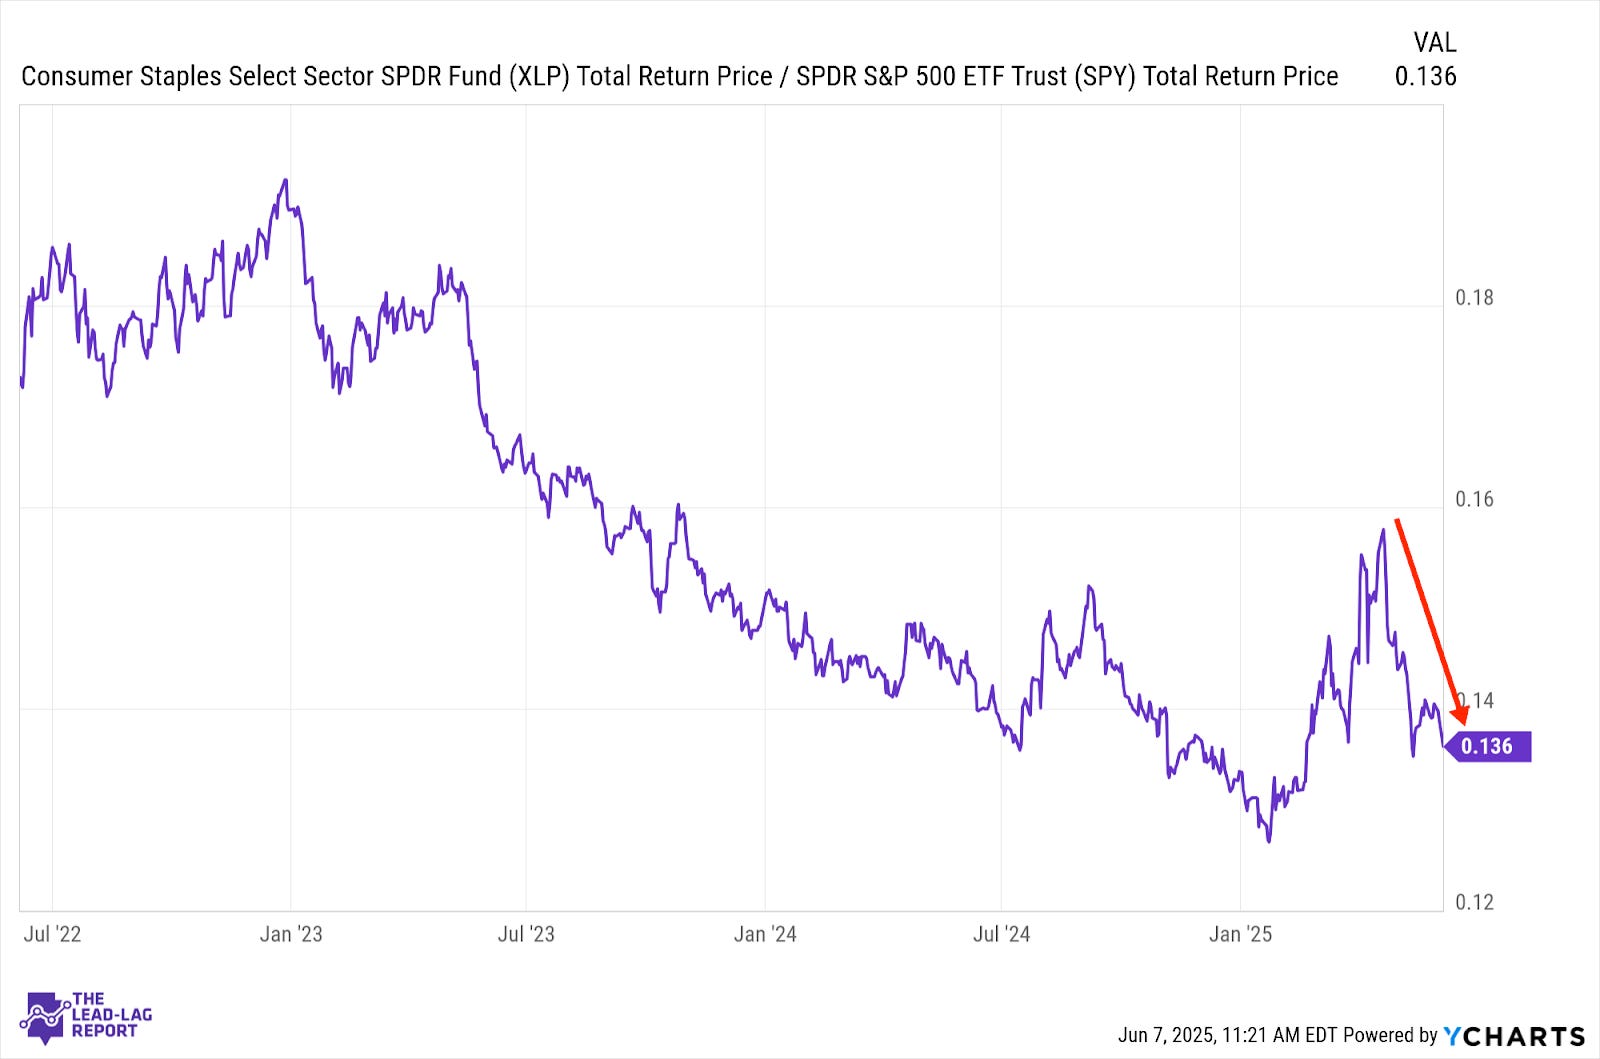
Staples have given back most of their pre-Liberation Day outperformance and have gotten left behind by the tech/growth rebound. With traders generally turning a blind eye to the most recent trade war developments, this sector may no longer be able to bank on the elevated volatility that created their rally in the 1st quarter of the year. That means it may be stuck in the mud for a little while.
Health Care (XLV) – Changing The Pattern
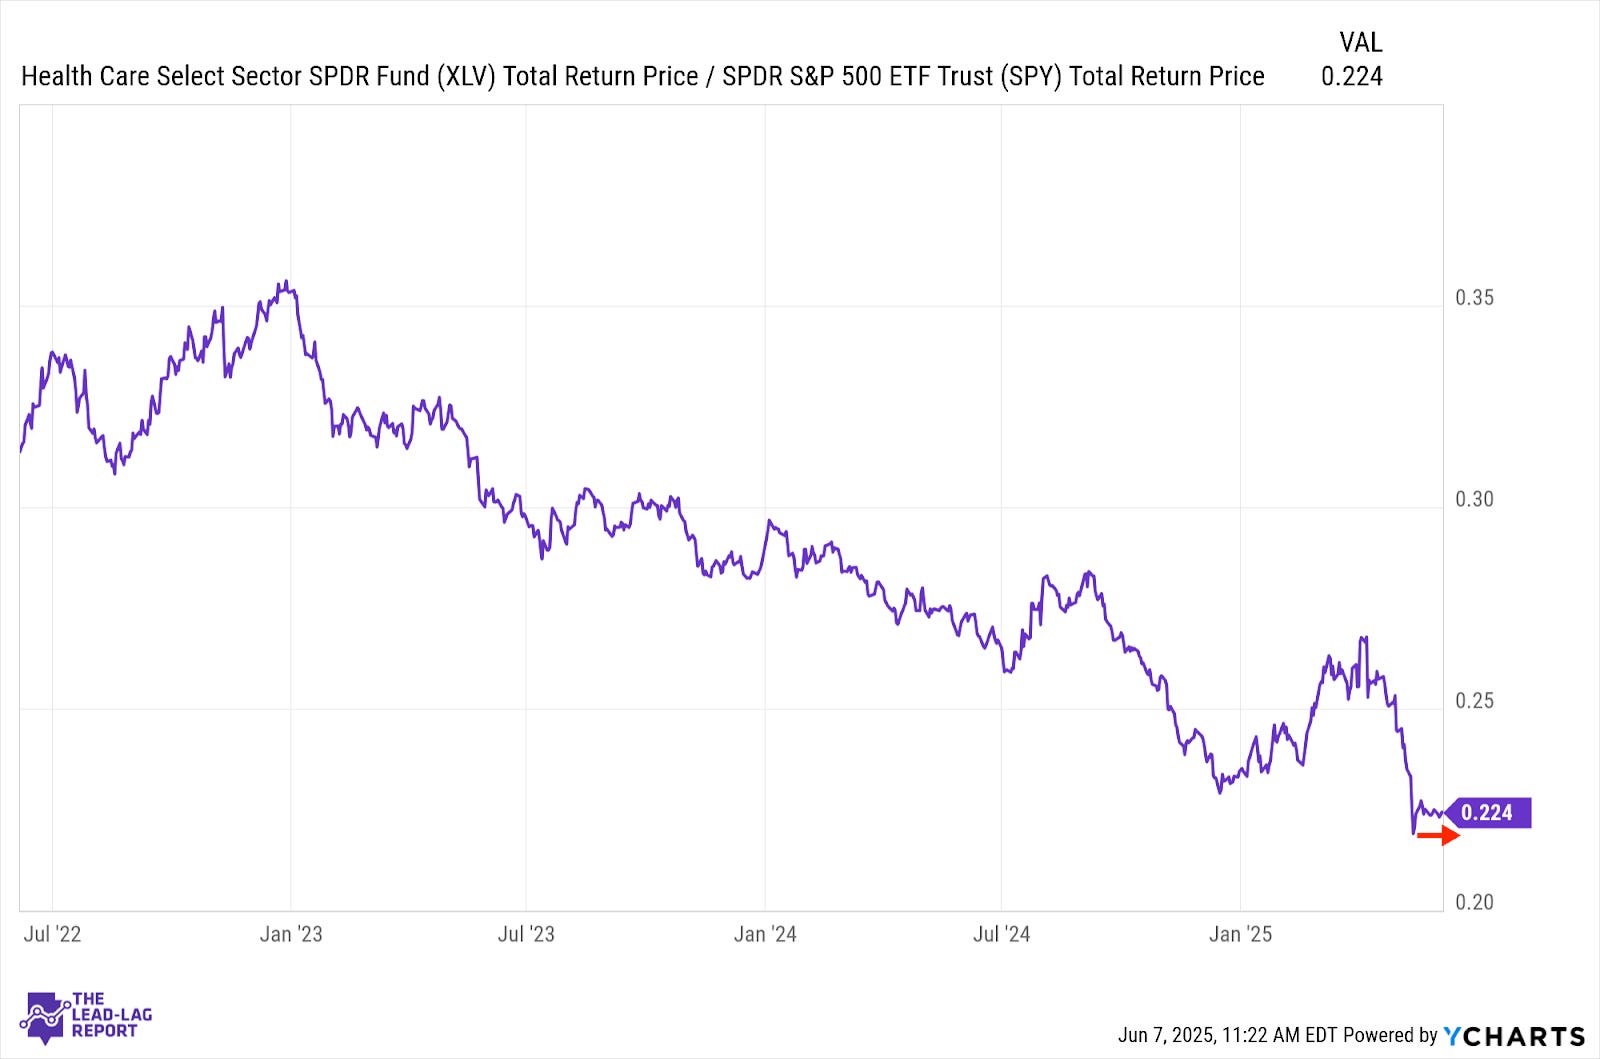
As other defensive sectors are losing traction here, healthcare has actually been holding up. This is somewhat of a change from previous months where this sector had been lagging some of its risk-off peers. Outside of the issue of whether Medicaid will get cut in the Trump tax cut bill, there hasn’t been a lot of headline risk coming out of this sector and that’s usually a driver of outperformance.
Energy (XLE) – OPEC Imbalances The Supply/Demand Curve
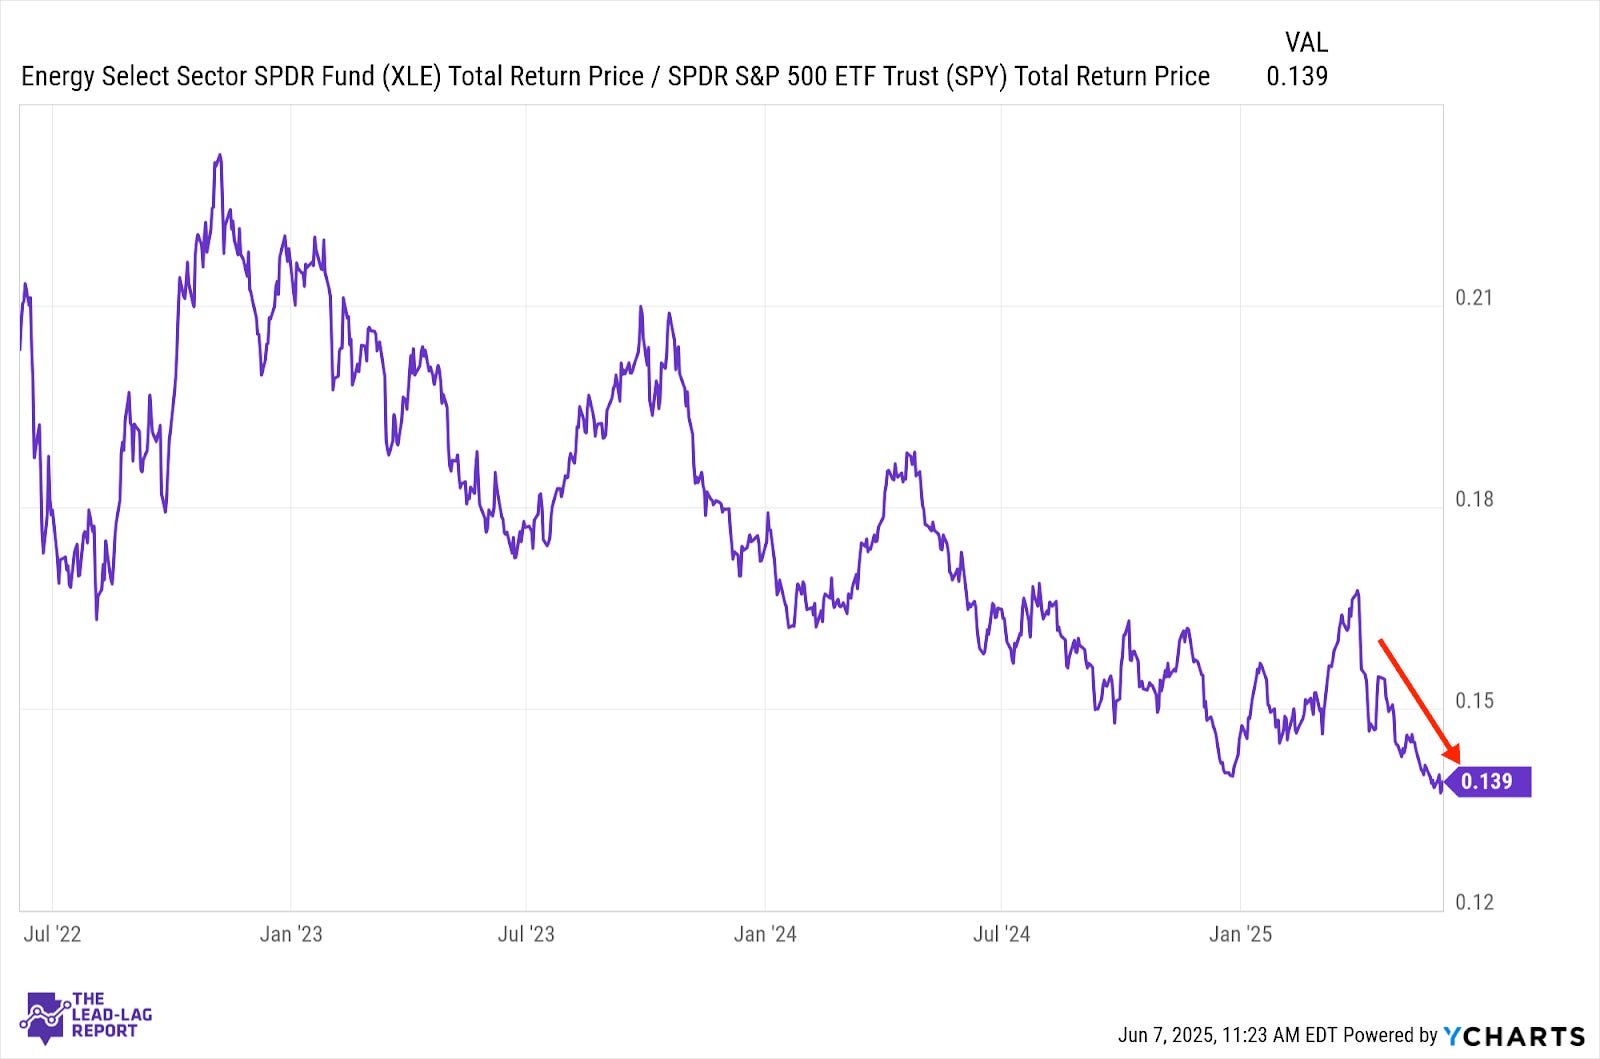
The outlook for global energy demand has been pretty tepid on its own. The persistence of tariffs and their effect on global manufacturing have been pretty clear on energy sector stocks as much as anything lately. OPEC’s decision to ramp up production at a time when demand is already struggling puts more pressure on margins and balance sheets.
Financials (XLF) – Anti-American Sentiment Beginning To Take A Toll
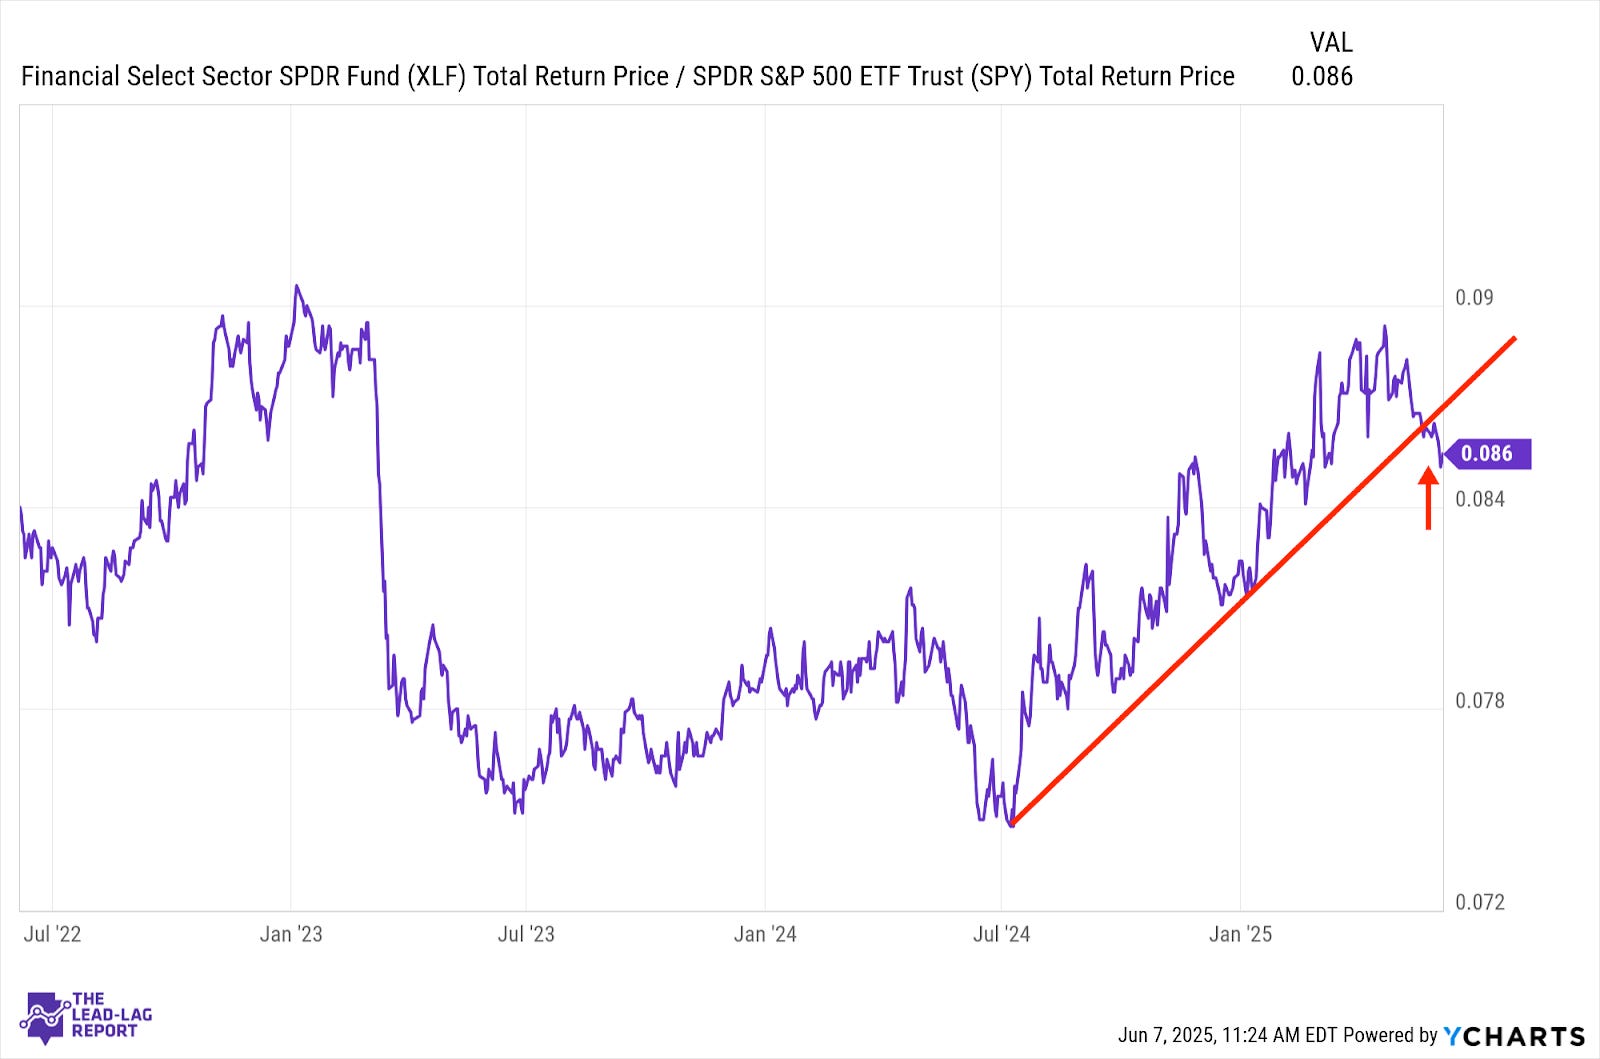
It appears we're finally seeing a breakdown in financial sector leadership in the markets. This could largely be a function of geopolitical and global sentiment that has seen a large swath of the market shift away from U.S. dollar-denominated assets. Not only has the market seemed less confident in the dollar and U.S. Treasuries than they have in some time, that could be spilling over into banks and the demand for loans and credit.
Materials (XLB) – Looking For The Market To Open Up
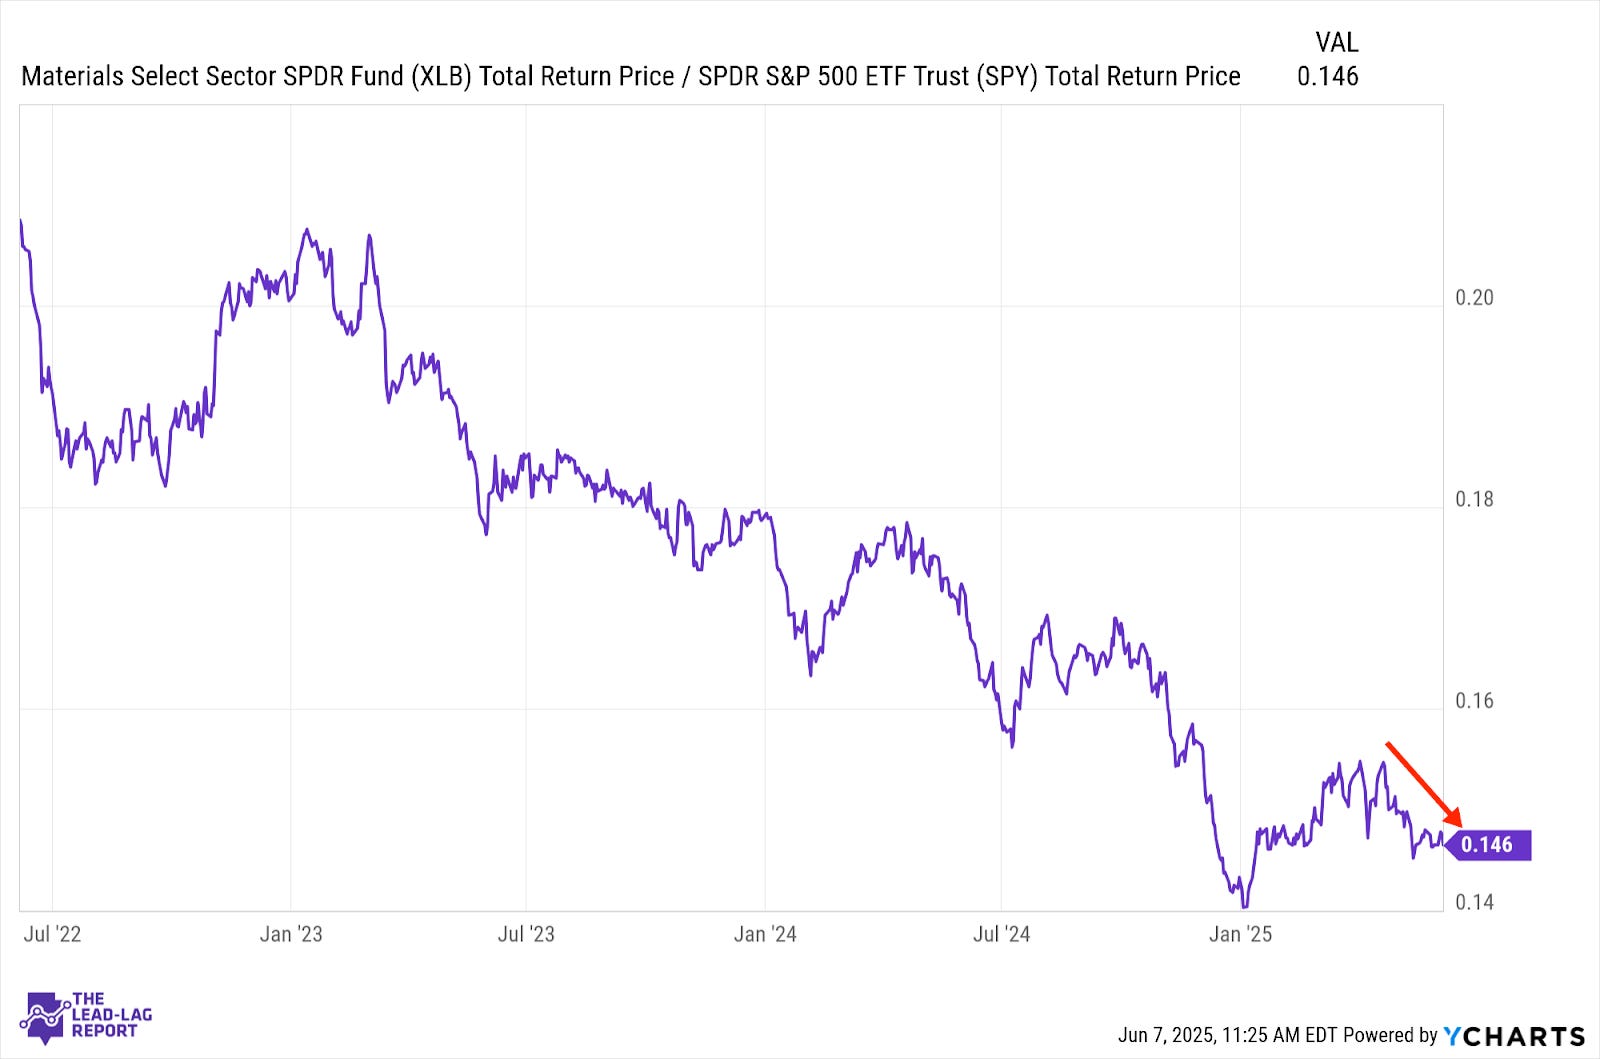
The story in this sector is much the same as it has been for a while. The core demand for industrial metals and materials has been waning in an environment where global manufacturing remains unsteady. Factory activity is still holding up in some areas of the world, but there probably won’t be enough consensus strength or optimism here to really rebound until the global trade market opens up a bit more.
Small-Caps (VSMAX) – Showing Some Life
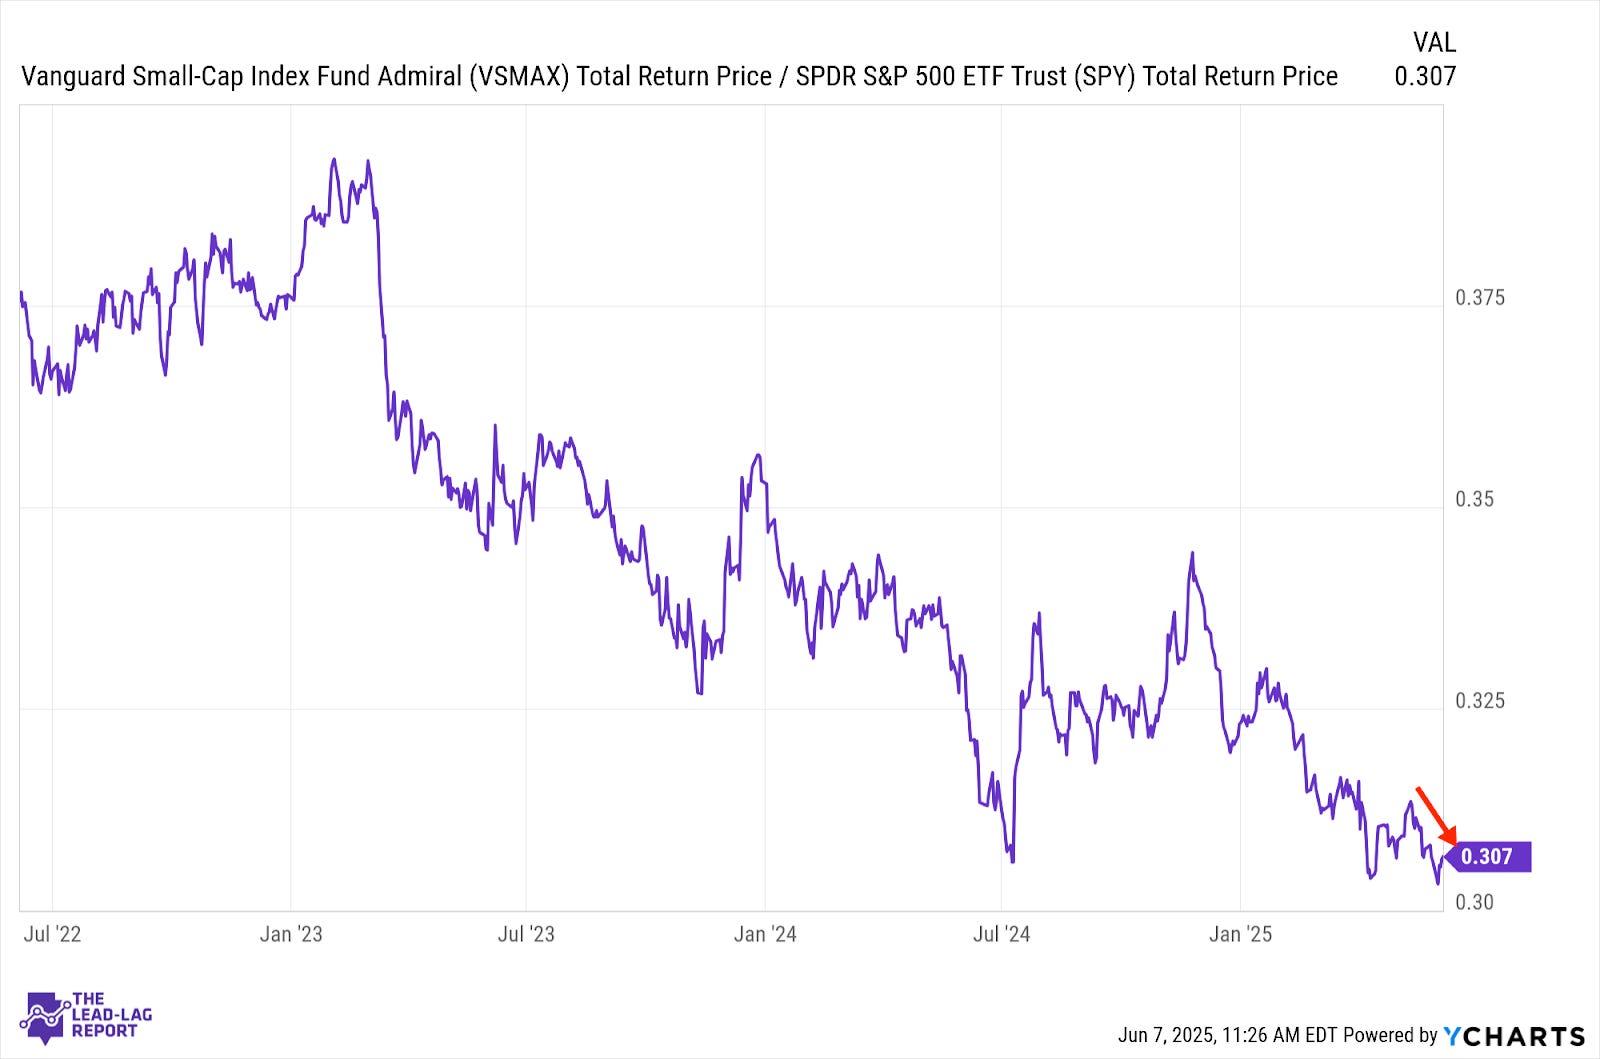
While you can’t really notice it in this chart, I’ve been intrigued by small-cap outperformance over the past few days. This has coincided with some better-than-expected macro data and small-cap outperformance is the response we might expect to see in an expansionary scenario. We’ve been faked out by small-caps too many times over the past few years to feel good about this yet, but it’s nice to see that we’re getting an expected reaction.
Dividend Stocks (SDY) – Where’s The Help Going To Come From?
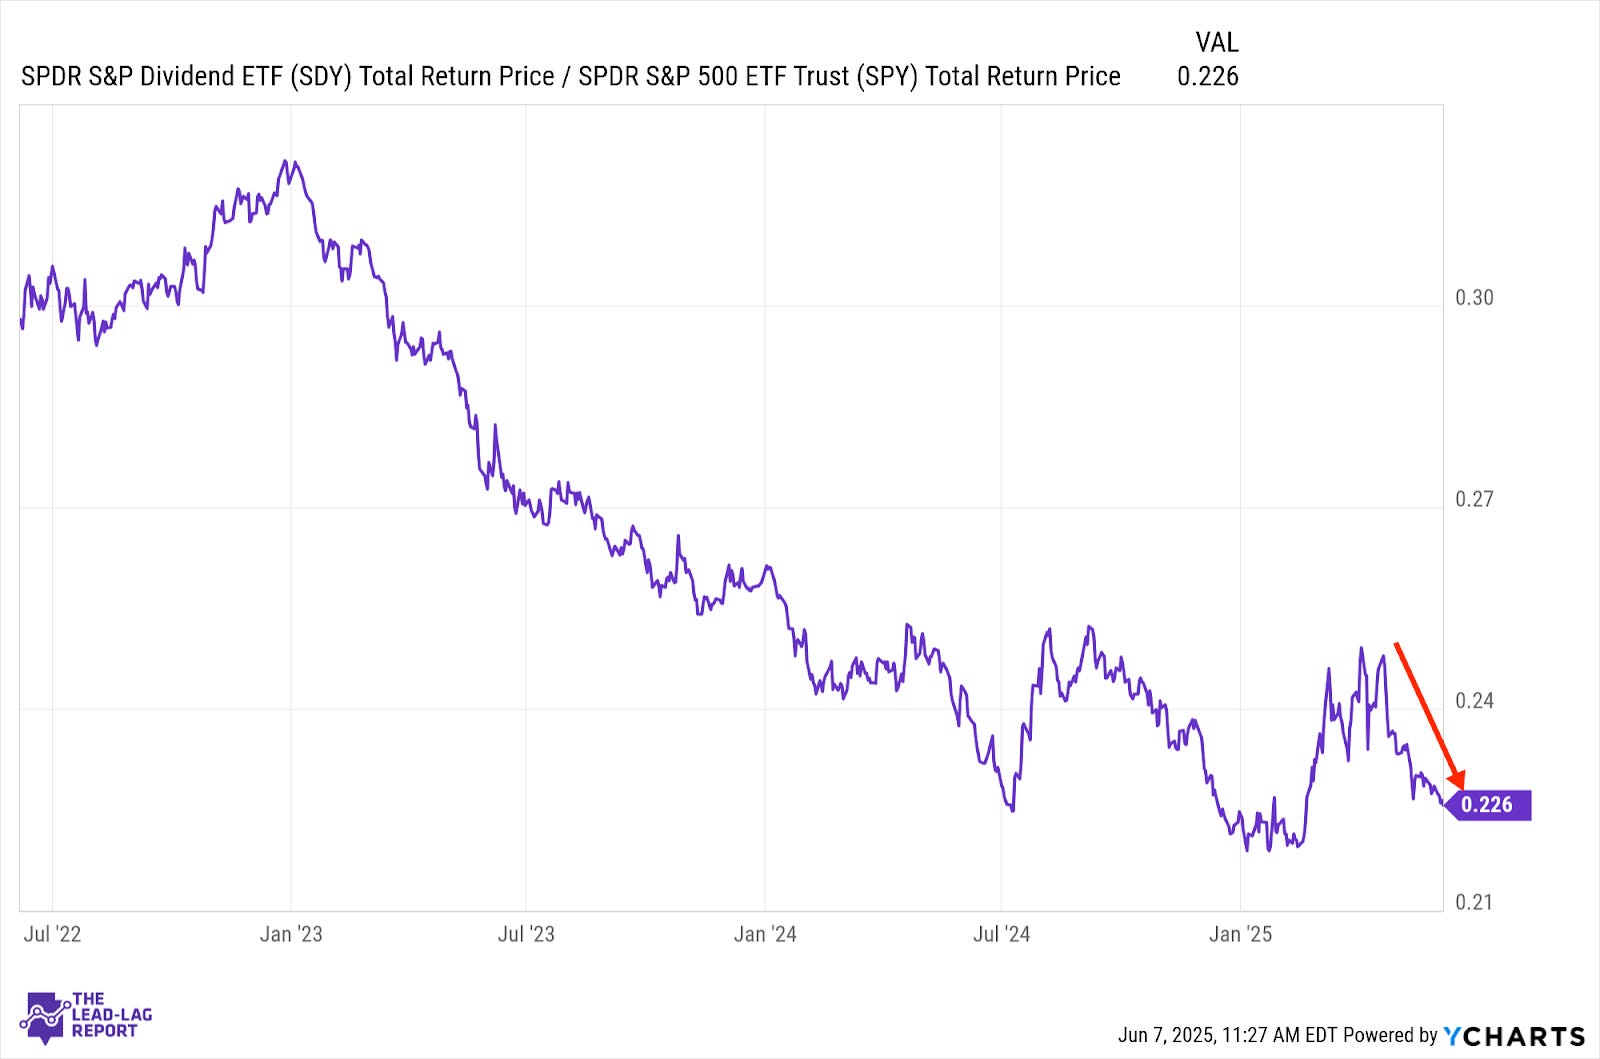
It’s the same story whenever tech & growth stocks lead the way. Dividend stocks underperform and pretty consistently so. In the near-term, the signals are pretty uniformly pointing to risk-on conditions, so there may not be a great deal of potential in dividend payers for the time being. Cyclicals are often a place that can generate a little support, but with financials breaking down recently there’s not much help coming from there either.
Bonds (GOVT) – Disconnect In Fixed Income Market
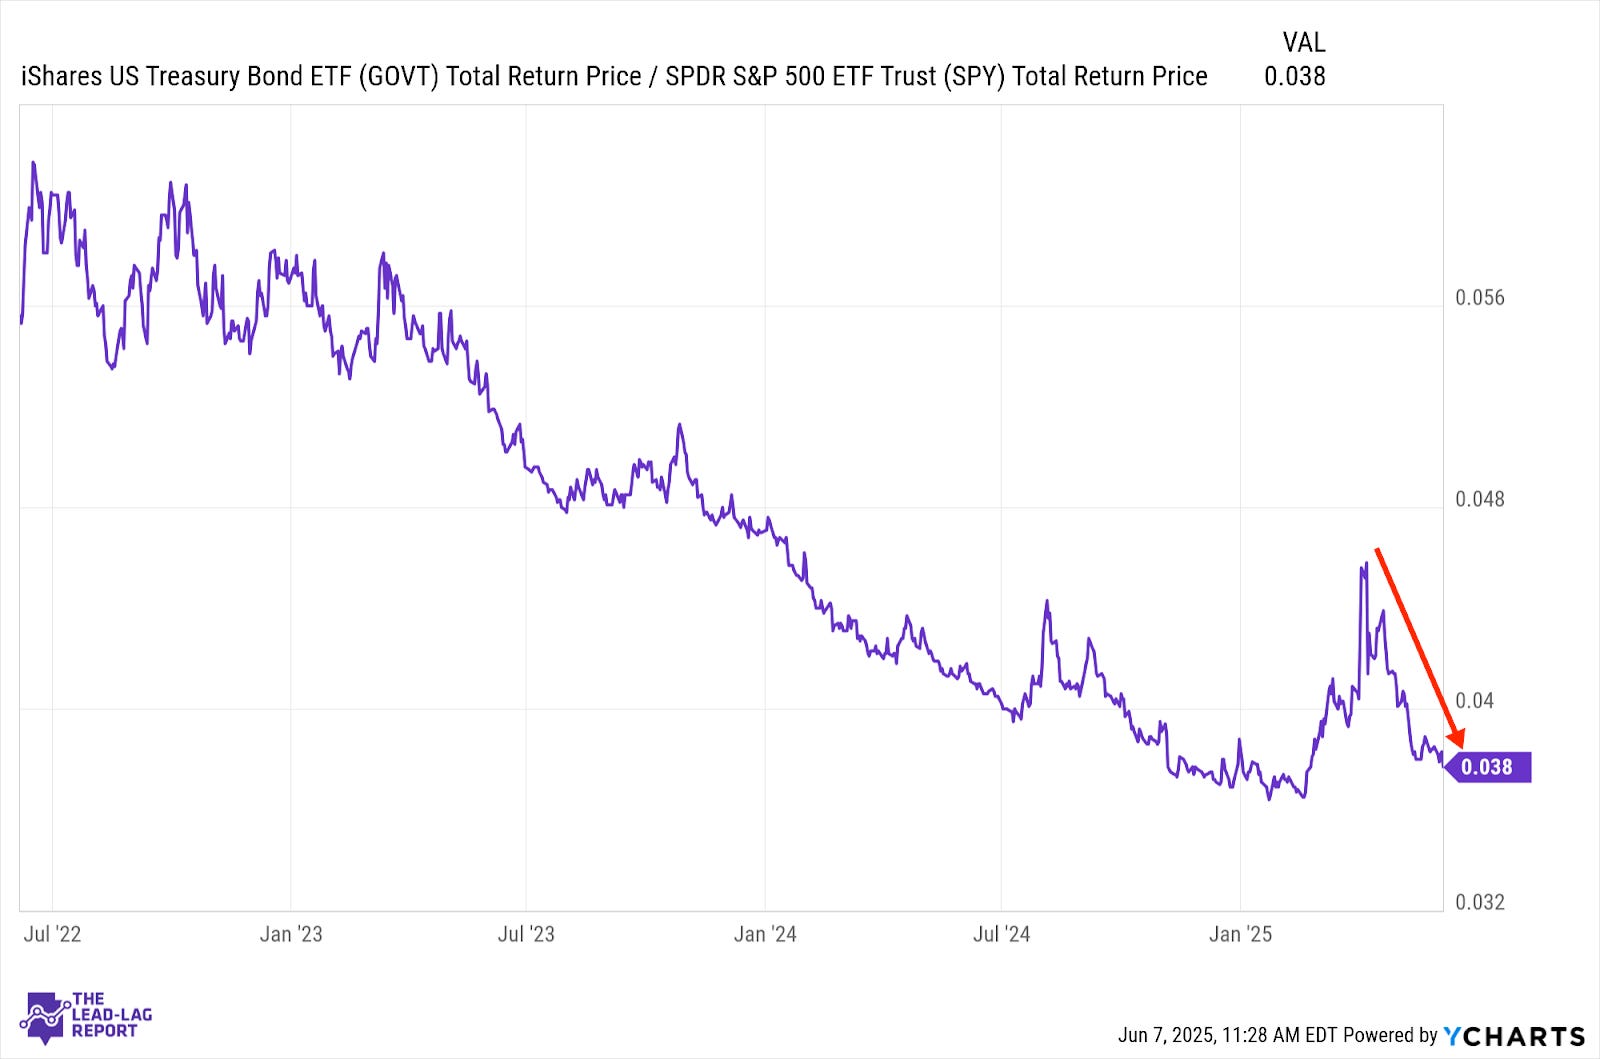
Part of this ratio, obviously, is a function of the U.S. stock rally following Liberation Day, but Treasuries have done nothing to help their own cause. Even in a de-escalation of tariff risks, which should lower both inflation risk and rates, Treasury yields have continued to move higher. Why yields haven’t moved lower in recent weeks even as sentiment has improved suggests a real disconnect in the fixed income market.
Long Bonds (VLGSX) – After The Un-Inversion
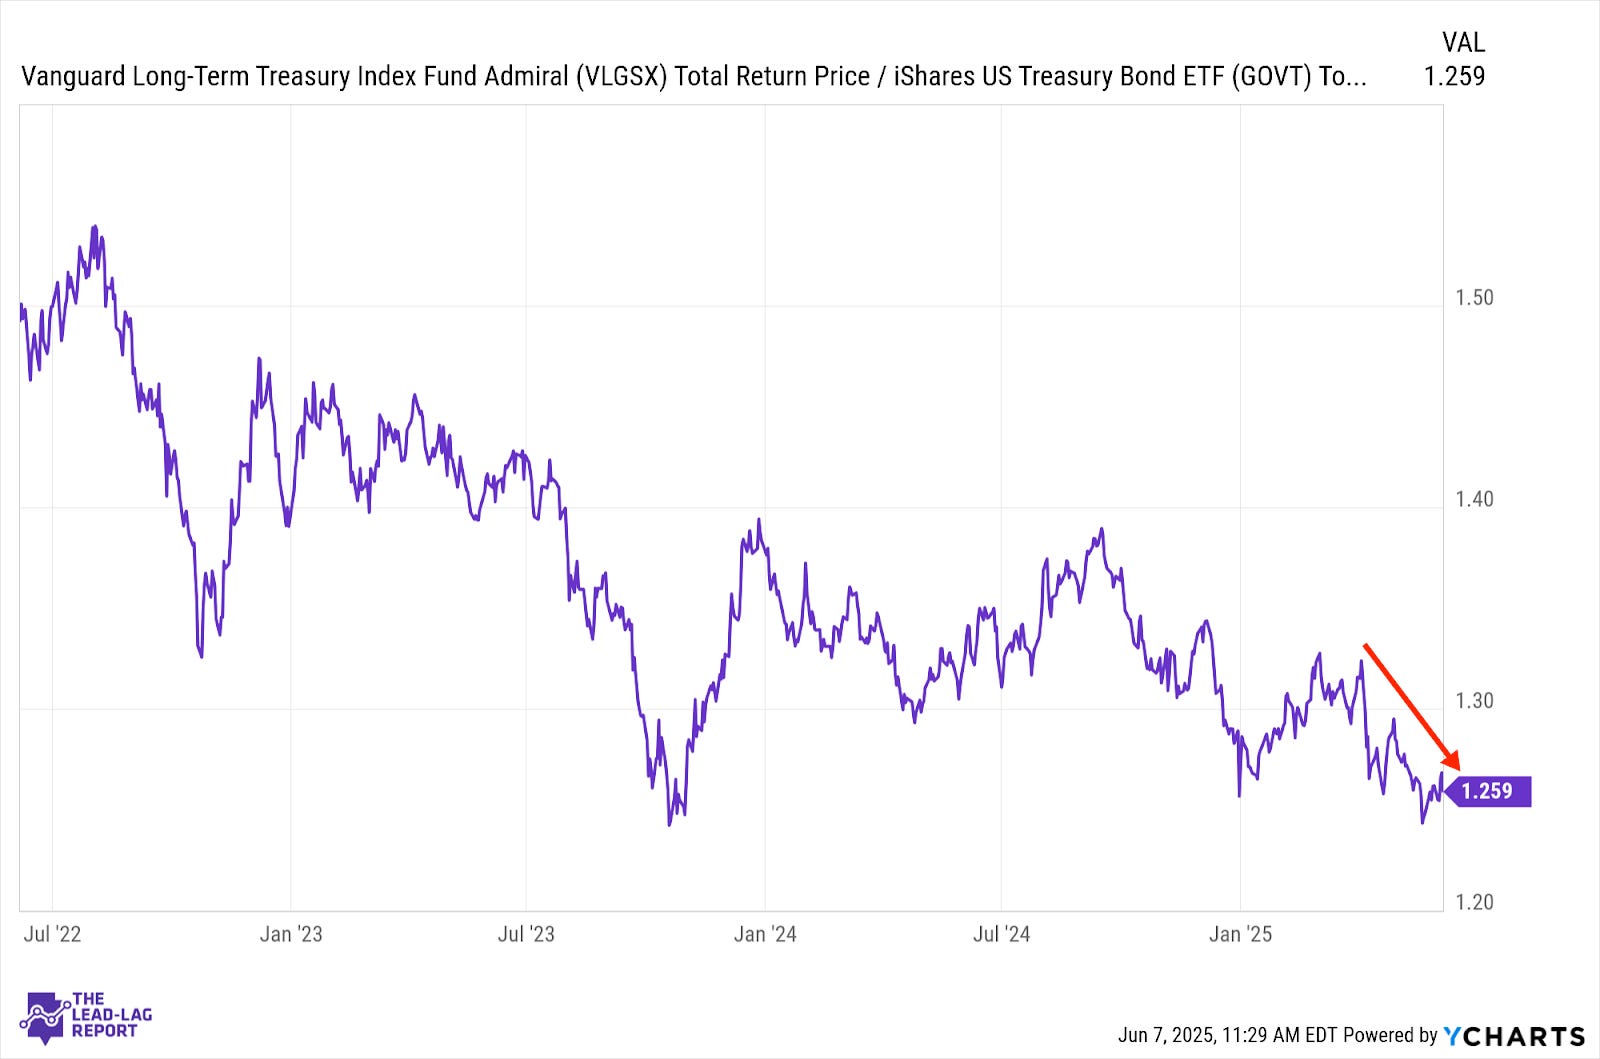
The yield curve continues to steepen, which could actually be a warning sign. Historically, a recession typically follows an un-inversion by about 12 months. The 10Y/2Y spread turned positive in September of last year, which means a recession would only be a quarter or two away if this pattern repeated here. Inflation is still a risk and skepticism over its directional path could be contributing.
Europe, Australasia, and the Far East (EFA) – Returning To The U.S.
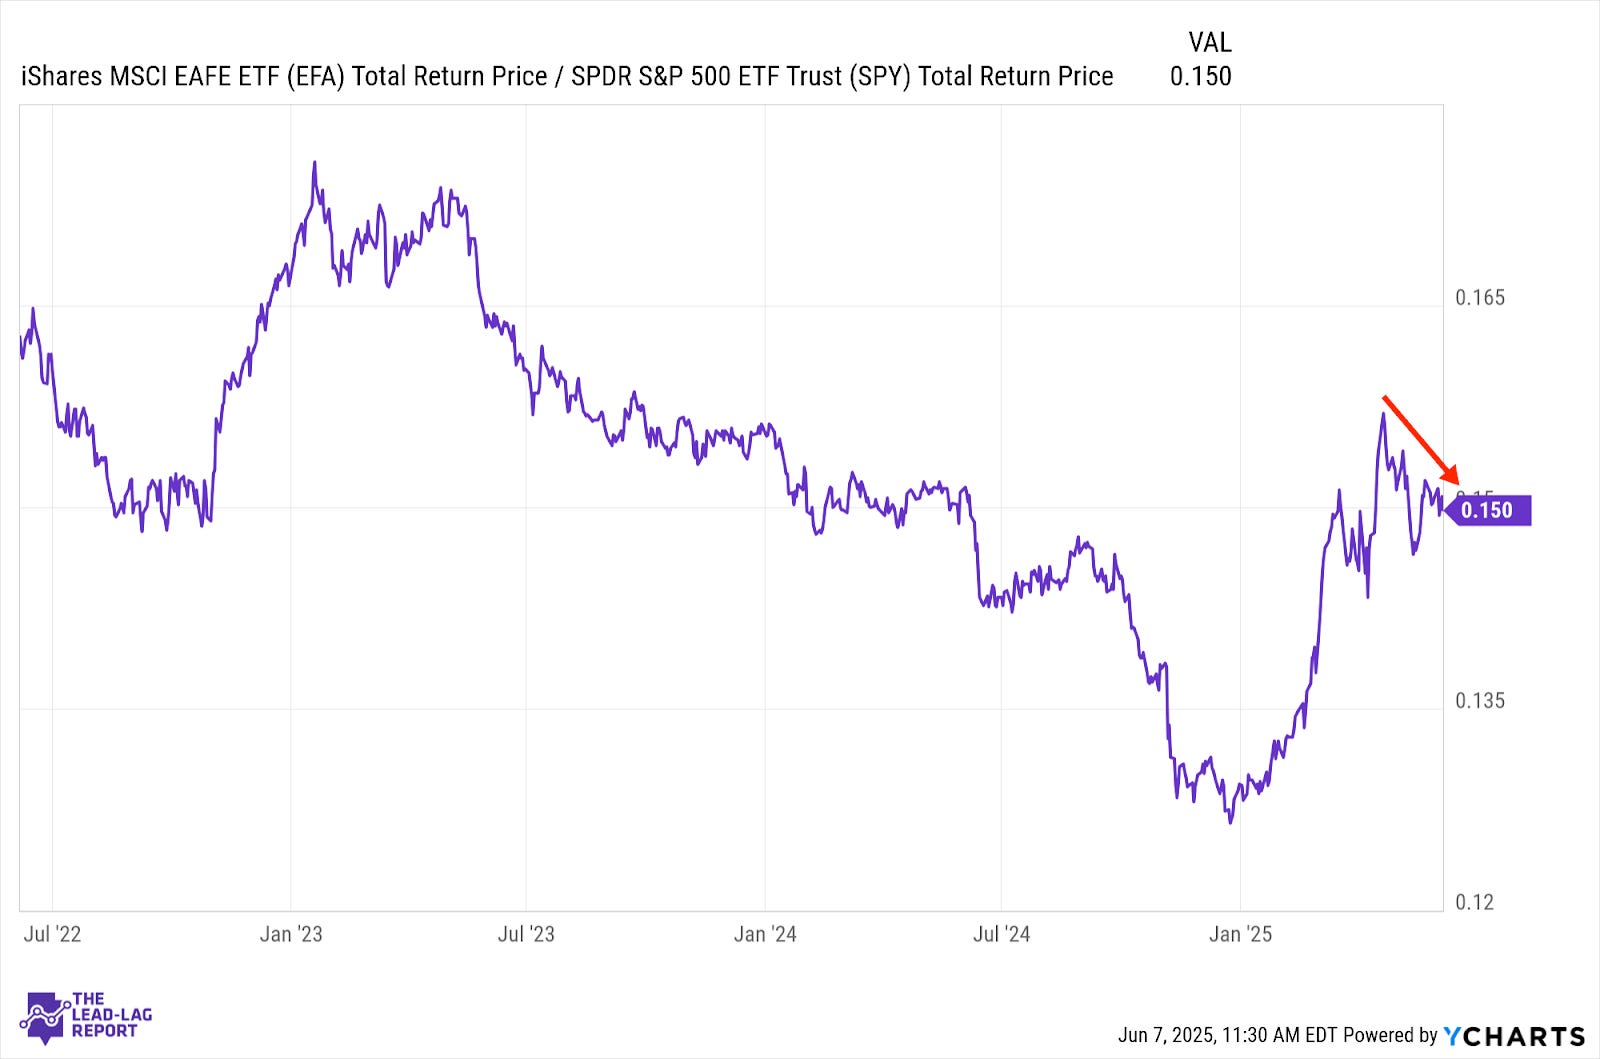
International stocks were the darlings of the global equity markets earlier this year, but investors seem inclined to return to the U.S. after the trade de-escalation. When smoothed out to account for the abnormal import/export activity around tariffs, GDP in the first half of this year looks like it will still be solid. As long as that’s the picture from a macro perspective, the preference for U.S. stocks over international stocks appears to be pretty durable.
Emerging Markets (EEM) – Surviving & Rising
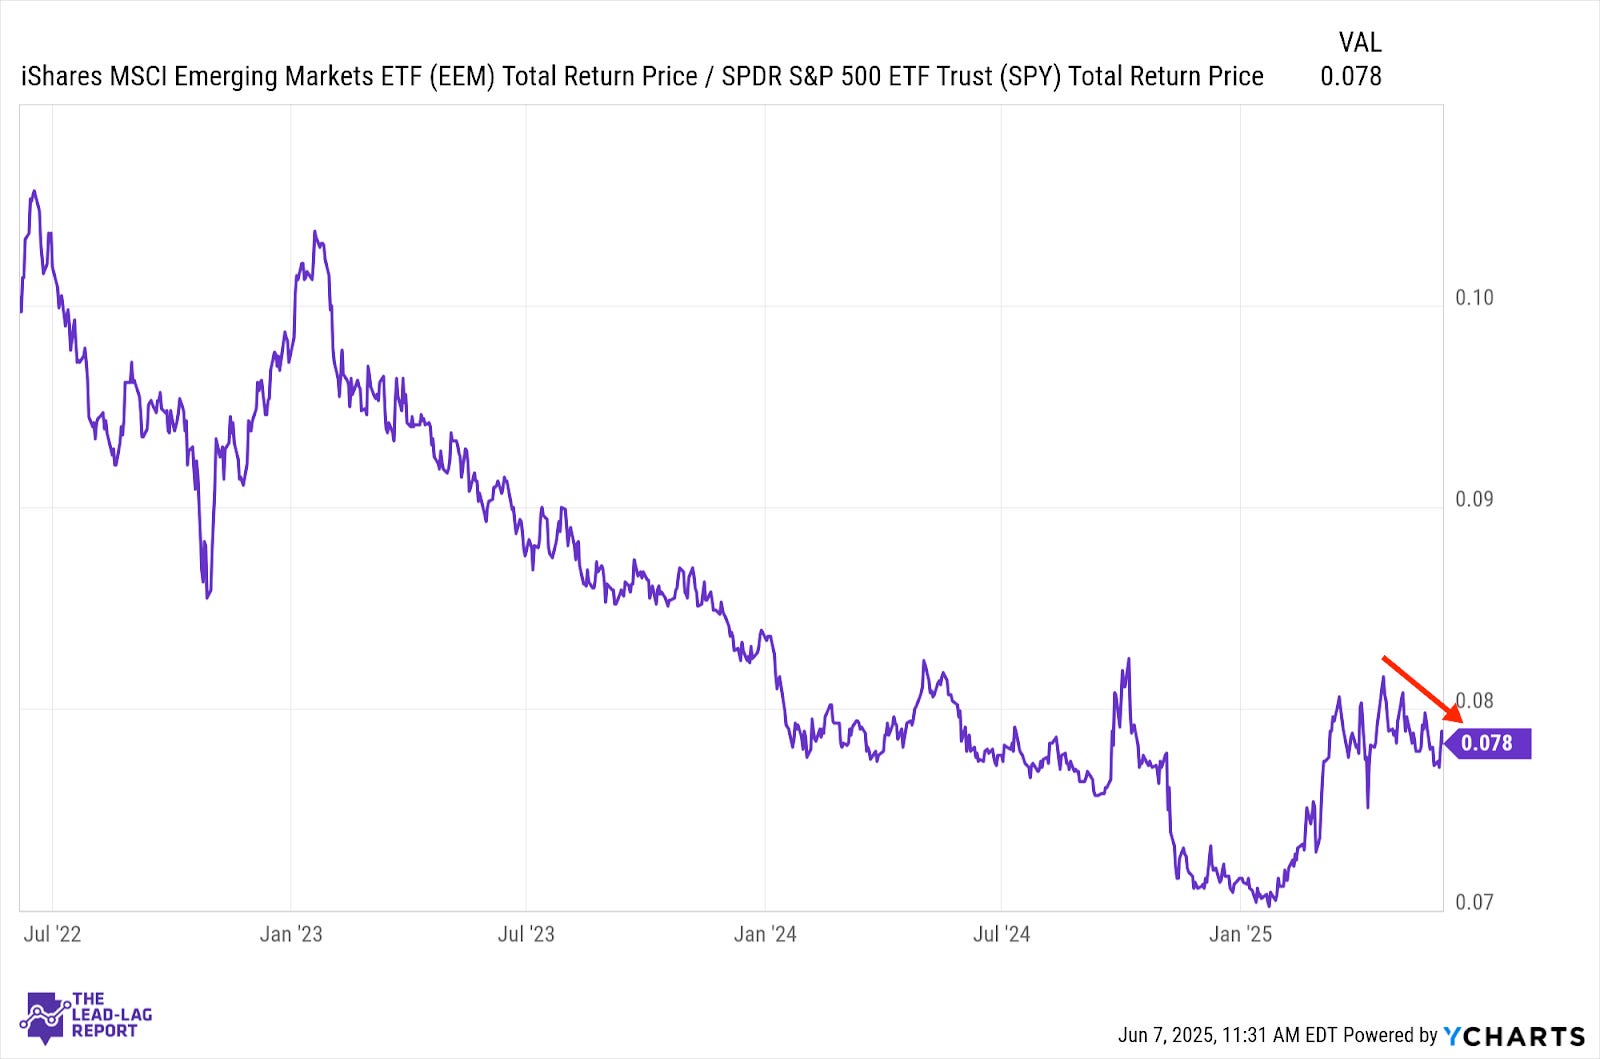
While it isn’t necessarily reflected in this chart, emerging markets just hit a 3+ year high and have been in a shallow, yet steady, uptrend since late 2022. During periods of risk-off in U.S. equities or ramp-ups in tariff tensions, emerging markets have actually demonstrated some ability to act as a source of gains & diversification. Economies less impacted by the Trump tariffs have been able to perform better.
U.S Dollar ($USD) – A Real Disconnect
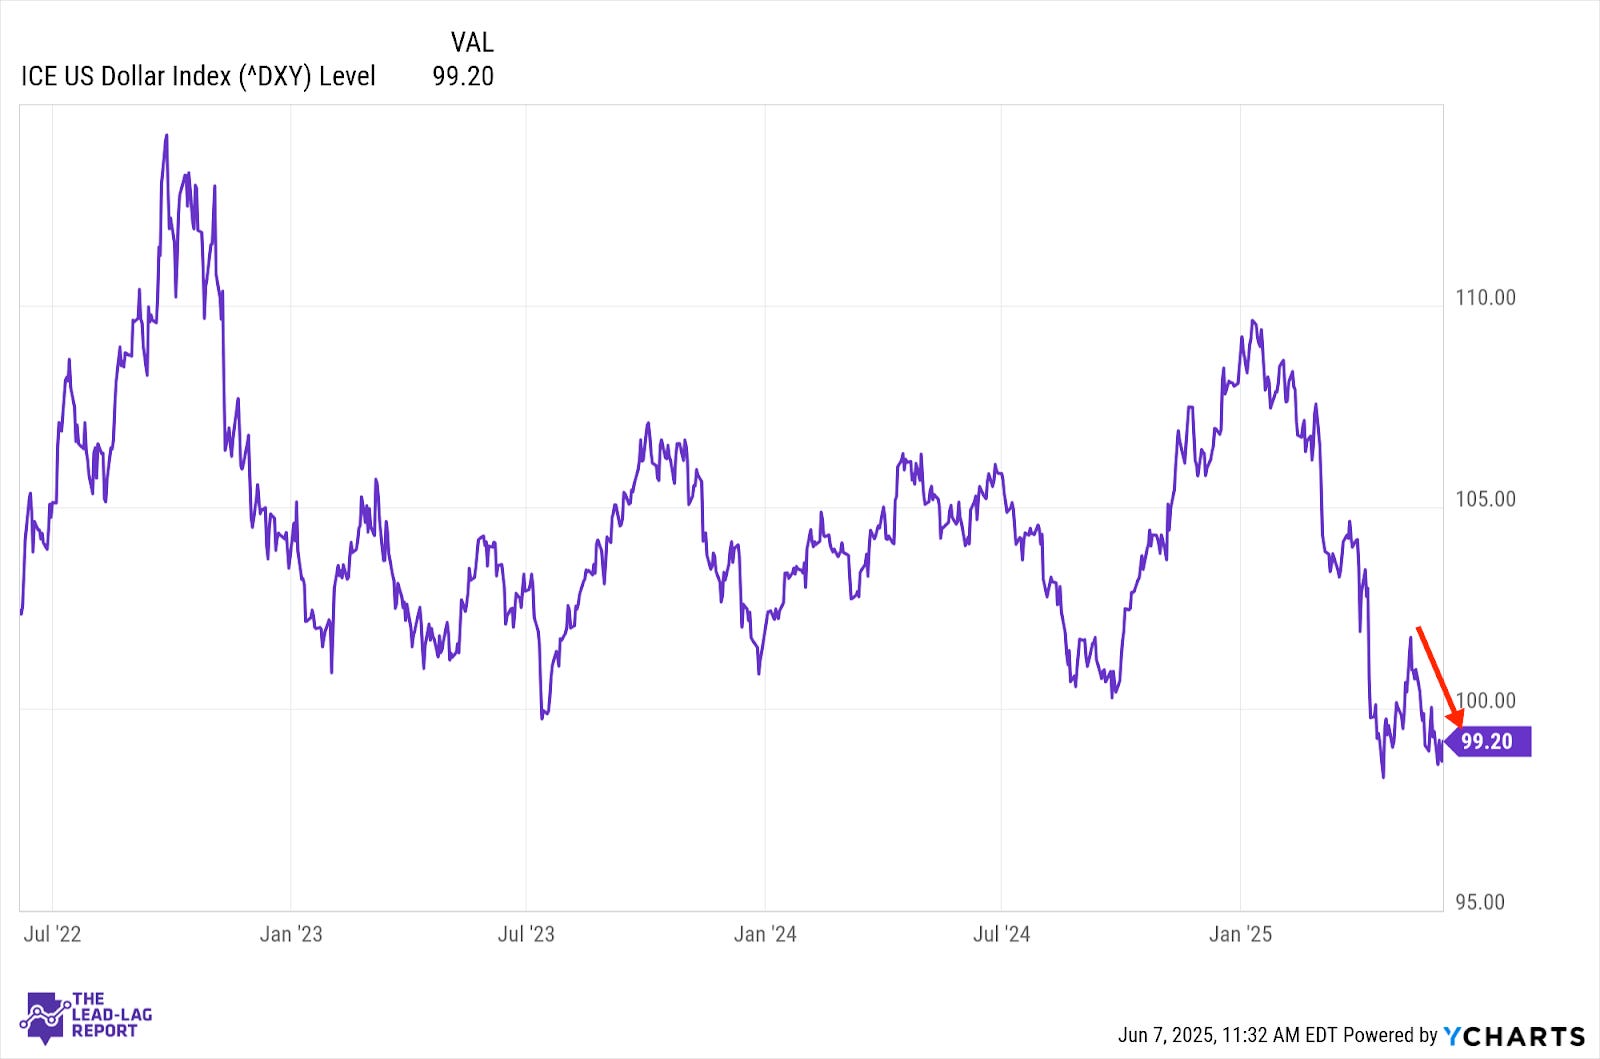
The dollar’s brief rally died out pretty quickly and serves as a reminder that while stocks are rallying, the fixed income market is still raising some pretty significant concerns. The fact that the dollar is falling while yields are rising is a real disconnect and shows the market has still not stabilized. Stocks may be reflecting positive short-term sentiment or optimism around the direction of the U.S. economy, but bonds and currencies are signalling something more.
Lumber (LUMBER) – Starting To Align
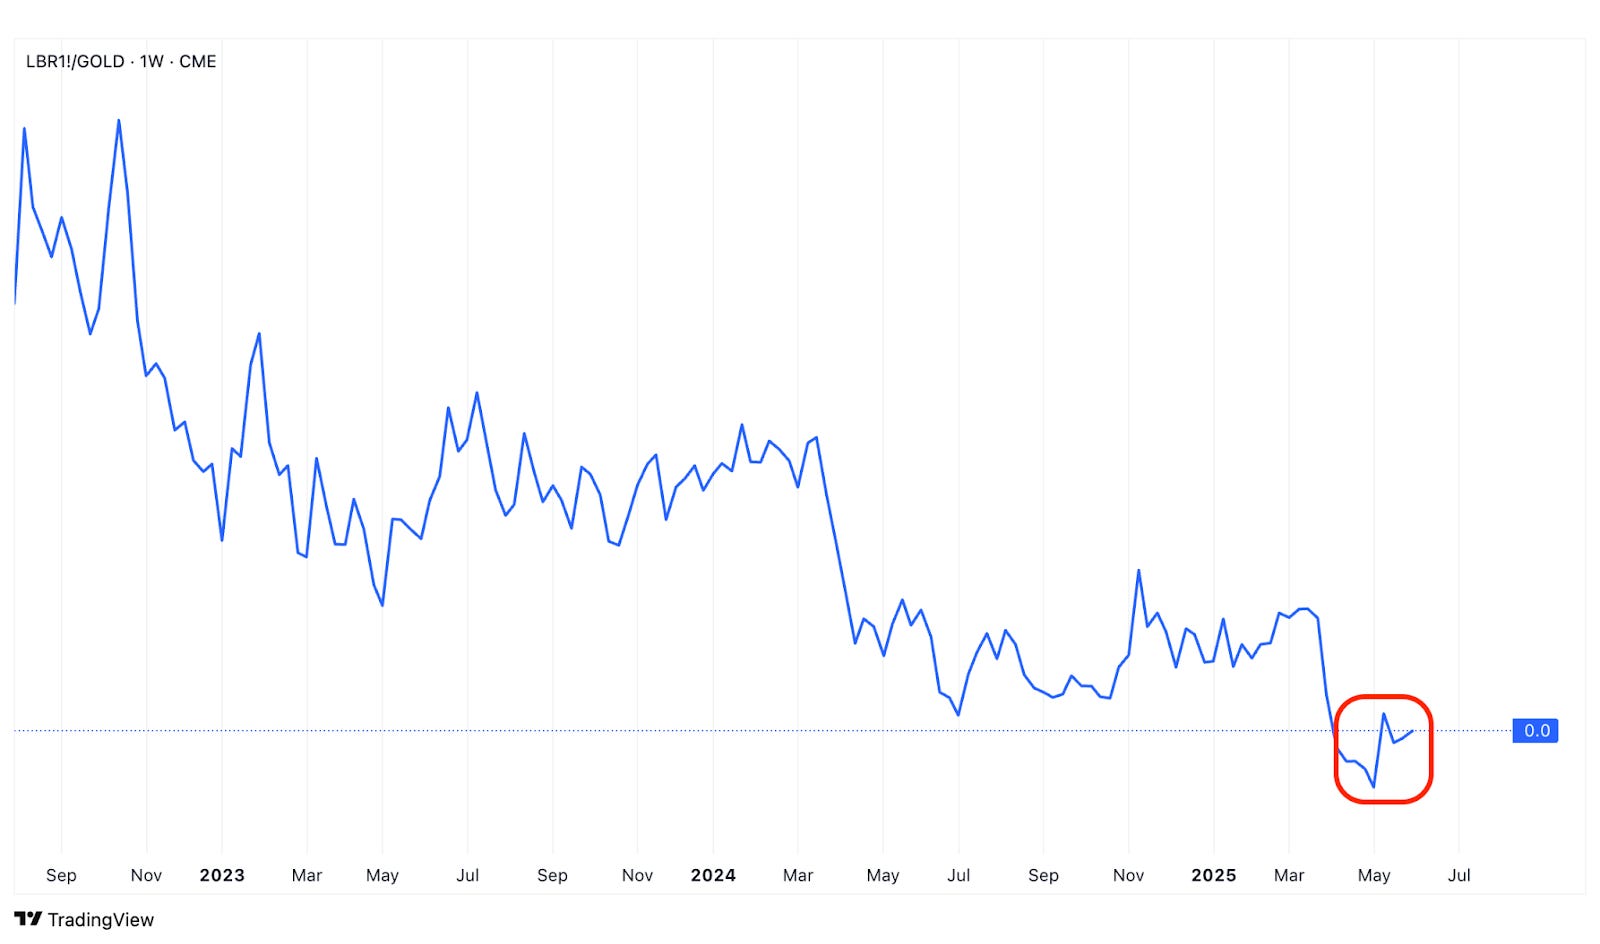
Gold, which has been the de facto risk-off asset throughout the post-Liberation Day cycle, has been pulling back in line with the rally in U.S. stocks. Lumber is starting to show some signs of life again as this ratio slowly begins to shift in a risk-on direction. This signal has perhaps been more directly affected by the potential impact of a global slowdown, but it’s starting to move in line with the others now.
The Lead-Lag Report is provided by Lead-Lag Publishing, LLC. All opinions and views mentioned in this report constitute our judgments as of the date of writing and are subject to change at any time. Information within this material is not intended to be used as a primary basis for investment decisions and should also not be construed as advice meeting the particular investment needs of any individual investor. Trading signals produced by the Lead-Lag Report are independent of other services provided by Lead-Lag Publishing, LLC or its affiliates, and positioning of accounts under their management may differ. Please remember that investing involves risk, including loss of principal, and past performance may not be indicative of future results. Lead-Lag Publishing, LLC, its members, officers, directors and employees expressly disclaim all liability in respect to actions taken based on any or all of the information on this writing.