
Below the Line
Three of four signals favor safety as the S&P 500 breaks further below its 200-day moving average. Gold's crash drives the lone Risk-On reading.

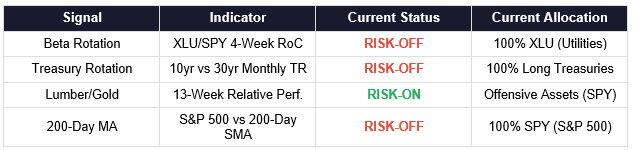
SIGNAL SUMMARY
Key Takeaways:
• The Beta Rotation signal (XLU/SPY 4-week RoC of +2.45%) remains Risk-Off for the fourth consecutive week. Utilities continue to outperform the S&P 500 despite both selling off sharply on Friday. With oil above $110 and the Fed on hold, investors continue favoring lower-beta exposure.
• Treasuries remain Risk-Off. The February monthly data (TLT +4.24% vs IEF +2.14%) is unchanged and won’t update until March month-end. But the bond market reversed hard on Friday — TLT fell to $85.83 as traders began pricing a potential Fed rate hike. The safe-haven bid that dominated earlier in the week gave way to inflation fears as Brent crude held above $110.
• The Lumber/Gold signal remains Risk-On as gold’s liquidation-driven crash deepened. Gold fell to $4,497 on Friday, extending its decline from above $5,000 two weeks ago. Lumber’s 13-week return of +9.34% now exceeds gold’s +2.25% by a wider margin. This continues to be a technical artifact of forced selling in gold, not genuine economic optimism.
• The S&P 500 has now broken decisively below its 200-day moving average. At 6,506.49, the index sits -1.6% below its 200-day SMA of 6,612.54, widening from -0.5% last week to -1.6%. The S&P 500 has posted four consecutive weekly losses — the longest streak since the April 2025 correction.
MARKET COMMENTARY
Four weeks into the US-Iran conflict, 3 of four intermarket signals read Risk-Off. The signal composition is unchanged from last week — Beta Rotation, Treasury Rotation, and the 200-Day MA all favor defense, while Lumber/Gold remains technically Risk-On. But the underlying picture has deteriorated. The S&P 500 broke further below its 200-day moving average, gold’s liquidation accelerated, and the bond market cracked on Friday as traders began pricing a potential Fed rate hike. The fourth consecutive weekly loss for equities underscores the damage being done by triple-digit oil and geopolitical uncertainty.
This was a week of escalation on every front. On Wednesday, the Fed held rates at 3.5-3.75% with its hawkish hold, and Chair Powell reiterated that inflation was “not coming down as much as hoped.” On Thursday, Brent crude spiked to $119 per barrel after strikes on Iran’s South Pars gas field and Qatar’s Laff LNG facility — the world’s largest. By Friday, oil had settled to $112 but the damage was done: the S&P 500 fell 1.5% on the day to 6,506, extending its losing streak to four weeks. Markets are now pricing roughly a 50% chance of a Fed rate hike by October, up from 6% just days ago.
The 200-Day Moving Average breakdown is accelerating. The S&P 500 at 6,506.49 now sits -1.6% below its 200-day SMA of 6,612.54, widening sharply from -0.5% last week. This is no longer a flirtation with the trendline — the index is now decisively below it. UBS maintained its year-end S&P target of 7,700 on Monday, but the technical damage is mounting. The last time the S&P 500 broke its 200-day average, in March 2025, the index fell roughly 15% before stabilizing.
The Beta Rotation signal (XLU/SPY 4-week RoC of +2.45%) remains Risk-Off, though the gap is narrowing. Both XLU and SPY fell sharply on Friday — XLU dropped to $44.65 from $46.54 the prior day, while SPY tumbled to $648.57 from $659.80. The 4-week RoC has moderated from +5.03% last week to +2.45%, suggesting the defensive trade is still in play but less extreme. Friday’s broad liquidation hit utilities too, but the signal remains clearly in defensive territory.
The Treasury signal remains Risk-Off on the February monthly data (TLT +4.24% vs IEF +2.14%), unchanged until March closes. But the real-time bond market told a different story this week. TLT dropped to $85.83 on Friday, a sharp reversal from $87.49 just the day before. The catalyst: traders are now pricing a meaningful probability of a Fed rate hike rather than a cut. Fed Governor Bowman’s comment that she has “written in three cuts before year-end” was drowned out by the market’s inflation fears. With oil above $110, the bond market is shifting from recession-hedging to inflation-hedging — a dangerous regime change for long-duration positions.
The Lumber/Gold signal remains Risk-On as gold’s forced liquidation deepened. Gold fell to $4,497 on Friday, down from $4,607 last week and from above $5,000 just two weeks ago — a decline of roughly 10% that WSJ called the worst weekly drop since 2011. Lumber held steady at $609, posting a 13-week return of +9.34% versus gold’s now-shrunken +2.25%. The widening spread reinforces the technical Risk-On reading, but this remains entirely an artifact of gold’s liquidation. All seven Lumber/Gold sub-strategies remain in offensive positioning, though investors should treat this signal with skepticism given the forced-selling dynamics at play.
The intermarket framework remains heavily tilted toward defense. Three signals favor caution: Utilities are outperforming (Beta Rotation), long bonds led last month (Treasuries), and the 200-day MA is now decisively broken. The one Risk-On reading (Lumber/Gold) is driven by gold’s ongoing liquidation crash. The new development this week is the bond market’s shift toward pricing rate hikes rather than cuts — a potential headwind for both equities and long-duration Treasuries. If oil stays above $100 and the Fed pivots hawkish, even the defensive positions could come under pressure. Late Friday, President Trump announced the U.S. is considering a “winding down” of military activities in Iran, and Israeli PM Netanyahu suggested the conflict could end “sooner than anticipated.” If geopolitical tensions genuinely de-escalate, the signal framework could shift rapidly.
SIGNAL 1: BETA ROTATION
Based on: “Opposing Behavioral Forces: Beta Rotation” (SSRN 2417974)
Target Investor: Self-directed investors who want to capture relative strength between equity market segments. This signal uses the 4-week rate of change of the Utilities-to-S&P 500 price ratio to determine whether the market favors offense (broad equity) or defense (Utilities).
CURRENT INDICATOR: RISK-OFF
XLU/SPY 4-Week Rate of Change: 2.45%
Current Allocation: 100% XLU (Utilities Select Sector SPDR)

Growth of $100,000 | YTD from January 3, 2025 | Data: Lead-Lag Publishing, LLC
SIGNAL 2: TACTICAL RISK ROTATION
Based on: “A Quantitative Approach to Tactical Asset Allocation” (SSRN 2431022)
Target Investor: Conservative to moderate investors seeking a tactical overlay between equities and long-duration Treasuries. This signal compares the prior month total return of 10-year versus 30-year Treasury bonds to identify shifts in the yield curve’s risk appetite signal.
CURRENT INDICATOR: RISK-OFF
