
Calm Spreads, a Re-Steepening Curve, and the Credit-Rotation Setup Most Investors Ignore (JOJO)

KEY HIGHLIGHTS
· **High yield credit spreads remain compressed**: the ICE BofA US High Yield OAS was **2.78% on 2026-05-04**.[2]
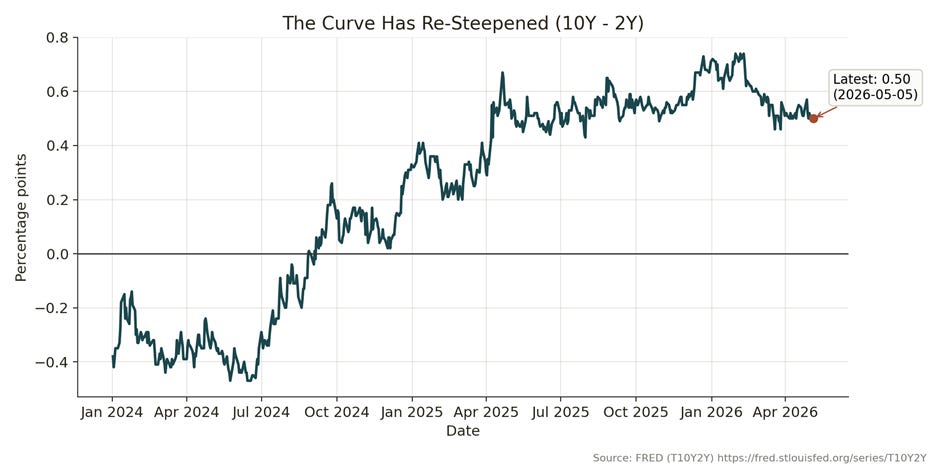
· **The Treasury curve is positive again**: the 10-year minus 2-year Treasury spread was **+0.50% on 2026-05-05**.[4]
· **Inflation is not “gone,” it is shifting**: CPI-U was **+3.3% YoY** and core CPI was **+2.6% YoY** in March 2026.[1]
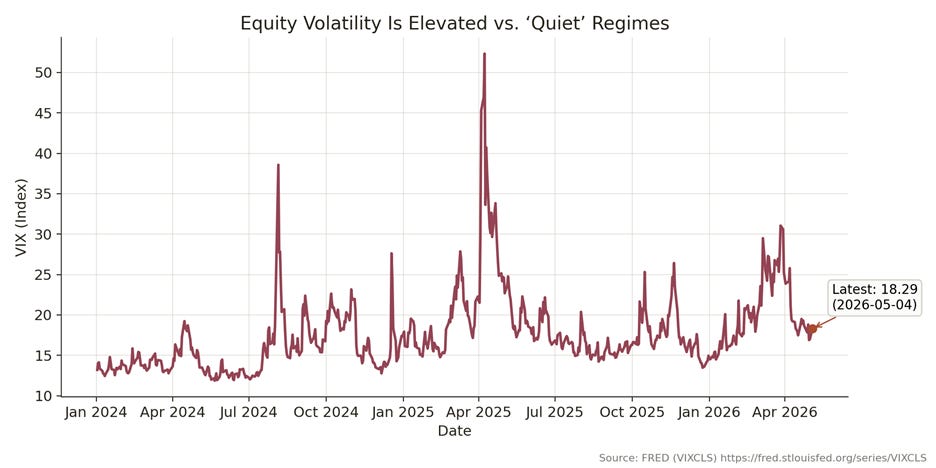
· **Volatility is not flashing panic, but it is not asleep either**: VIX was **18.29 on 2026-05-04**.[5]
· Tight spreads + a normalizing curve can be the most dangerous combination: it often invites leverage and duration mistakes right before credit “reprices.”
When spreads are quiet and the curve is re-steepening, the market loves to declare victory. I think that’s a mistake. Quiet is not the same thing as safe. In credit, the real stress often shows up after positioning becomes one-sided — and the signals that matter most are rarely the ones investors are staring at.
WHY “CALM” CREDIT CAN BE A WARNING
Credit investors tend to anchor on one variable: the level of spreads. When the spread between high yield and Treasuries is tight, the default assumption is that the economy is fine and the cycle is stable. Right now, the ICE BofA US High Yield index option-adjusted spread (OAS) sits at **2.78% (2026-05-04)**, and BB spreads are **1.70% (2026-05-04)**.[2] [3]
Those numbers are not screaming distress. They are signaling confidence.
But confidence in credit often peaks when three things happen at the same time:
1) investors are paid very little to take risk,
2) the curve begins to re-steepen (so carry looks attractive again), and
3) macro uncertainty becomes “background noise” rather than headline risk.
The irony is that this combination can be precisely when the next repricing risk is highest.
Macro “quiet” encourages investors to extend out the risk spectrum — lower quality, longer duration, more leverage. And because credit tends to lag equities in the early part of a volatility regime shift, spreads can remain deceptively tight even as the probability distribution of outcomes is widening.
THE CURVE IS POSITIVE AGAIN — THAT CHANGES BEHAVIOR
After years of inversion, the curve being positive again is psychologically powerful. The 10-year minus 2-year spread is **+0.50% (2026-05-05)**.[4] That is not just a macro talking point — it changes how portfolios are constructed.
A positive curve encourages:
- duration extension (because long Treasuries offer “more yield”),
- carry trades (because borrowing short and investing long looks sensible again), and
- the belief that the policy cycle has “turned.”
But in a world where inflation is still running above target, a positive curve does not automatically mean the risk-free asset is “safe.” In March 2026, CPI-U rose **3.3% year-over-year**, while core CPI rose **2.6% year-over-year**.[1] The direction of inflation matters less than the reality that it is not yet comfortably anchored at 2%.
This matters for credit because the biggest credit mistakes tend to be made when investors think they can own both spread risk and duration risk at the same time without consequence.
If rates volatility rises, long-duration Treasuries can rally — but credit can simultaneously widen. If inflation surprises, long-duration Treasuries can sell off — and credit can widen. In other words: the “wrong” environment can show up from two different directions.
VOLATILITY IS QUIET — BUT NOT LOW ENOUGH TO BE COMPLACENT
Volatility is not flashing crisis. But it is also not at levels consistent with an easy, stable, low-risk regime. The VIX was **18.29 on 2026-05-04**.[5]
In my experience, what matters is not whether the VIX is “high” or “low” in absolute terms. What matters is whether it is beginning to behave differently — making higher lows, spiking more frequently, and refusing to stay suppressed.
When volatility stops being suppressed, credit eventually responds. Not always immediately, but it responds.
This is where investors often misread cause and effect:
- They wait for spreads to widen before de-risking.
- But spreads often widen after the leading indicators shift — utilities relative strength, equity volatility behavior, and cross-asset correlations.
By the time spreads are wide, the opportunity set has changed.
THE SIGNAL MOST PEOPLE IGNORE: UTILITIES RELATIVE TO THE S&P 500
One of the more reliable “tells” in markets is when defensive equity leadership emerges underneath the surface.
Utilities are a classic example because they tend to act like a hybrid between equity beta and bond duration. When utilities begin to outperform the broader market, it is often a subtle sign that investors are moving toward stability and away from cyclicality — sometimes before headlines reflect that shift.
That matters because there is a long history of credit spreads widening after defensive leadership takes hold. The mechanism is intuitive:
- utilities leadership often coincides with slowing growth expectations,
- slowing growth expectations raise default risk probabilities (even if defaults don’t immediately rise), and
- the market begins to demand more compensation for taking credit risk.
I can’t stress this enough: credit is often late to acknowledge regime changes.
And this is precisely why rotation matters.
WHAT JOJO IS DESIGNED TO DO IN THIS ENVIRONMENT
This is the premise behind **ATAC Credit Rotation ETF (Ticker: JOJO)**.
JOJO is built around a simple, rule-driven idea: rotate exposure based on a leading intermarket signal. Historically, when utilities outperform the S&P 500, volatility in risk assets tends to rise afterward — and credit spreads tend to follow.[1]
Rather than trying to forecast earnings, default rates, or the next Fed meeting, the strategy focuses on what markets are already implying.
In practice, JOJO rotates between:
- high yield exposure (when the signal is risk-on), and
- long-duration Treasuries (when the signal is risk-off).
Why those two assets? Because they are often on opposite sides of a volatility regime shift.
If you are wrong about the cycle, owning “static” credit exposure can be unforgiving. If you are wrong about the cycle, a rotation framework at least gives you the chance to respond as the market’s internal leadership changes.
WHEN TIGHT SPREADS BECOME AN OPPORTUNITY (NOT A COMFORT BLANKET)
Tight spreads are not inherently bearish. They can stay tight for long periods. The risk is not that spreads are tight — the risk is what investors do because spreads are tight.
Compressed spreads encourage:
- reach-for-yield behavior,
- lower underwriting standards,
- crowded positioning,
- a false sense of diversification.
When the curve is positive and carry looks attractive, those behaviors intensify.
But from a tactical perspective, tight spreads can actually improve the “signal value” of rotation. Why?
Because if spreads are already wide, the market has already priced in stress. The tactical edge often comes from recognizing stress before it is priced in — not after.
A rotation strategy is not about predicting the future. It is about respecting the cycle.
THE BOTTOM LINE
The bond market is sending a mixed message. Inflation is still present.[1] The curve has re-steepened.[4] Credit spreads are calm.[2] [3] Volatility is not panicked, but it is not asleep.[5]
That combination can lull investors into believing the “hard part” is over.
I disagree.
When spreads are tight, the cost of being wrong rises. When the curve is positive, the temptation to take the wrong kind of risk rises. And when volatility begins to behave differently, the repricing in credit rarely stays contained.
In that environment, I believe a systematic rotation approach — one that shifts between credit risk and duration defensiveness — is not just reasonable. It is prudent.
Michael A. Gayed, CFA
ENDNOTES
1. U.S. Bureau of Labor Statistics, “Consumer Price Index Summary — March 2026,” news release, April 10, 2026, https://www.bls.gov/news.release/cpi.nr0.htm
2. Federal Reserve Bank of St. Louis, “ICE BofA US High Yield Index Option-Adjusted Spread (BAMLH0A0HYM2),” FRED, accessed May 6, 2026, https://fred.stlouisfed.org/series/BAMLH0A0HYM2
3. Federal Reserve Bank of St. Louis, “ICE BofA BB US High Yield Index Option-Adjusted Spread (BAMLH0A1HYBB),” FRED, accessed May 6, 2026, https://fred.stlouisfed.org/series/BAMLH0A1HYBB
4. Federal Reserve Bank of St. Louis, “10-Year Treasury Constant Maturity Minus 2-Year Treasury Constant Maturity (T10Y2Y),” FRED, accessed May 6, 2026, https://fred.stlouisfed.org/series/T10Y2Y
5. Federal Reserve Bank of St. Louis, “CBOE Volatility Index: VIX (VIXCLS),” FRED, accessed May 6, 2026, https://fred.stlouisfed.org/series/VIXCLS
Michael A. Gayed, CFA
DISCLOSURES
Junk debt, also known as high-yield bonds or speculative-grade debt, refers to fixed-income securities issued by companies or governments with lower credit ratings, offering higher interest rates to compensate investors for the elevated risk of default.
The VIX index, often called the “fear gauge” of Wall Street, is a real-time market index that measures the market’s expectation of 30-day forward-looking volatility derived from S&P 500 index options prices, serving as a key barometer of investor sentiment and market risk.
The ICE BofA BB US High Yield Index Option-Adjusted Spread measures the yield differential between BB-rated corporate bonds and a spot Treasury curve, quantifying the risk premium for below-investment-grade debt with a BB rating in the US market.
As with all ETFs, Fund shares may be bought and sold in the secondary market at market prices. The market price normally should approximate the Fund’s net asset value per share (NAV), but the market price sometimes may be higher or lower than the NAV. The Fund is new with a limited operating history. There are a limited number of financial institutions authorized to buy and sell shares directly with the Fund, and there may be a limited number of other liquidity providers in the marketplace. There is no assurance that Fund shares will trade at any volume, or at all, on any stock exchange. Low trading activity may result in shares trading at a material discount to NAV.
Because the Fund invests in Underlying ETFs an investor will indirectly bear the principal risks of the Underlying ETFs, including but not limited to, risks associated with investments in ETFs, equity securities, growth stocks, large and small capitalization companies, non-diversification, fixed income investments, derivatives and leverage. The prices of fixed income securities may be affected by changes in interest rates, the creditworthiness and financial strength of the issuer and other factors. An increase in prevailing interest rates typically causes the value of existing fixed income securities to fall and often has a greater impact on longer duration and/or higher quality fixed income securities. The Fund will bear its share of the fees and expenses of the underlying funds. Shareholders will pay higher expenses than would be the case if making direct investments in the underlying funds.
Because the Fund expects to change its exposure as frequently as each week based on short-term price performance information, (i) the Fund’s exposure may be affected by significant market movements at or near the end of such short-term periods that are not predictive of such asset’s performance for subsequent periods and (ii) changes to the Fund’s exposure may lag a significant change in an asset’s direction (up or down) if such changes first take effect at or near a weekend. Such lags between an asset’s performance and changes to the Fund’s exposure may result in significant underperformance relative to the broader equity or fixed income market. Because the Adviser determines the exposure for the Fund based on the price movements of gold and lumber, the Fund is exposed to the risk that such assets or their relative price movements fail to accurately predict future performance.
Past performance is no guarantee of future results.
The Fund’s investment objectives, risks, charges, expenses and other information are described in the statutory or summary prospectus, which must be read and considered carefully before investing. You may download the statutory or summary prospectus or obtain a hard copy by calling 855-ATACFUND or visiting www.atacfunds.com. Please read the Prospectuses carefully before you invest.
Investing involves risk including the possible loss of principal.
JOJO is distributed by Foreside Fund Services, LLC.
Learn more about $JOJO at https://atacfunds.com/jojo/ Lead-Lag Publishing, LLC is not an affiliate of Tidal/Toroso or ACA/Foreside.