

Below is an assessment of the performance of some of the most important sectors and asset classes relative to each other with an interpretation of what underlying market dynamics may be signaling about the future direction of risk-taking by investors. The below charts are all price ratios which show the underlying trend of the numerator relative to the denominator. A rising price ratio means the numerator is outperforming (up more/down less) the denominator. A falling price ratio means underperformance.
LEADERS: UTILITIES & SMALL-CAPS SUGGEST THAT CPI WAS AN OVERREACTION
Energy (XLE) – Potential Supply-Driven Reversal Ahead
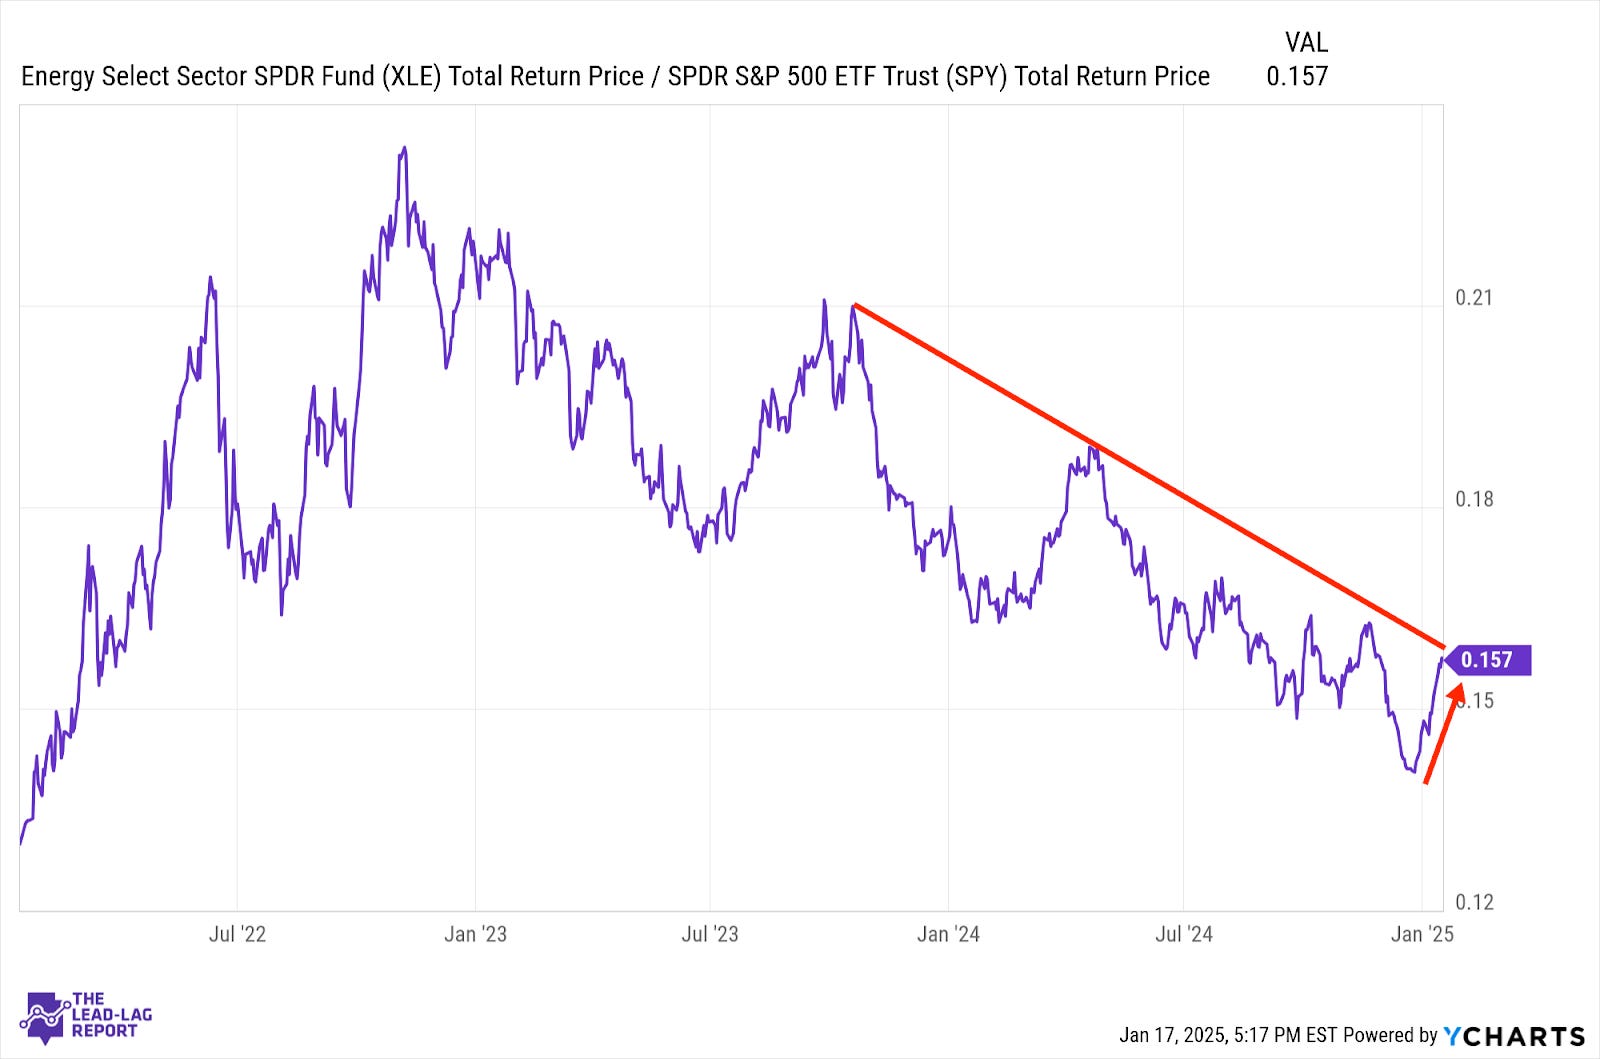
Oil stocks have been advancing nicely on the steady rise in crude oil since Christmas. The momentum looks, however, like it might be reversing. The Israel-Gaza ceasefire has eased tensions in the Middle East and Trump’s promise to increase oil drilling and U.S. energy production could lower prices further on the prospect of increased supplies.
Industrials (XLI) – Not Sure This Can Be Sustained
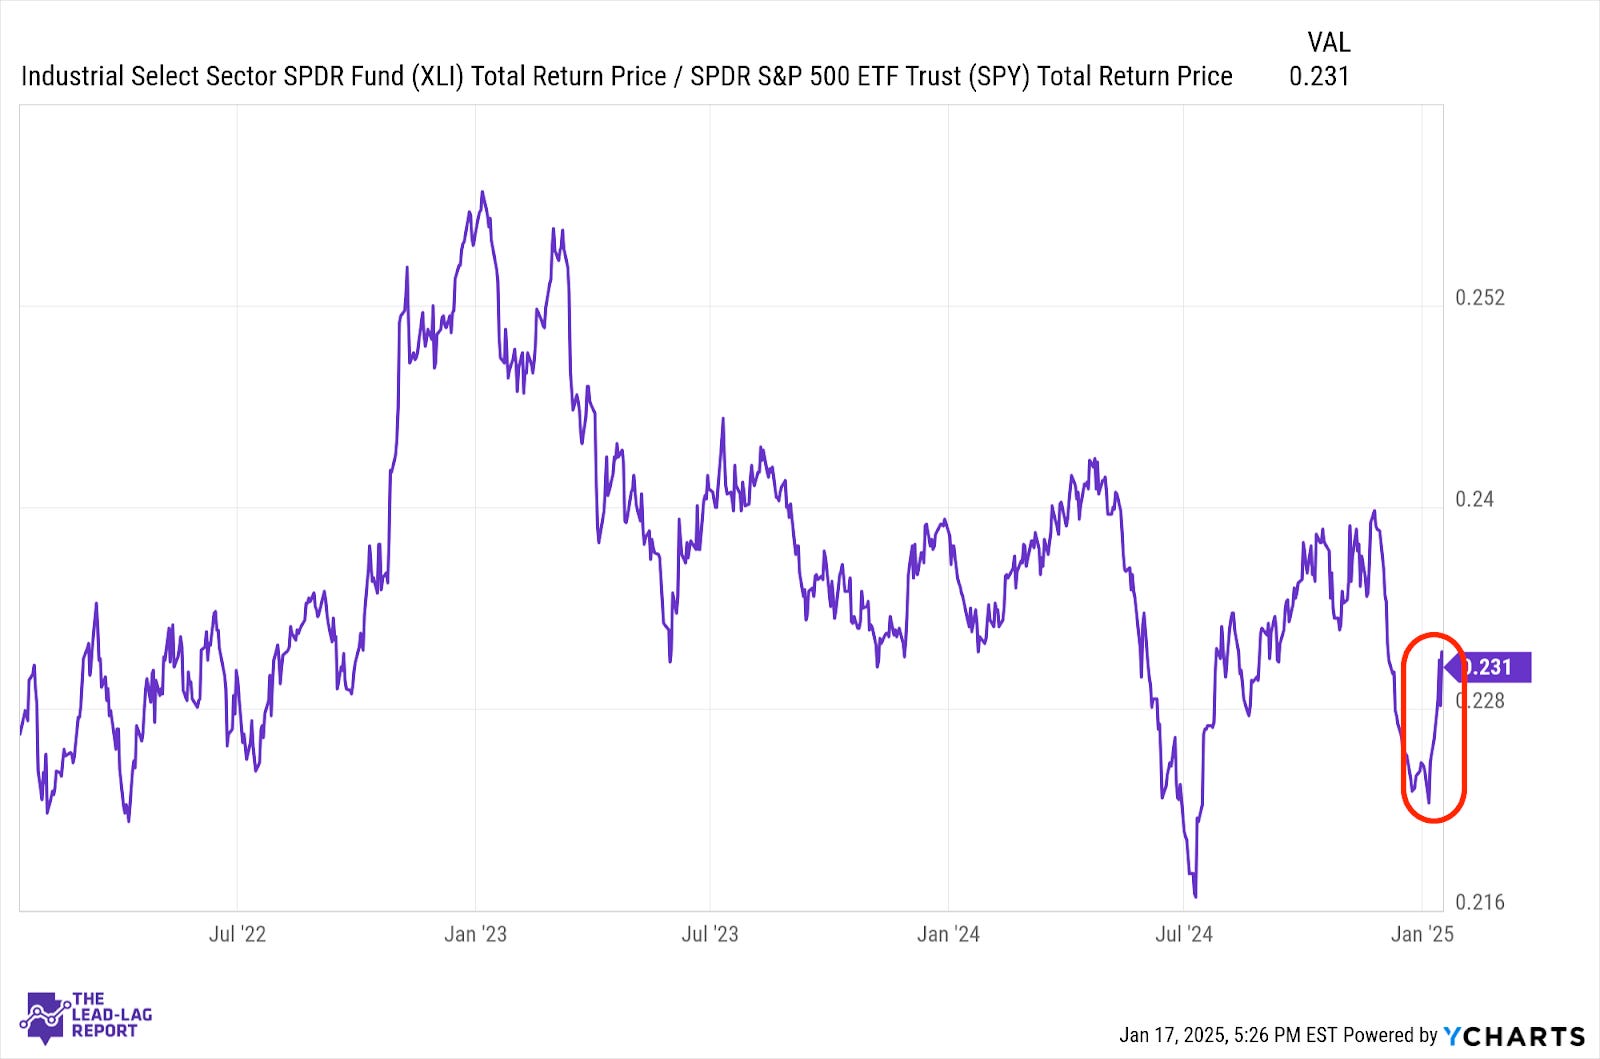
Even a modest improvement for the U.S. inflation outlook was enough to trigger a sharp reversal for cyclicals. The question is whether or not it can be sustained. There’s still a fair amount of evidence suggesting that inflation is a growing problem, which means I’m skeptical that this rally will last. Industrials have been surprisingly volatile for a while now and I think that will continue.
Financials (XLF) – A Steady Comeback
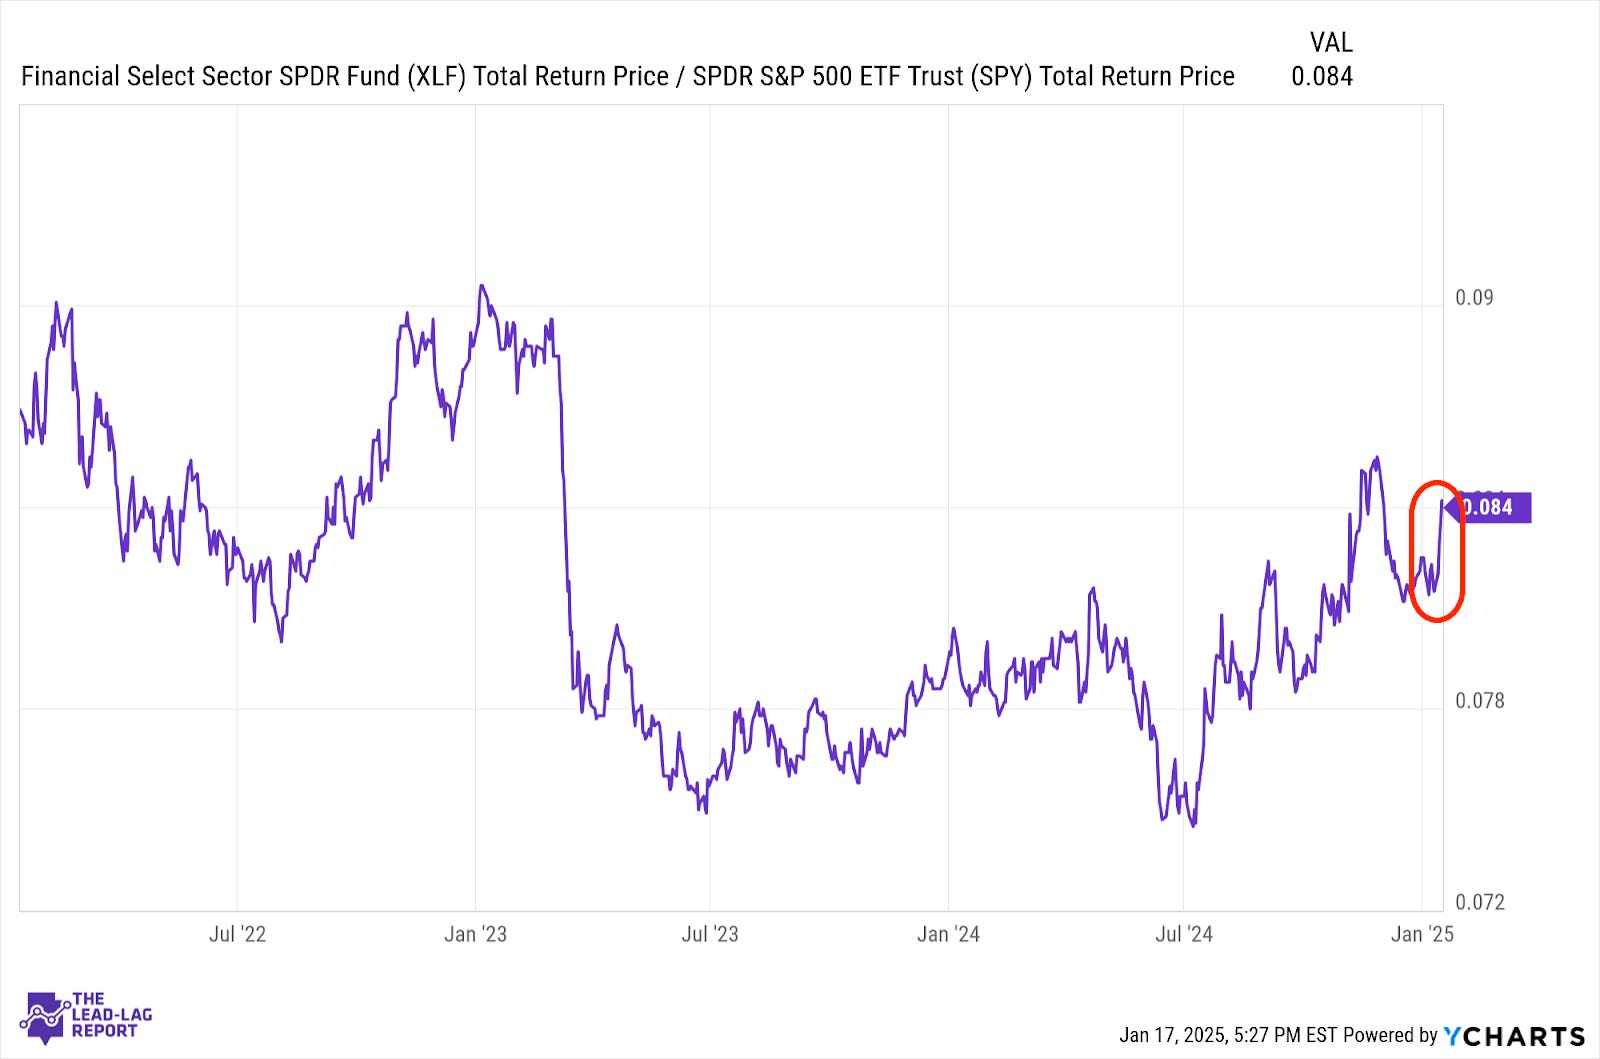
Banks got a big boost from (at least temporarily) lower interest rates. This sector has actually done an admirable job of steadily outperforming the S&P 500 since the regional banking crisis low. Still, the persistence of inflation and higher interest rates will be a headwind from here. Big banks are surviving thanks to a rebound in investment banking and trading revenue, but the bread & butter of this business - lending - remains in doubt.
Materials (XLB) – A Long Time Coming
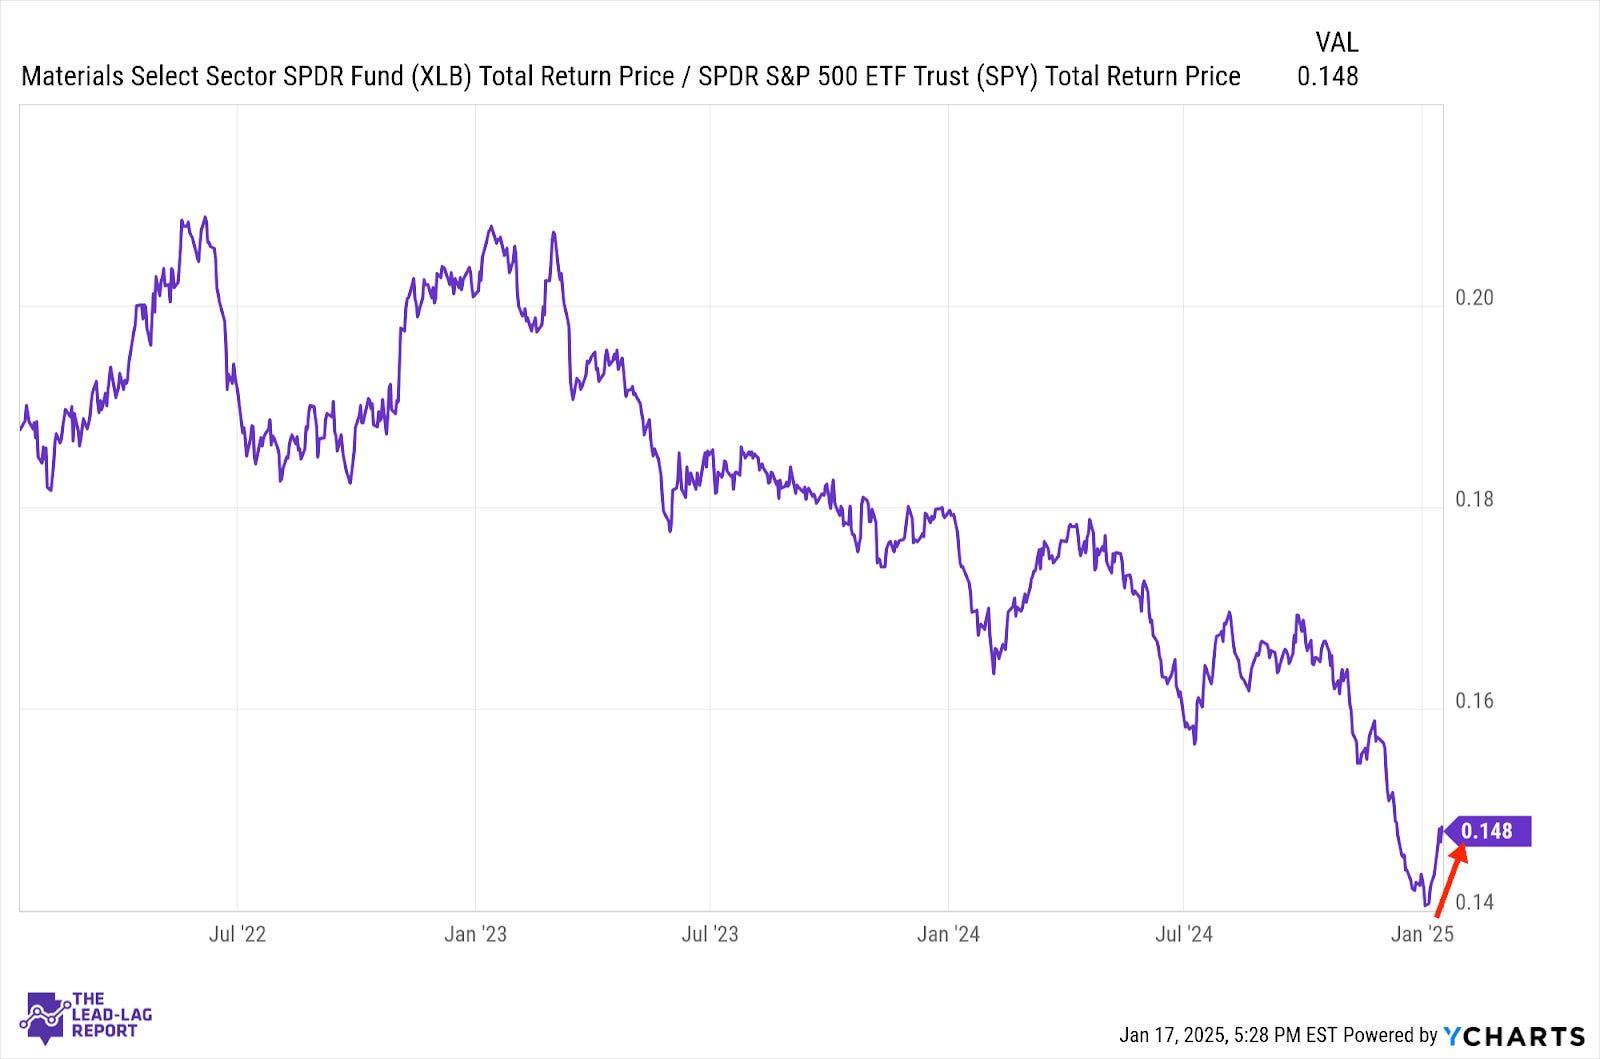
It’s been a long time since the materials sector has been able to enjoy any type of rally. If Q1 and July of 2024 are any indications, the bounce could be short-lived. Many regions of the world are still struggling mightily on the manufacturing side. Through lower rates and stimulus efforts, there is reason for optimism and a case that this sector could lead going forward, but I think we need to see some evidence of sustainable outperformance before we can make that leap.
Utilities (XLU) – Picking Up The Tone
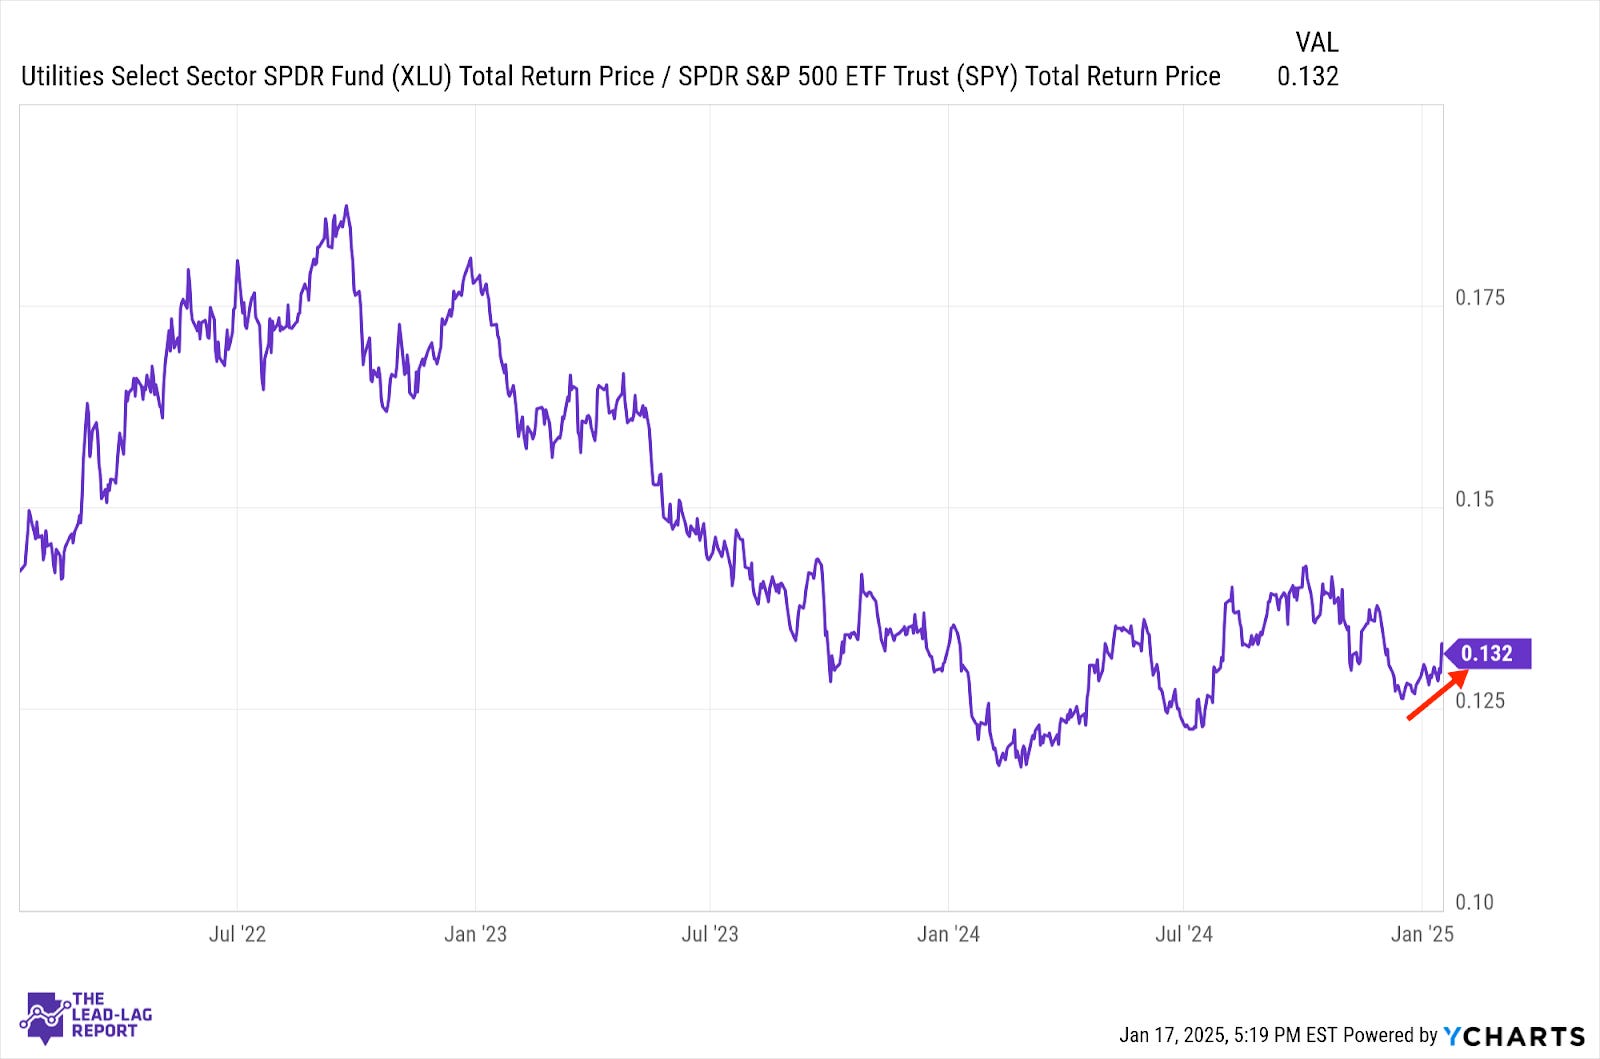
Utilities have been steadily picking up speed again over the past several weeks, successfully picking up the risk-off tone of the markets even before the major averages started dipping. Outside of last week, defensive issues and strategies had been pretty unanimous in suggesting that the markets were getting more cautious. If this coming week provides any catalysts, such as tariff announcements or aggressiveness from the BoJ, this ratio could strengthen further.
Special Announcement
Mind the gap!
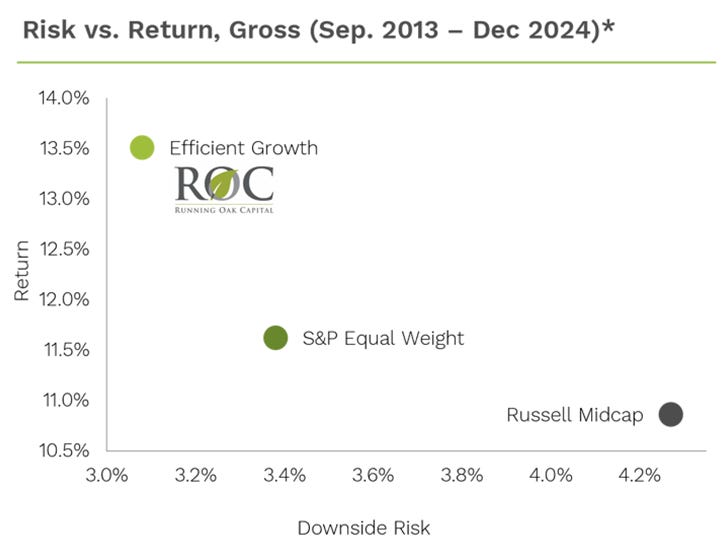
A substantial, oft-unnoticed gap currently exists in the center of the typical equity allocation. Running Oak's Efficient Growth strategy fills that hole like few do, providing significant value like even fewer do.
Why Invest in Efficient Growth:
Top 2-3 percentile: Running Oak’s Efficient Growth separate account has performed in the top 2 to 3% of all Mid Cap core funds in Morningstar's database over the last 10 years, net of fees.1
Since inception, Efficient Growth has provided 26% more return than the S&P 500 Equal Weight Index and 69% more return than the Russell Mid Cap Index, given the same level of downside risk, gross of fees. (Ulcer Performance Index) 1
Outperforming | Opportune – Mid Cap
The standard equity allocation leaves a large gap in upper Mid, lower Large Cap.2
Mid Cap companies have outperformed Large Cap by 0.54%, annualized, over the last roughly 33 years and outperformed Small by 1.85%.3
Mid Cap stocks are roughly 10% undervalued, per the asset class's CAPE ratio. Large Cap is overvalued by 50 to 100%, depending upon the source. 4
How to Invest
Efficient Growth is currently available as an SMA and ETF. (ETF specifics and audited historical performance can't be shared in the same note. Please reach out for the ticker or more information at seth@runningoak.com.)
In just 18 months, The ETF Which Shall Not Be Named has grown over 13,000% since launch – from 2 to 270mm.
All opinions expressed in this newsletter are those of Running Oak Capital’s and do not constitute investment advice.
1For additional data and context regarding the claims made within this email, please refer to the Disclosures and Additional Data document located here.
2Statements on the standard equity allocation are based on informal feedback and experience from interactions with investors and other financial professionals.
3Invesco: "Why Mid Caps Now"
4Ned Davis Research
Investment Advisory Services are offered through Running Oak Capital, a registered investment adviser.
*Past performance is no guarantee of future results. Performance expectations are no guarantee of future results; they reflect educated guesses that may or may not come to fruition. All indices are unmanaged and may not be invested into directly.
The Standard & Poor’s 500 Index is a capitalization weighted index of 500 stocks designed to measure performance of the broad domestic economy through changes in the aggregate market value of 500 stocks representing all major industries.
The opinions voiced in this material are for general information only and are not intended to provide specific advice or recommendations for any individual. To determine which investments and strategies may be appropriate for you, consult with us at Running Oak Capital or another trusted investment adviser.
Statements on the standard equity allocation are based on informal feedback and experience from interactions with investors and other financial professionals.
Stock prices and index returns provided by Standard & Poor’s.
DISCLAIMER – PLEASE READ: This is sponsored advertising content for which Lead-Lag Publishing, LLC has been paid a fee. The information provided in the link is solely the creation of Running Oak. Lead-Lag Publishing, LLC does not guarantee the accuracy or completeness of the information provided in the link or make any representation as to its quality. All statements and expressions provided in the link are the sole opinion of Running Oak and Lead-Lag Publishing, LLC expressly disclaims any responsibility for action taken in connection with the information provided in the link.
Health Care (XLV) – Big Momentum Gauge This Week
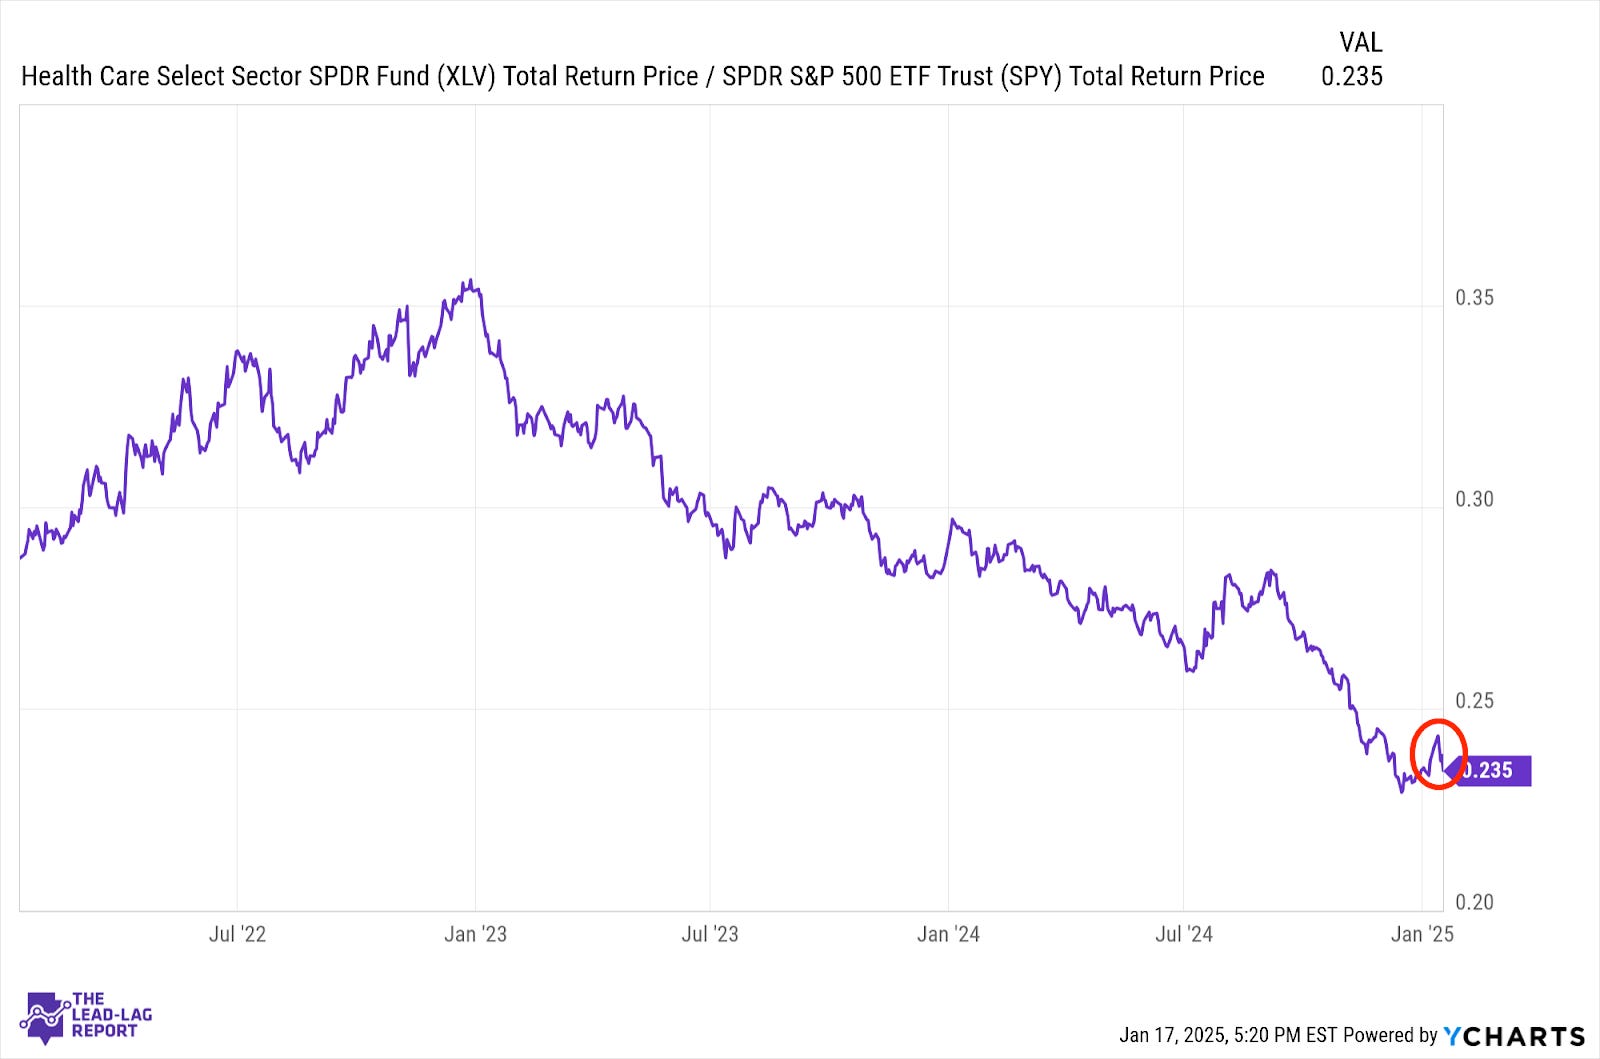
Unfortunately, the recent outperformance from this sector looks like it could be a dud again. Last week provided a big risk-on boost for the market, but it could still be a one-off jolt as opposed to a broader sentiment change. If healthcare underperforms again this week with all of the potentially negative catalysts at hand, it seems likely to say that momentum here has officially fizzled.
Treasury Inflation Protected Securities (SPIP) – Undeterred
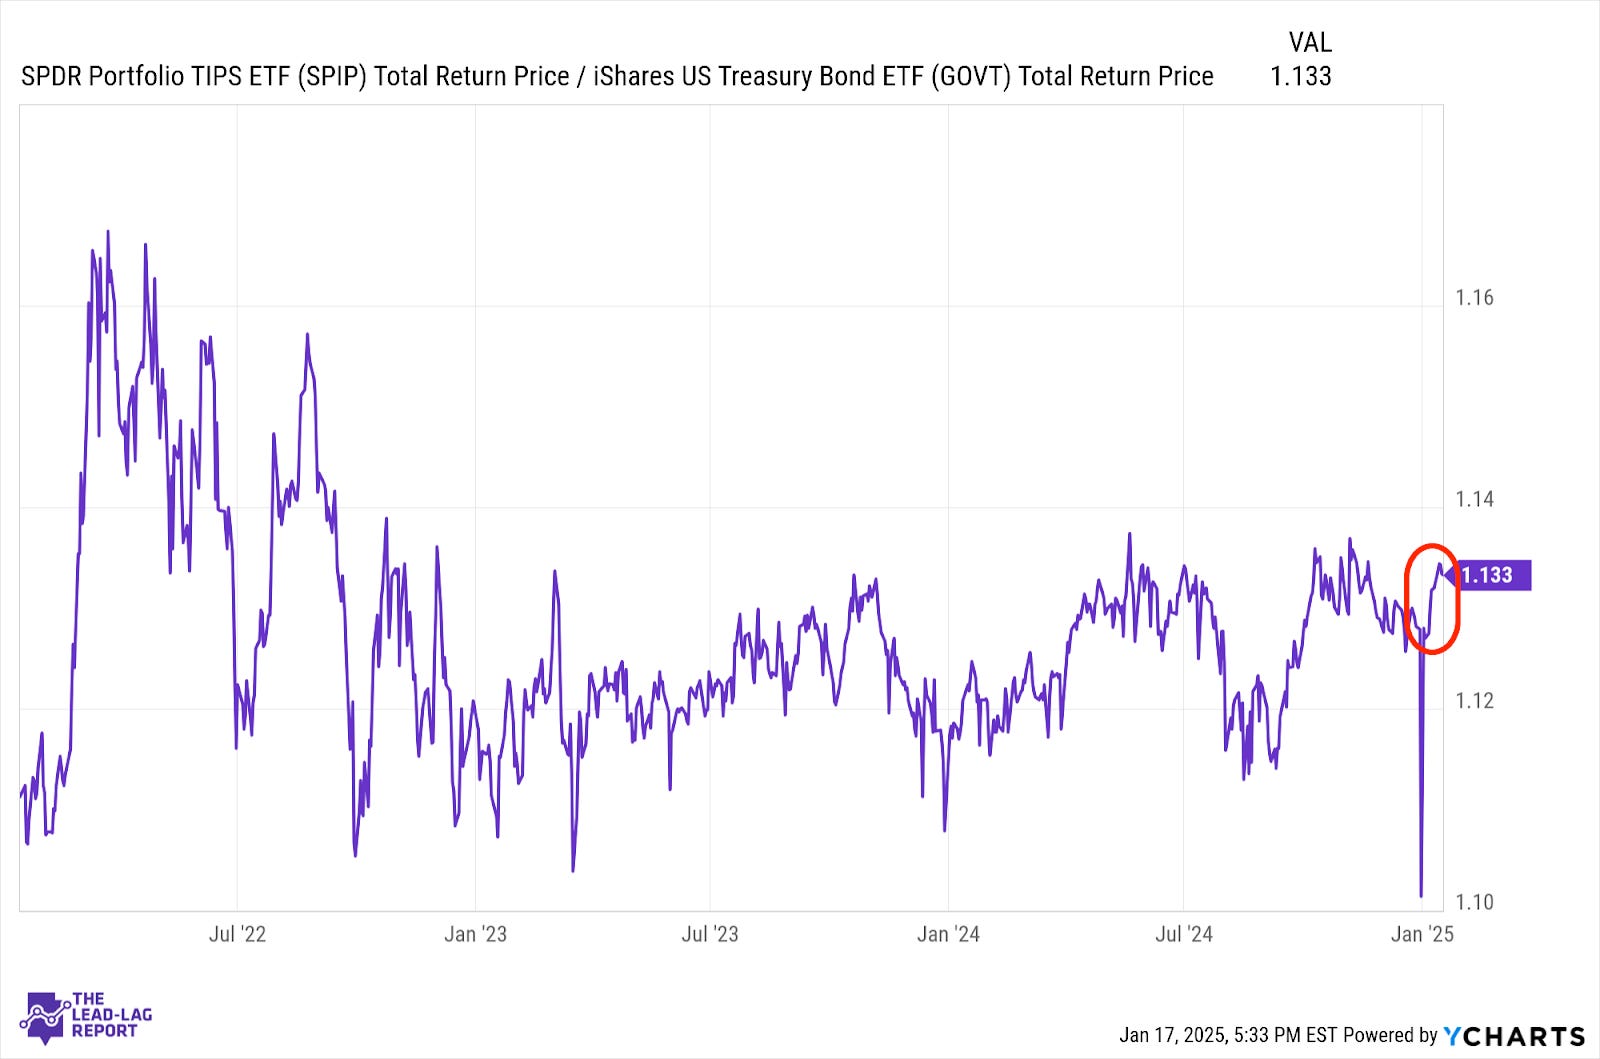
It’s interesting that the relative rebound in TIPS happened following a cooler than expected inflation report. The overall trend, however, remains intact and that’s that there is no major interest in inflation protection at the moment (unless you want to count gold). A 2.9% headline rate, while well above the Fed’s 2% target, isn’t discouraging many into action at the moment.
Junk Debt (JNK) – Downside Risk Grows
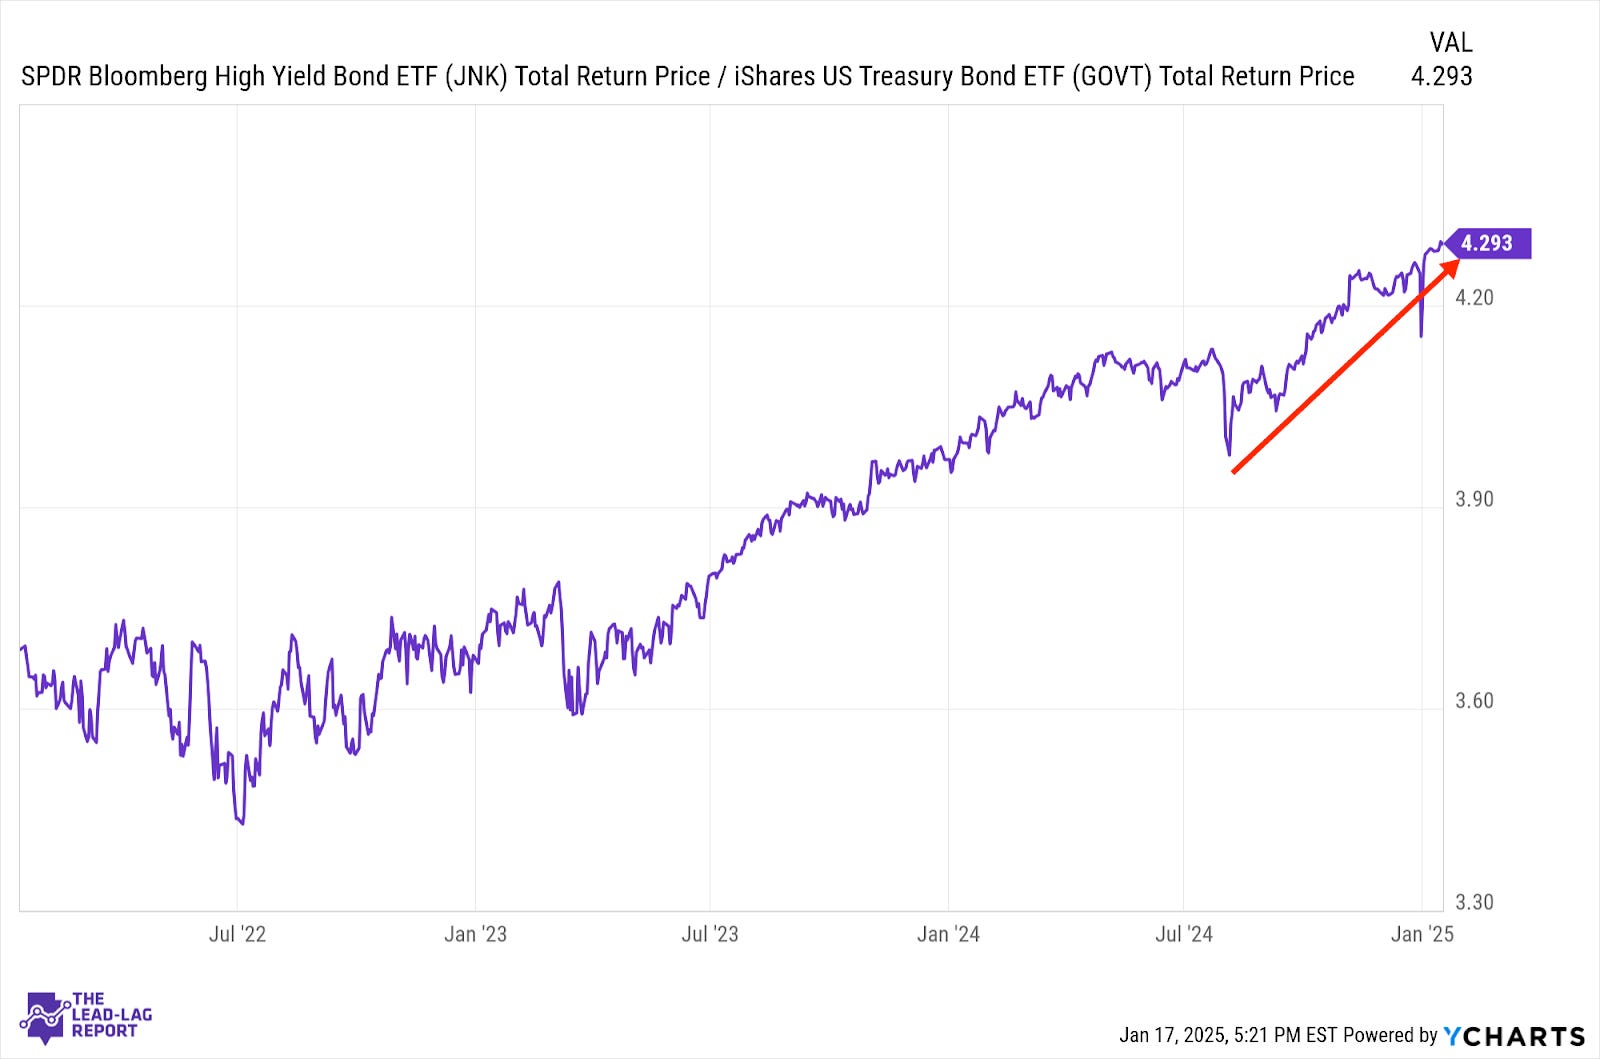
Throughout the recent uncertainty, junk bonds remain the one seeming certainly in the bond market. High yield spreads have moved lower over the past three weeks and threaten to take out their 17-year low. Every basis point that spreads continue to go lower increases the downside potential of an impending reversal. With credit delinquencies still on the rise at multi-year highs, it gets tougher to see how the bond market avoids this repricing.
European Banks (EUFN) – Volatility Is Still High
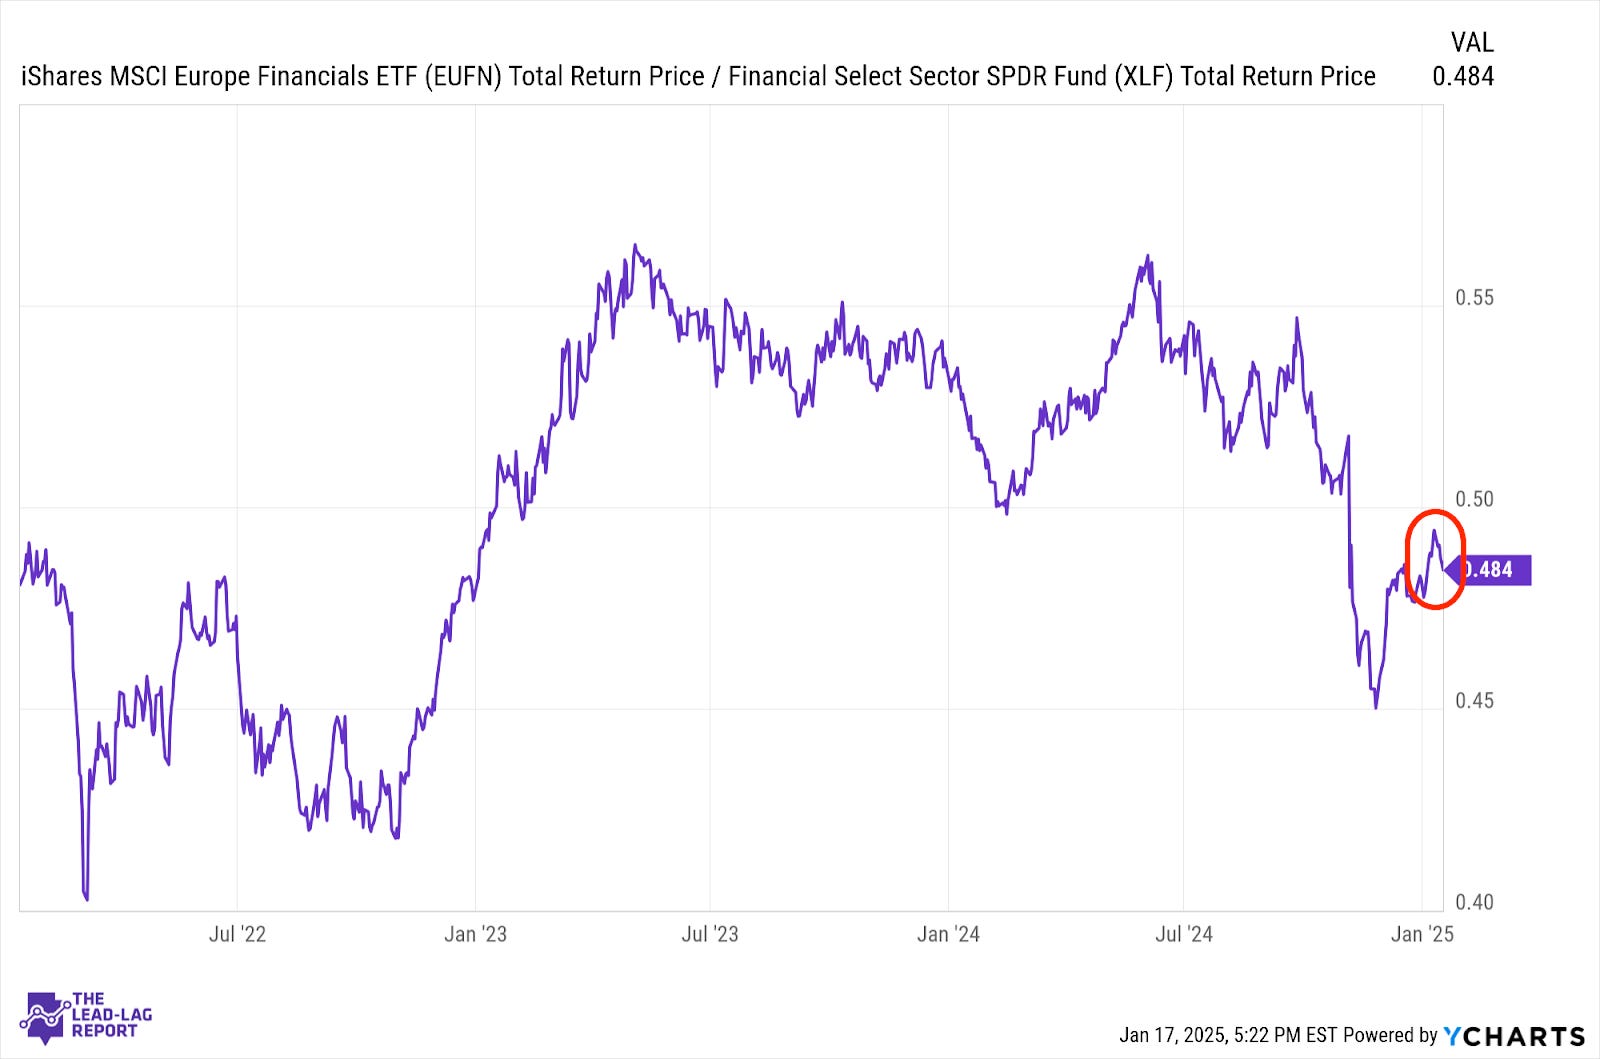
European financials remain quite volatile relative to their U.S. counterparts. That could be expected given how the U.S. economy still looks relatively healthy with little rate cut action expected, while Europe struggles to stay out of recession as the ECB cuts rates multiple times. Europe could easily outperform the U.S. if a rebound looks sustainable, but we still need to see firmer signs of that first.
Emerging Markets Debt (EMB) – Could Hang On For A While Longer As Peak Continues
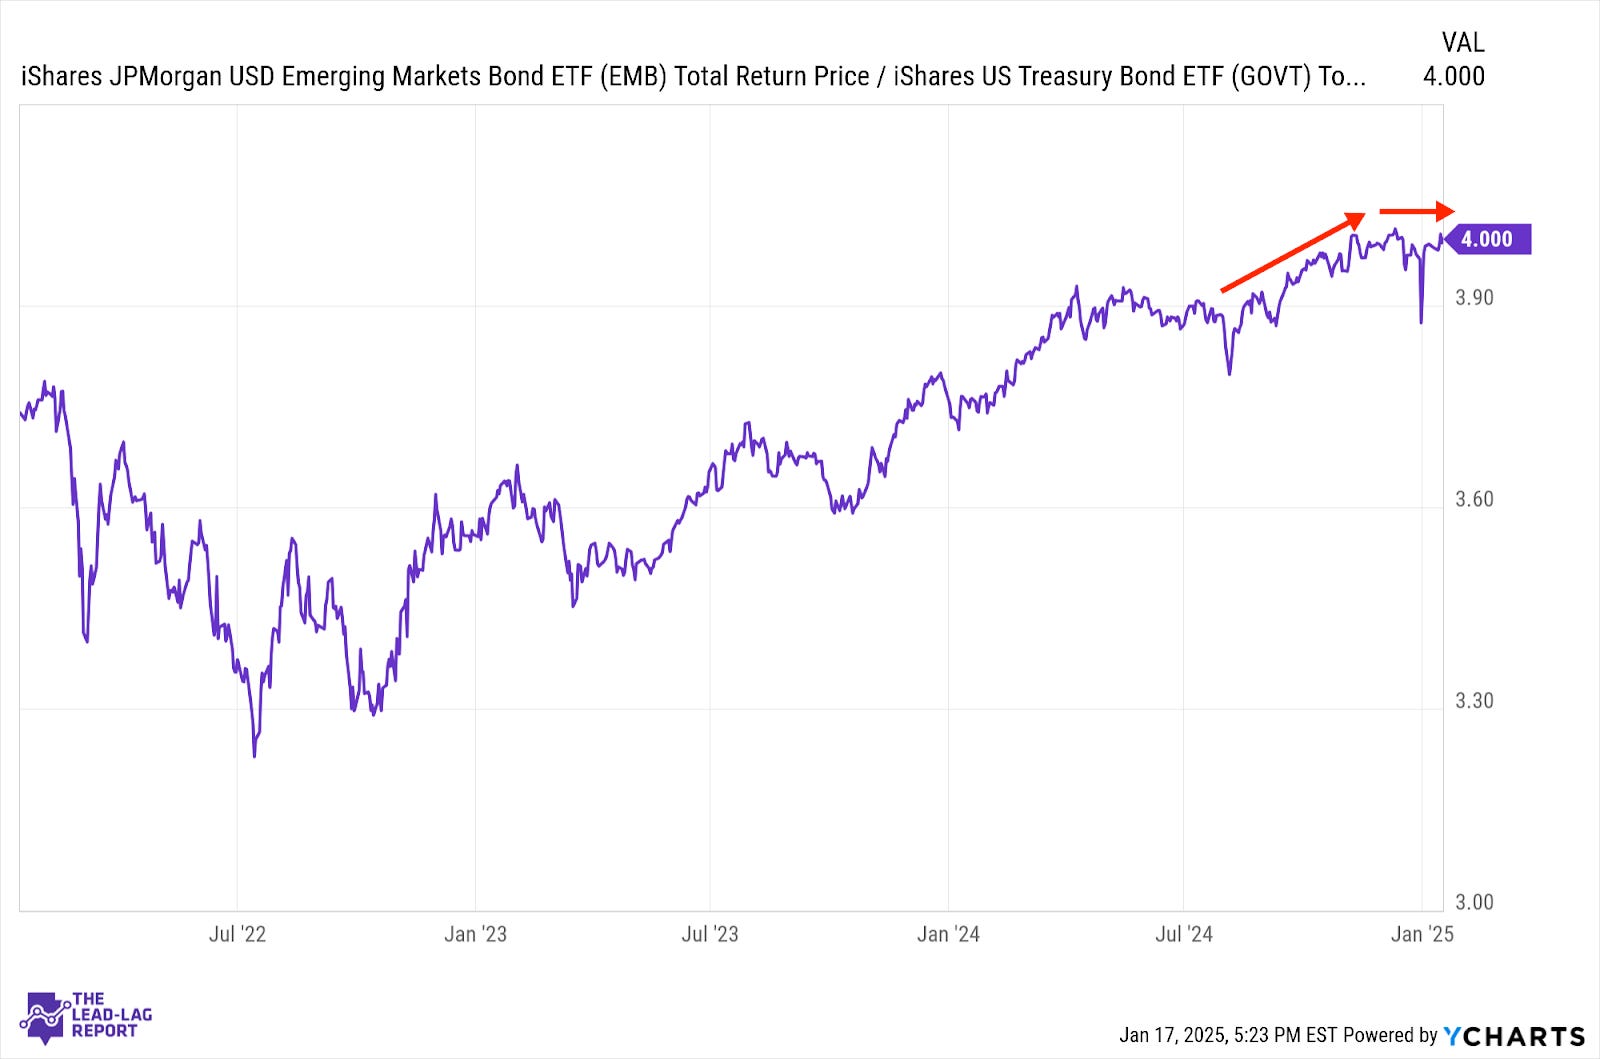
It looks like emerging markets are still in the process of topping out after years of outperforming Treasuries. Spreads, as mentioned under U.S. junk bonds, still remain surprisingly narrow and that could potentially keep EM debt looking good for a while longer. Still, I really don’t like the downside risk of any low-grade debt given how investors seem to be pricing in little, if any, credit risk right now.
Lumber (LUMBER) – The Quiet Rally
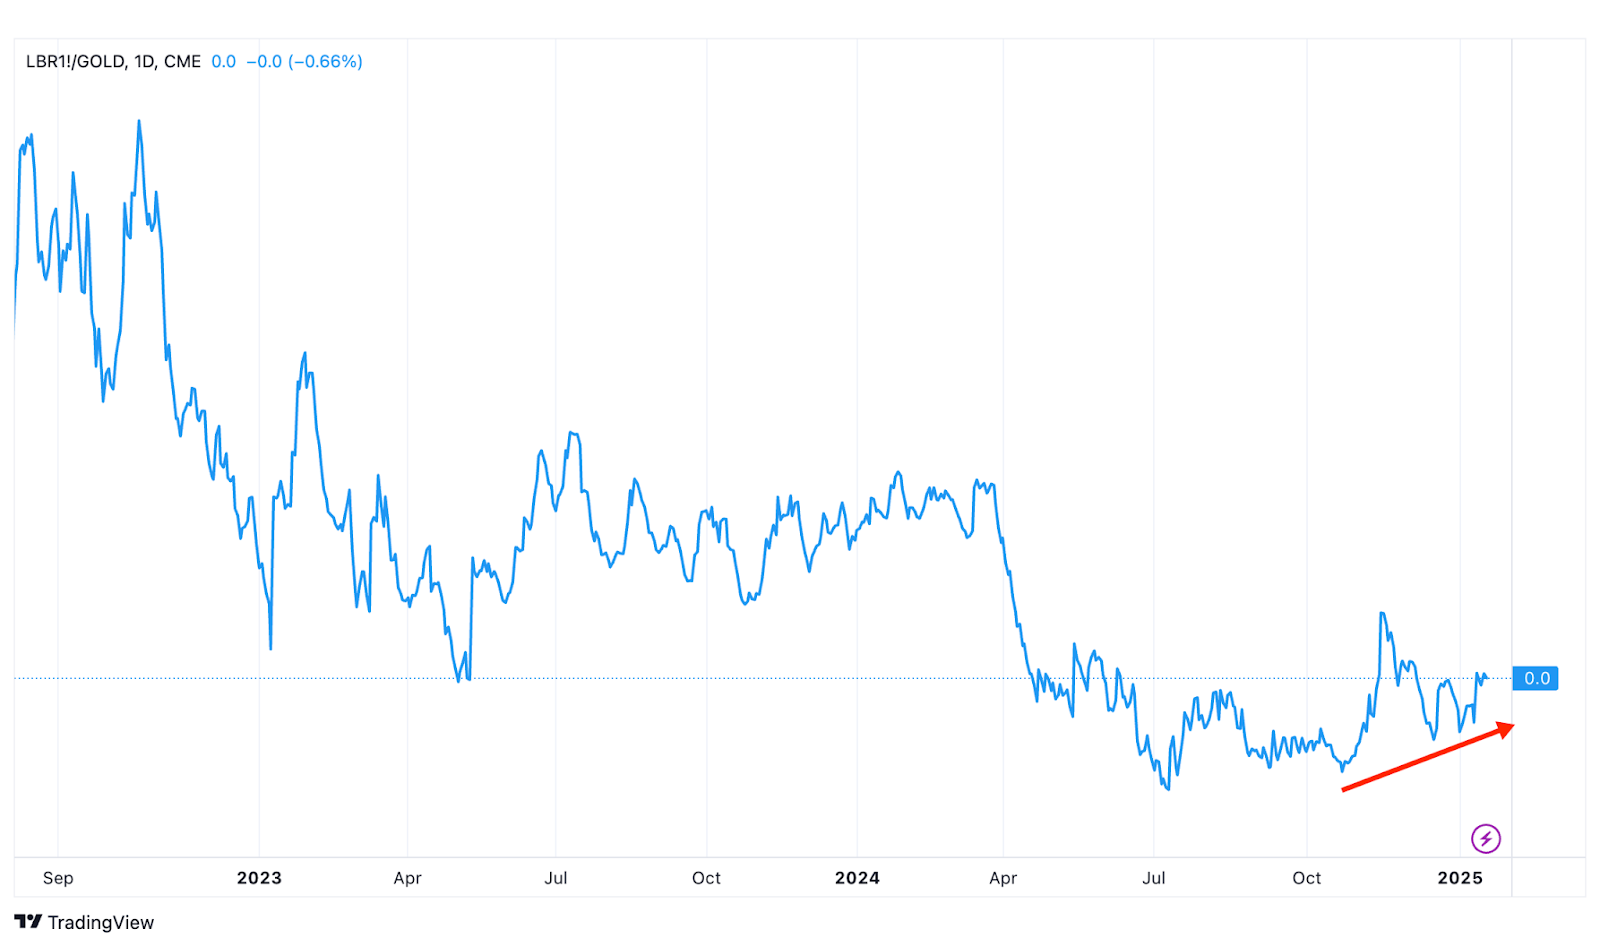
If you look back at the recent past, lumber prices have actually been in a relatively steady uptrend since August to the point where they’re within range of multi-year highs. Gold is still near its highs, but progress seems to have stalled out here. Even though the Fed will probably be on hold for the next six months, investors still appear to be feeling confident enough that they’re buying up economically-sensitive inputs.
U.S Dollar ($USD) – BoJ Rate Hike Could Create A Repeat
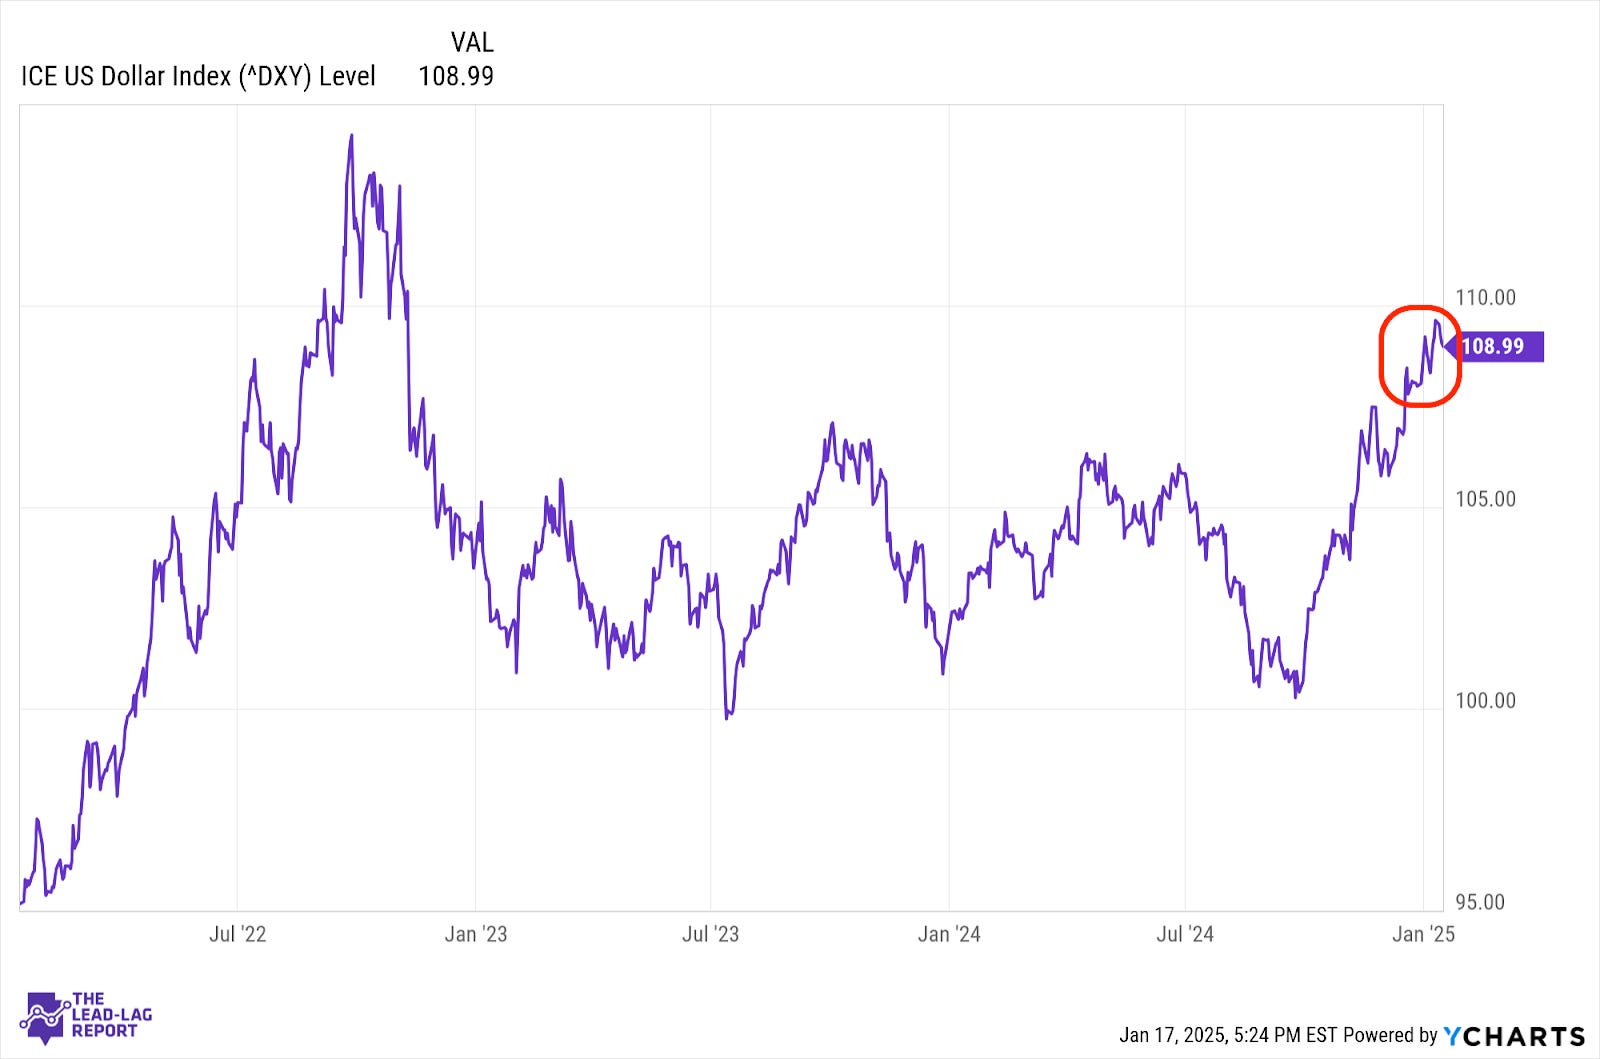
The dollar is still maintaining its strength relative to the basket of world currencies, but last week’s inflation report seems to have dulled the upward momentum just a bit. The real volatility in the forex market could come later this week. The market seems to be pricing in a greater possibility for a BoJ rate hike, but the markets got upended the last time the central bank raised rates. I don’t think a hike is fully priced in this time, which means more volatility could be coming soon.
LAGGARDS: TECH STOCKS STARING AT VALUATION CONTRACTIONS
Communication Services (XLC) – Valuation Risk
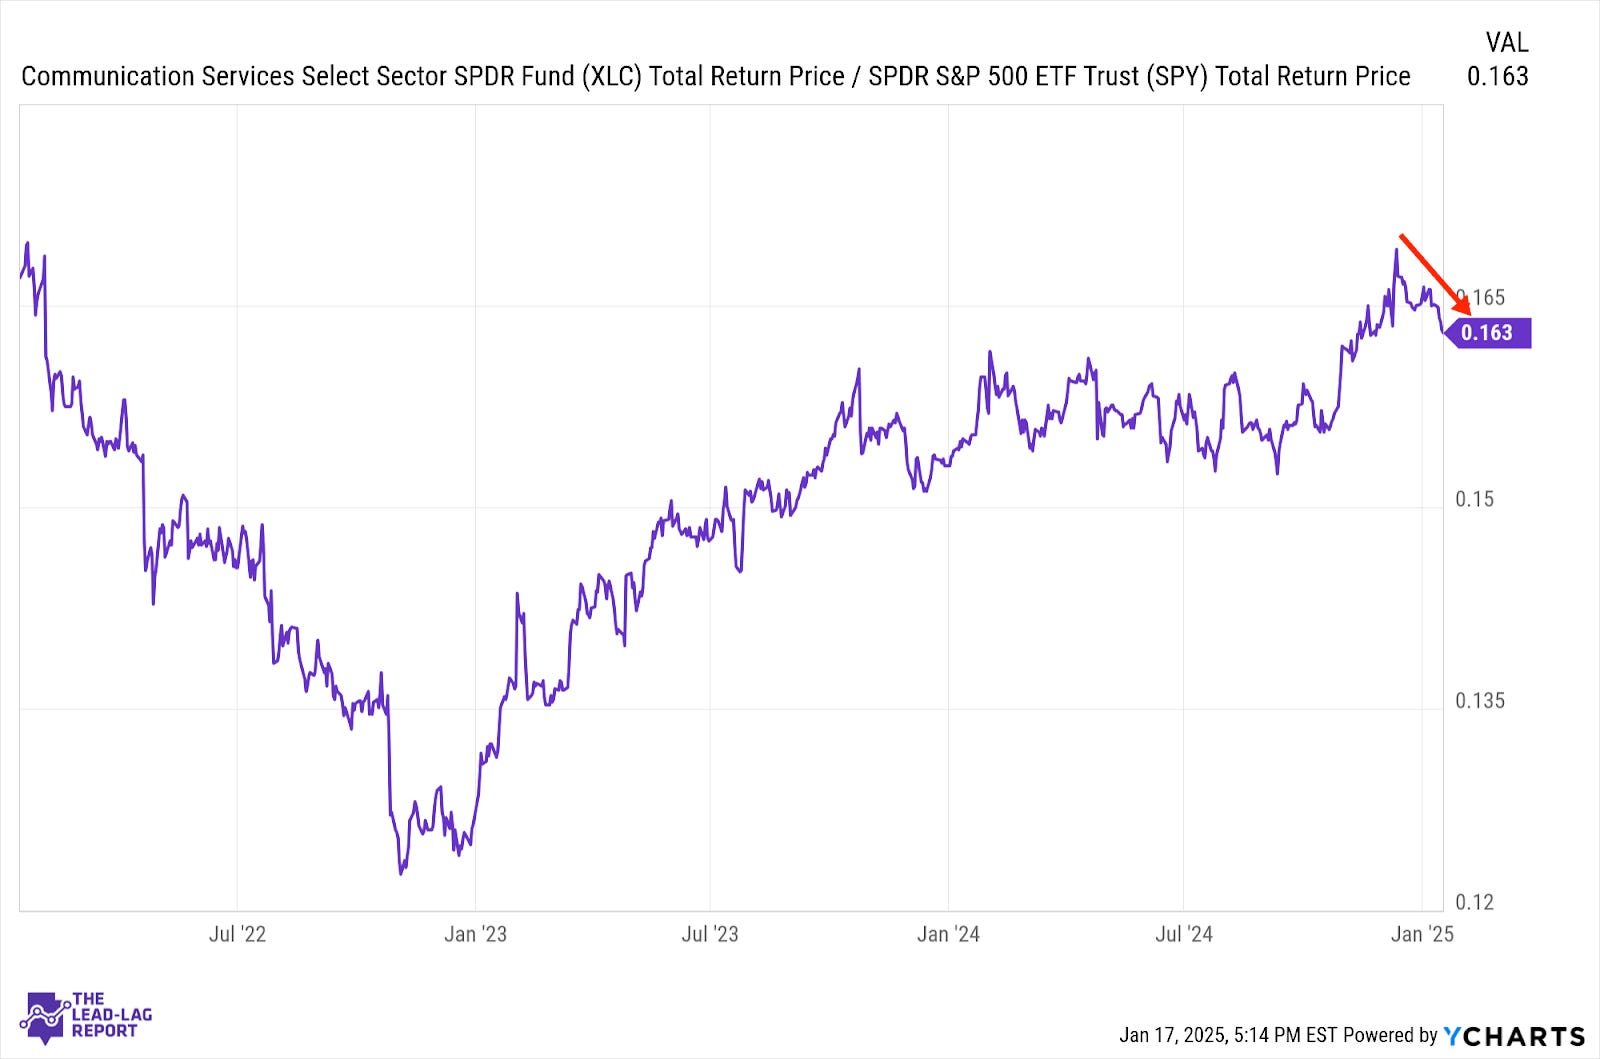
Growth stocks as a whole have gotten off to a relatively good start to 2025, but the traditional growth sectors, including this one, have struggled. The biggest risk at this point might be a valuation contraction from the magnificent 7 names. The growth trajectory of the U.S. economy still appears on track for now, but the pressures of inflation, credit risk, high interest rates and tariffs could derail the narrative.
Technology (XLK) – Out Of The Rotation
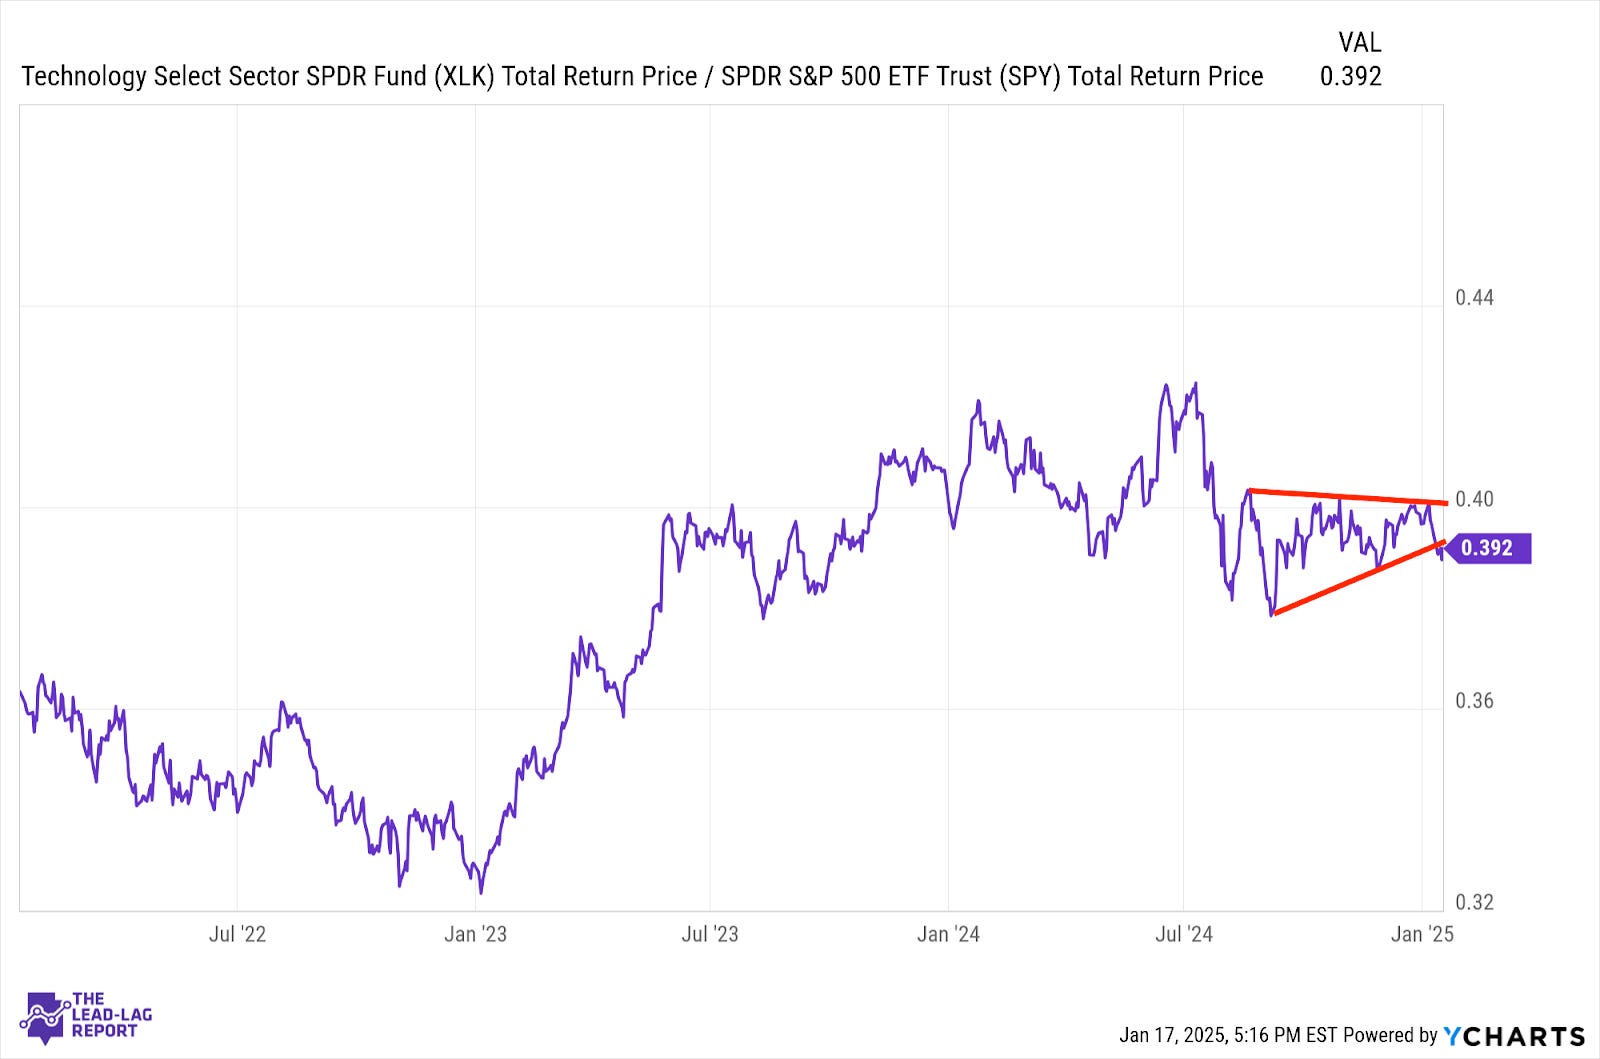
Tech has started slipping again and is struggling to pick up momentum again, even when the economy gets favorable inflation data. In the past several weeks, the market rotation has been between defensives and cyclicals. Growth has been getting somewhat left behind. The chart is looking like there might be a potential breakdown here, but the tech outlook could depend heavily on Trump policies over the next few months.
Consumer Discretionary (XLY) – A Lot Of Up And Down
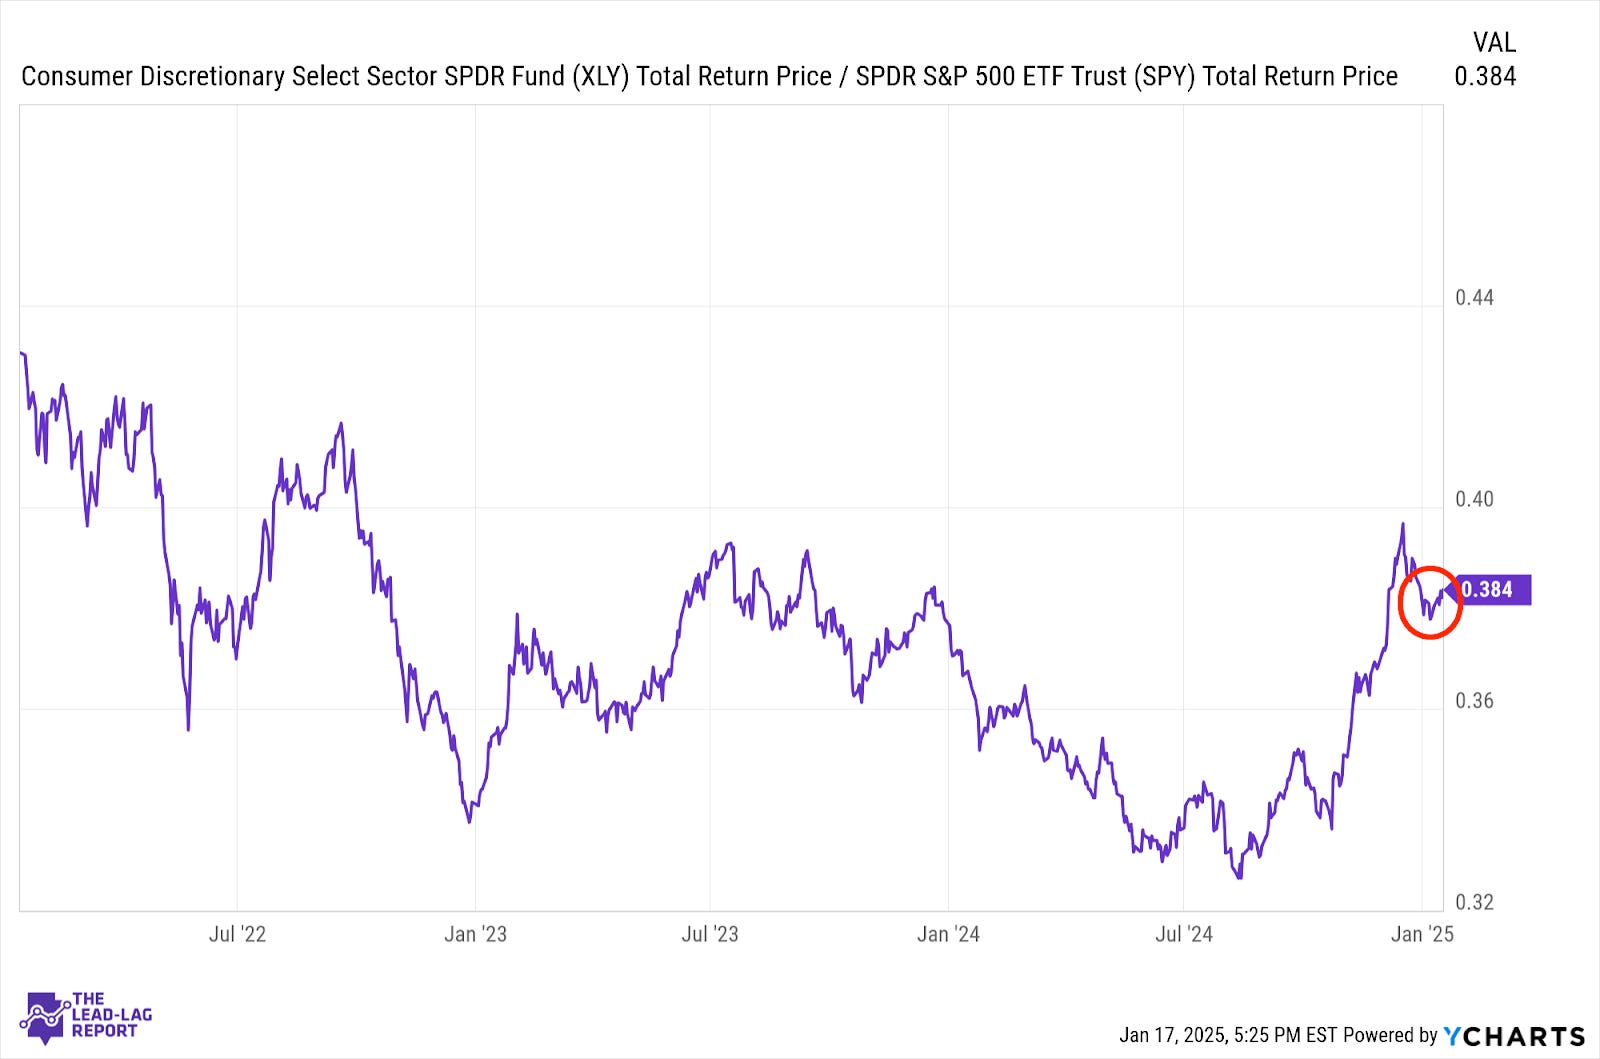
This sector has been all over the map in recent months. It excelled in the 2nd half of 2024 thanks to the resilient economy/lower rates narrative. It stepped back when the Fed pivoted to a more hawkish stance and rebounded thanks to a healthy holiday shopping season. The success of this sector still depends on the health of the consumer. Higher rates haven’t had a major impact yet and a tight labor market has certainly helped.
Consumer Staples (XLP) – Getting Shunned
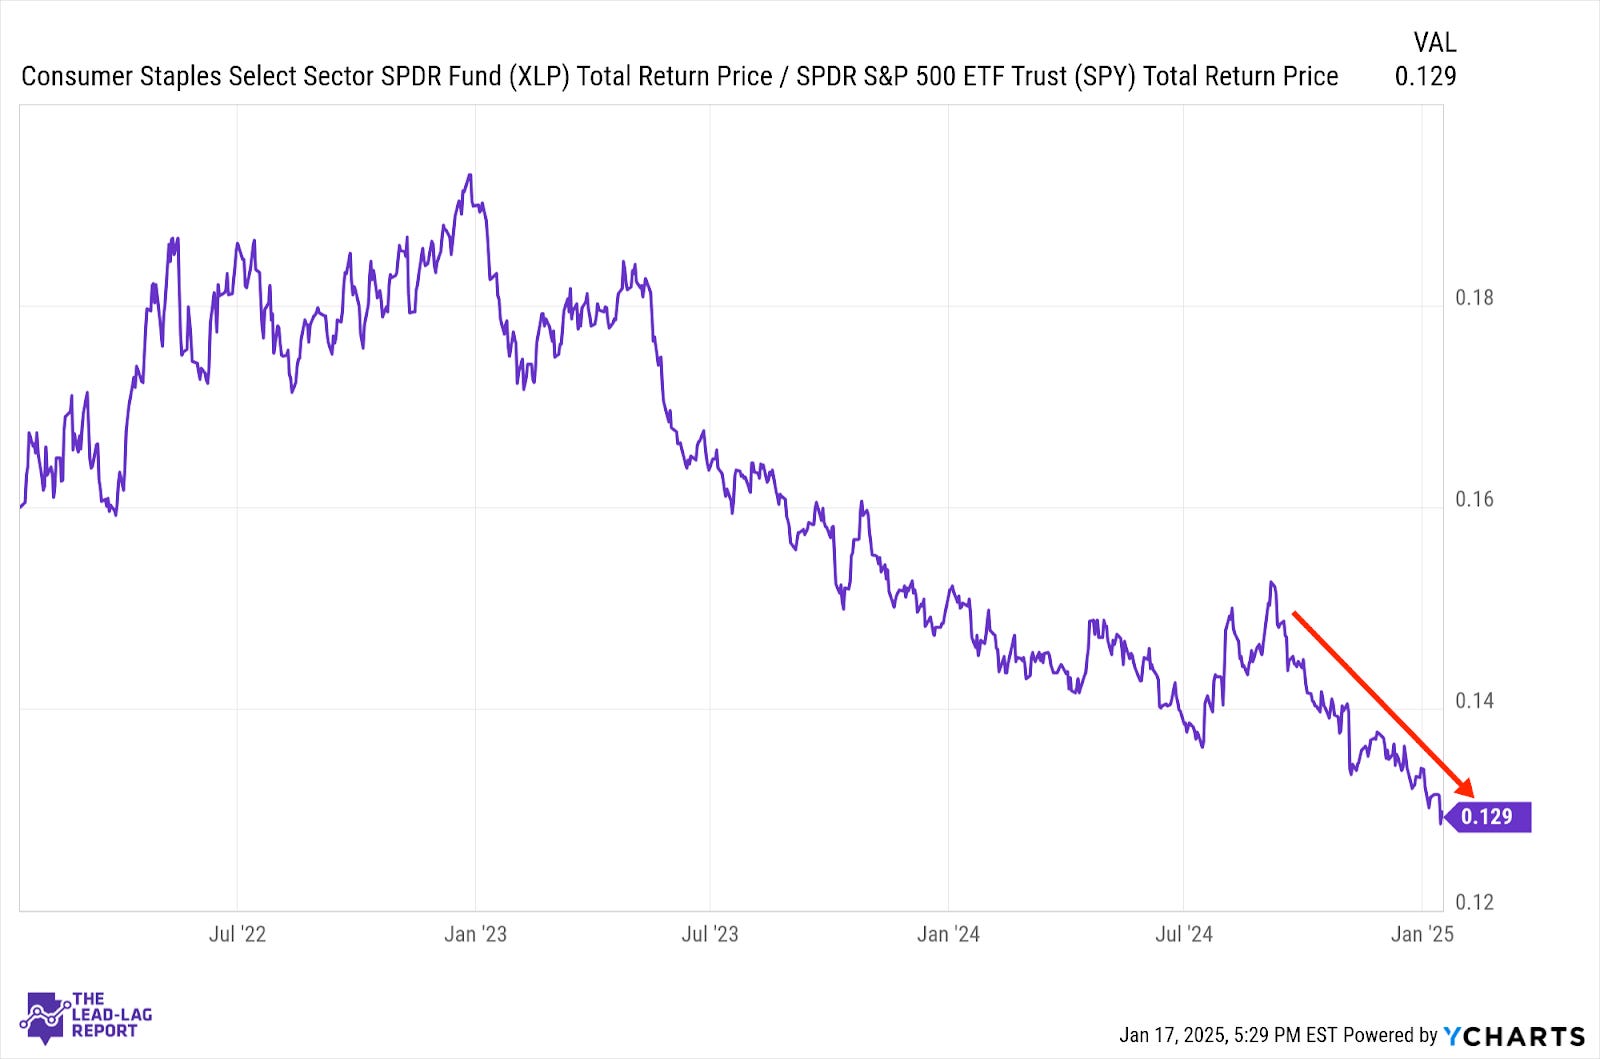
Staples continue to show little sign of life, getting kicked to the side during the cyclical rebound yet failing to participate when defensive issues were rebounding. I had thought this downtrend could have been a result of investors shunning retail stocks in general, but with discretionary improving in recent weeks, that may not be the case. Either way, there’s no risk-off indication being signaled here.
Real Estate (XLRE) – Still No Credit Risk Getting Priced In
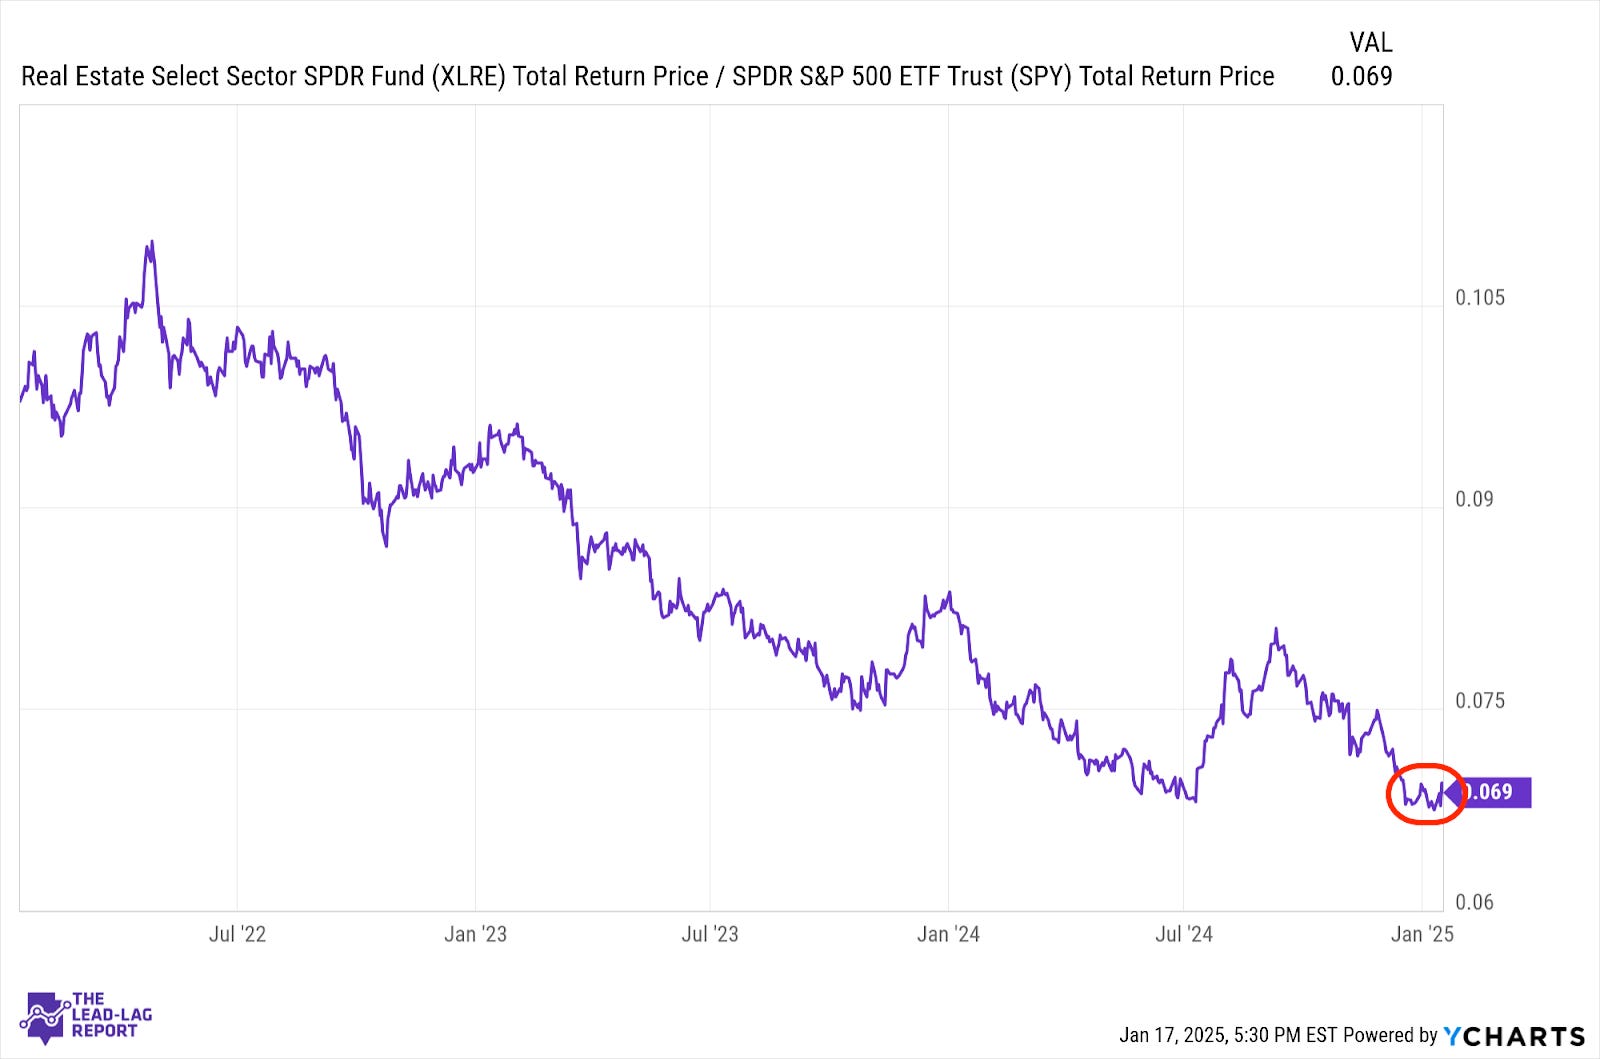
REITs have stabilized a bit here as the 10-year yield moves back down to late December levels. I think high yield spreads may be a decent proxy for real estate risk here. If investors are pricing little credit risk into junk bonds, they’re probably pricing little risk into the real estate market too. Most of the underperformance right now is related to interest rate movements. Once the market takes credit risk more seriously, I suspect there’s further downside risk.
Small-Caps (VSMAX) – Not Inspiring Confidence Yet
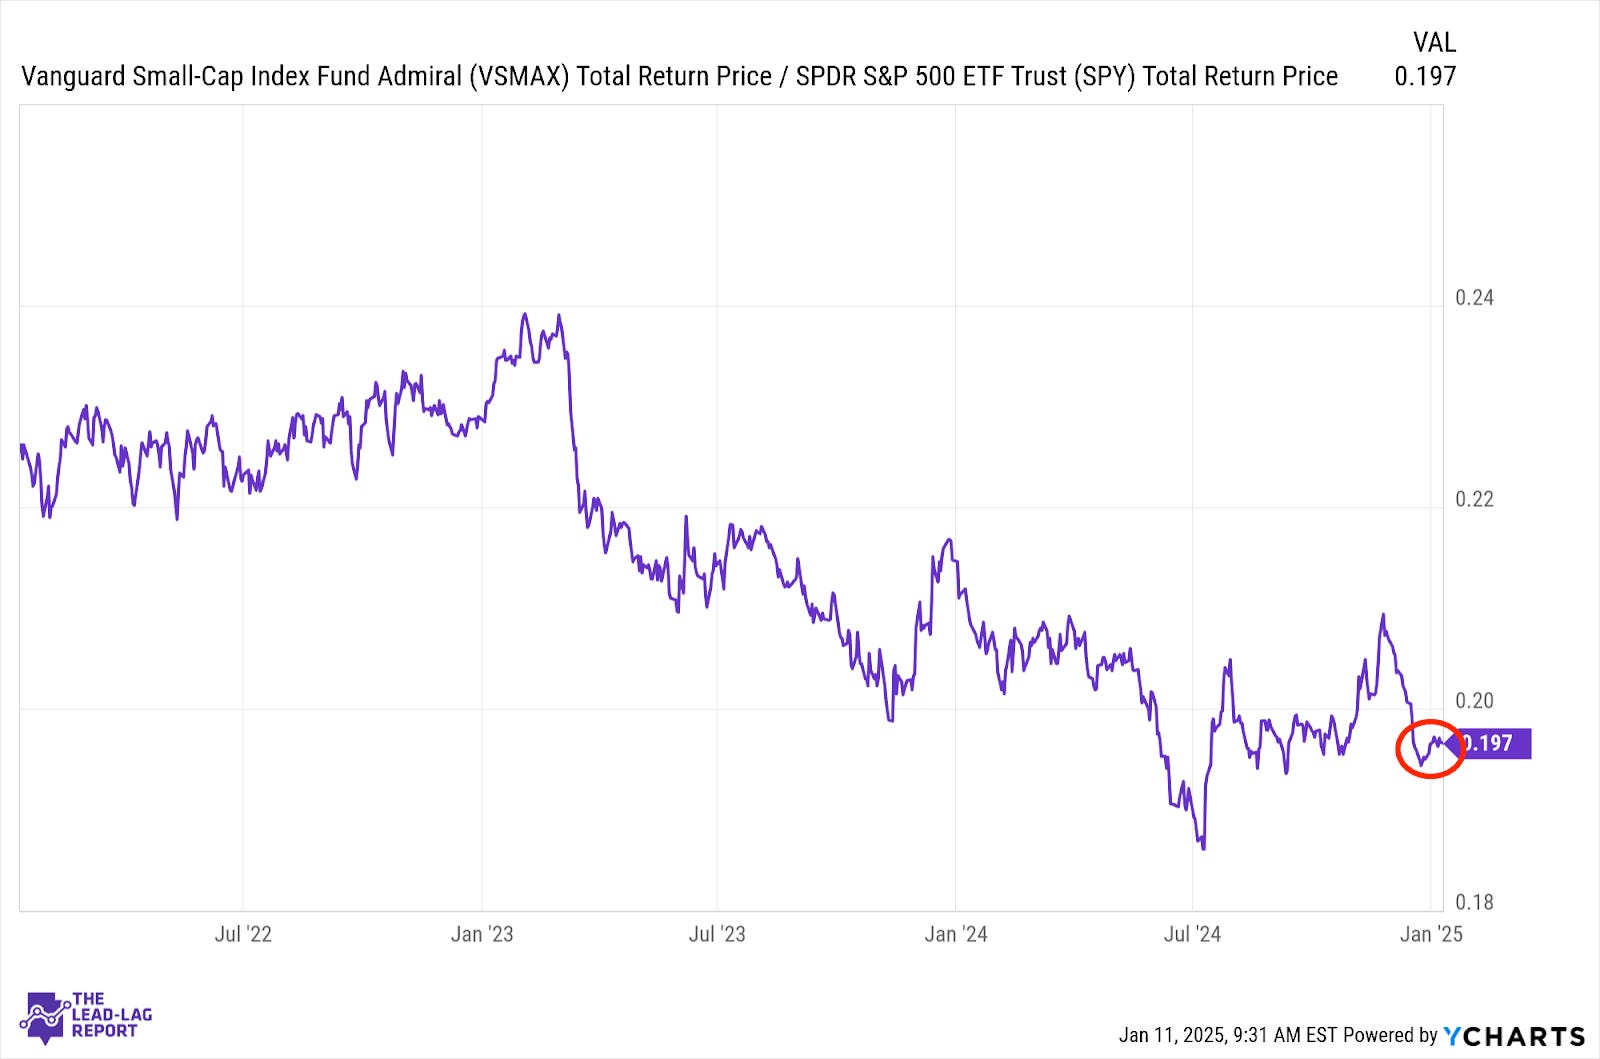
Small-caps got a nice little bounce last week, as would be expected in a cyclical revival, but not enough that it should inspire confidence about another leg higher for equities. Cyclicals are the best performing sectors of early 2025 so far, but small-caps are merely matching the S&P 500. I’ve said that small-caps hold the key and right now they’re not suggesting a great deal of confidence.
Dividend Stocks (SDY) – A Lack Of Consensus
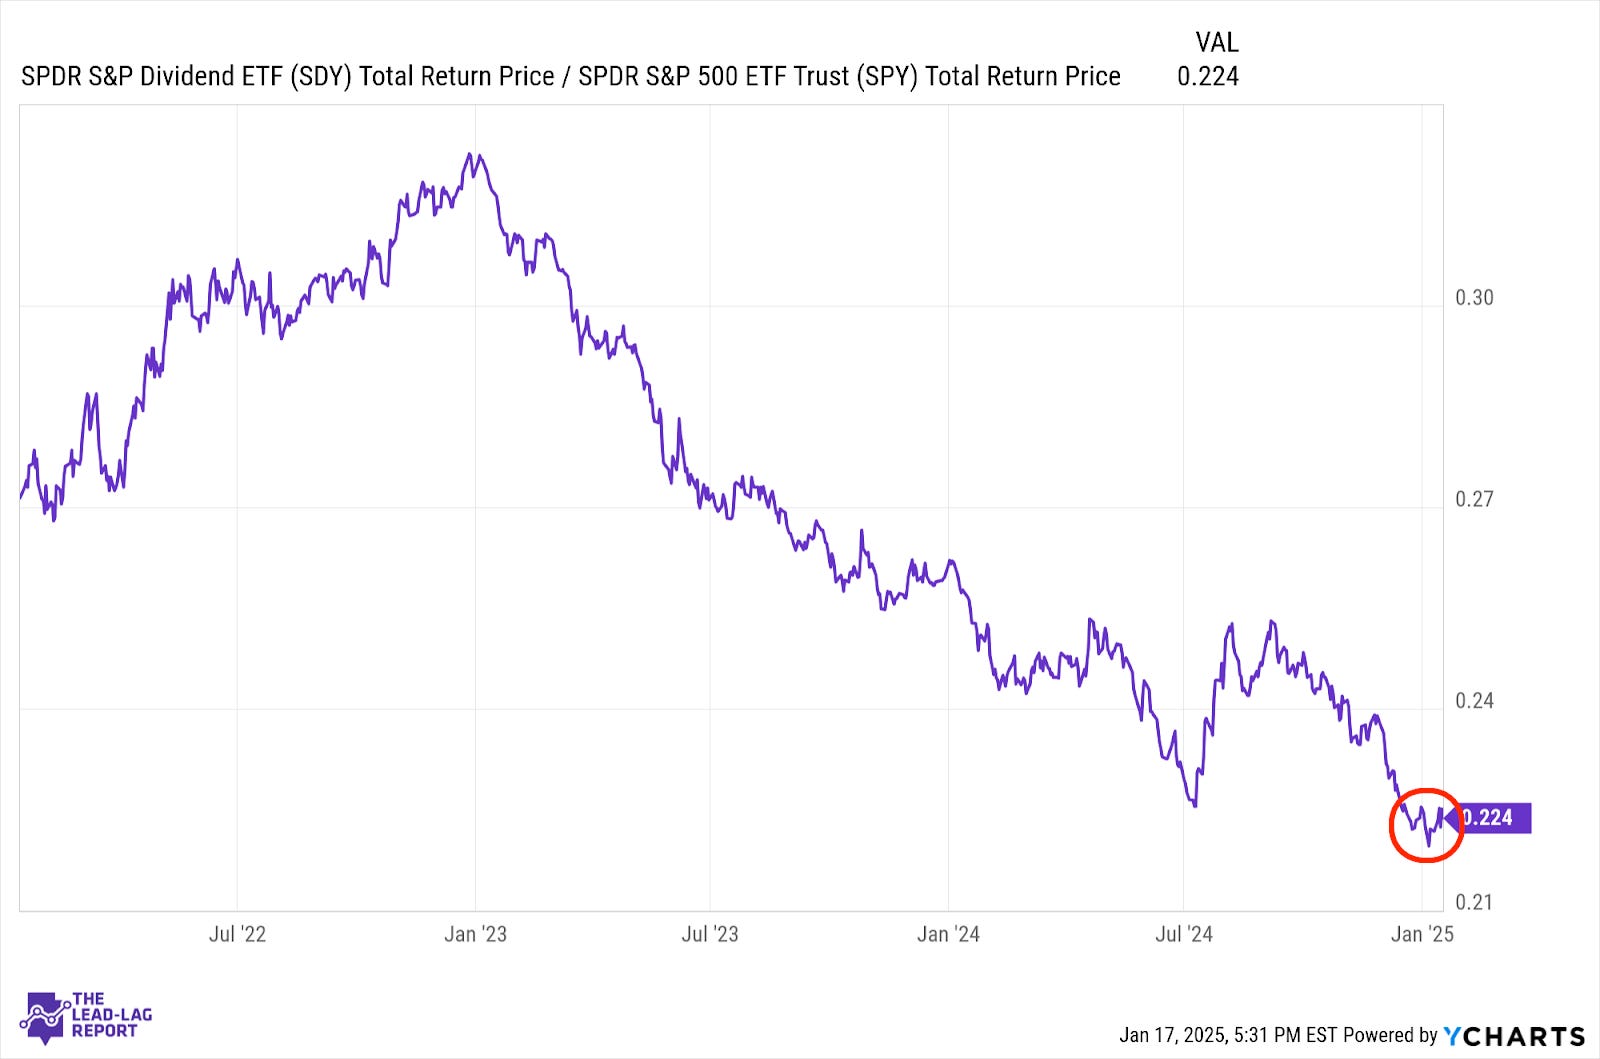
Dividend stocks have gotten off to a reasonable start to 2025, but there’s still no consensus signal within the group. High yielders have done comparatively better thanks to the recent rally in cyclicals, but dividend growth, which tends to consist more heavily of the traditionally defensive sectors, has lagged.
Bonds (GOVT) – Inflation Killing Potential
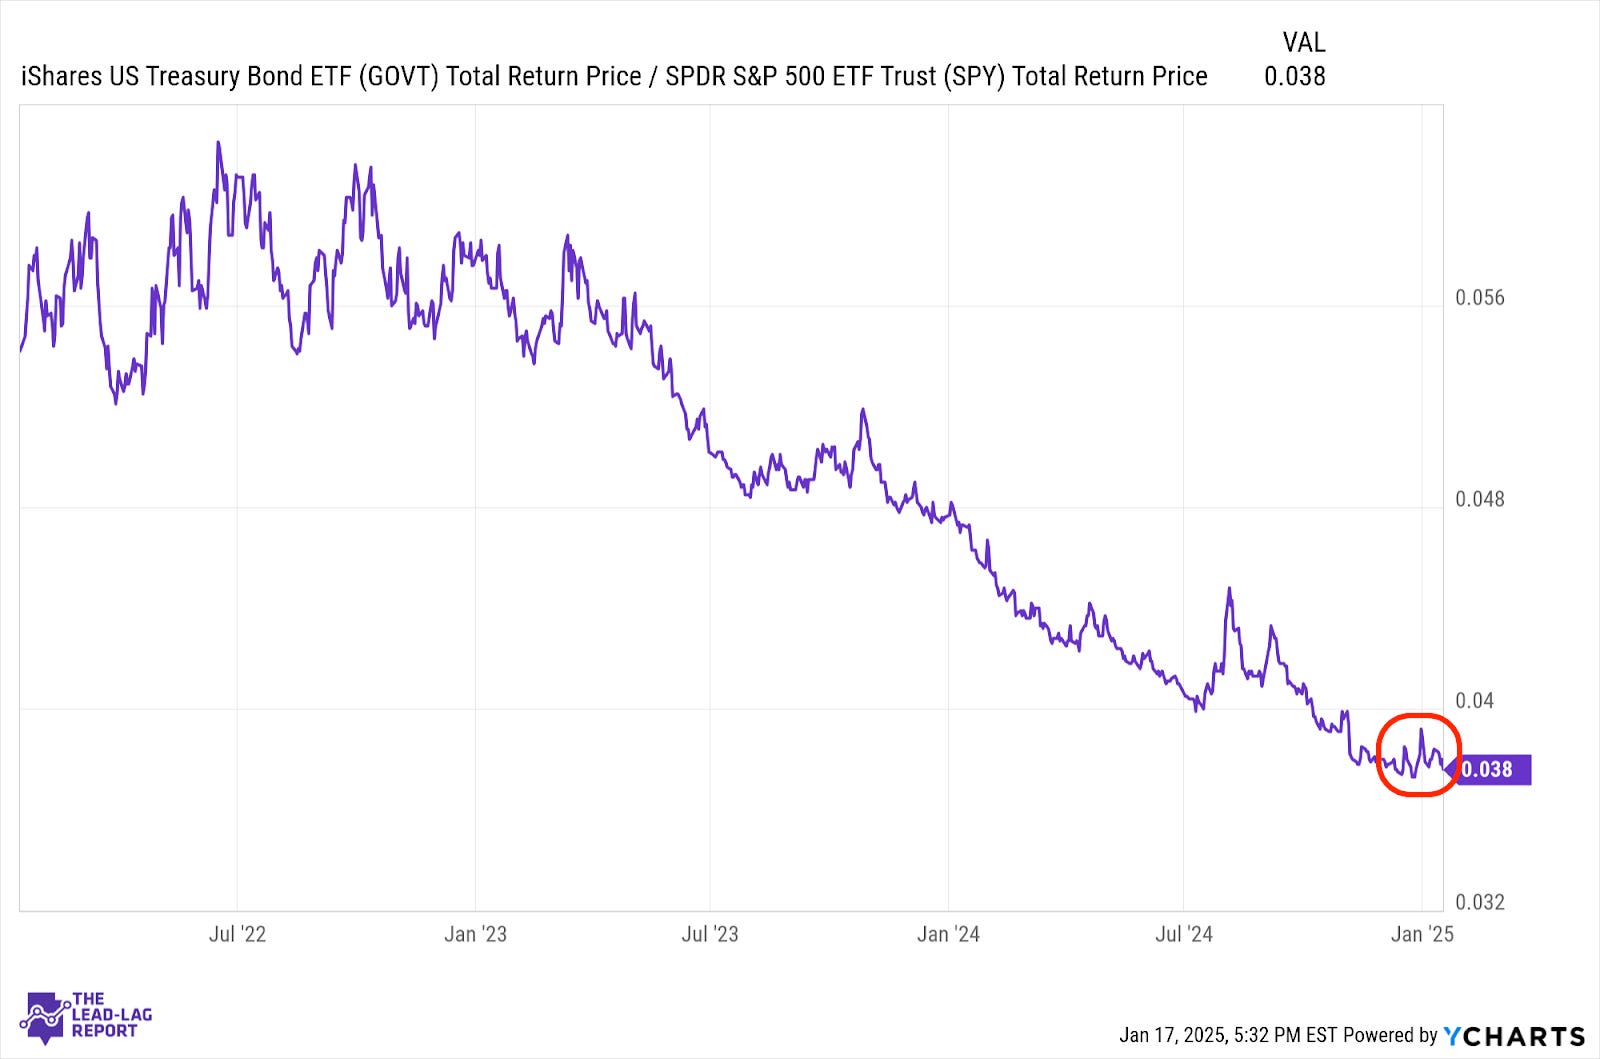
Treasuries have come down off of their peak thanks to last week’s inflation report, but they still remain quite elevated. The bond market is still mostly getting priced based on inflationary conditions and Fed policy forecasts. There’s still no indication right now that any kind of flight to safety pivot might be imminent. If inflation risk remains high, there may not be a lot of potential in long-term Treasuries for the time being.
Long Bonds (VLGSX) –The Catalyst For A Sharp Rise
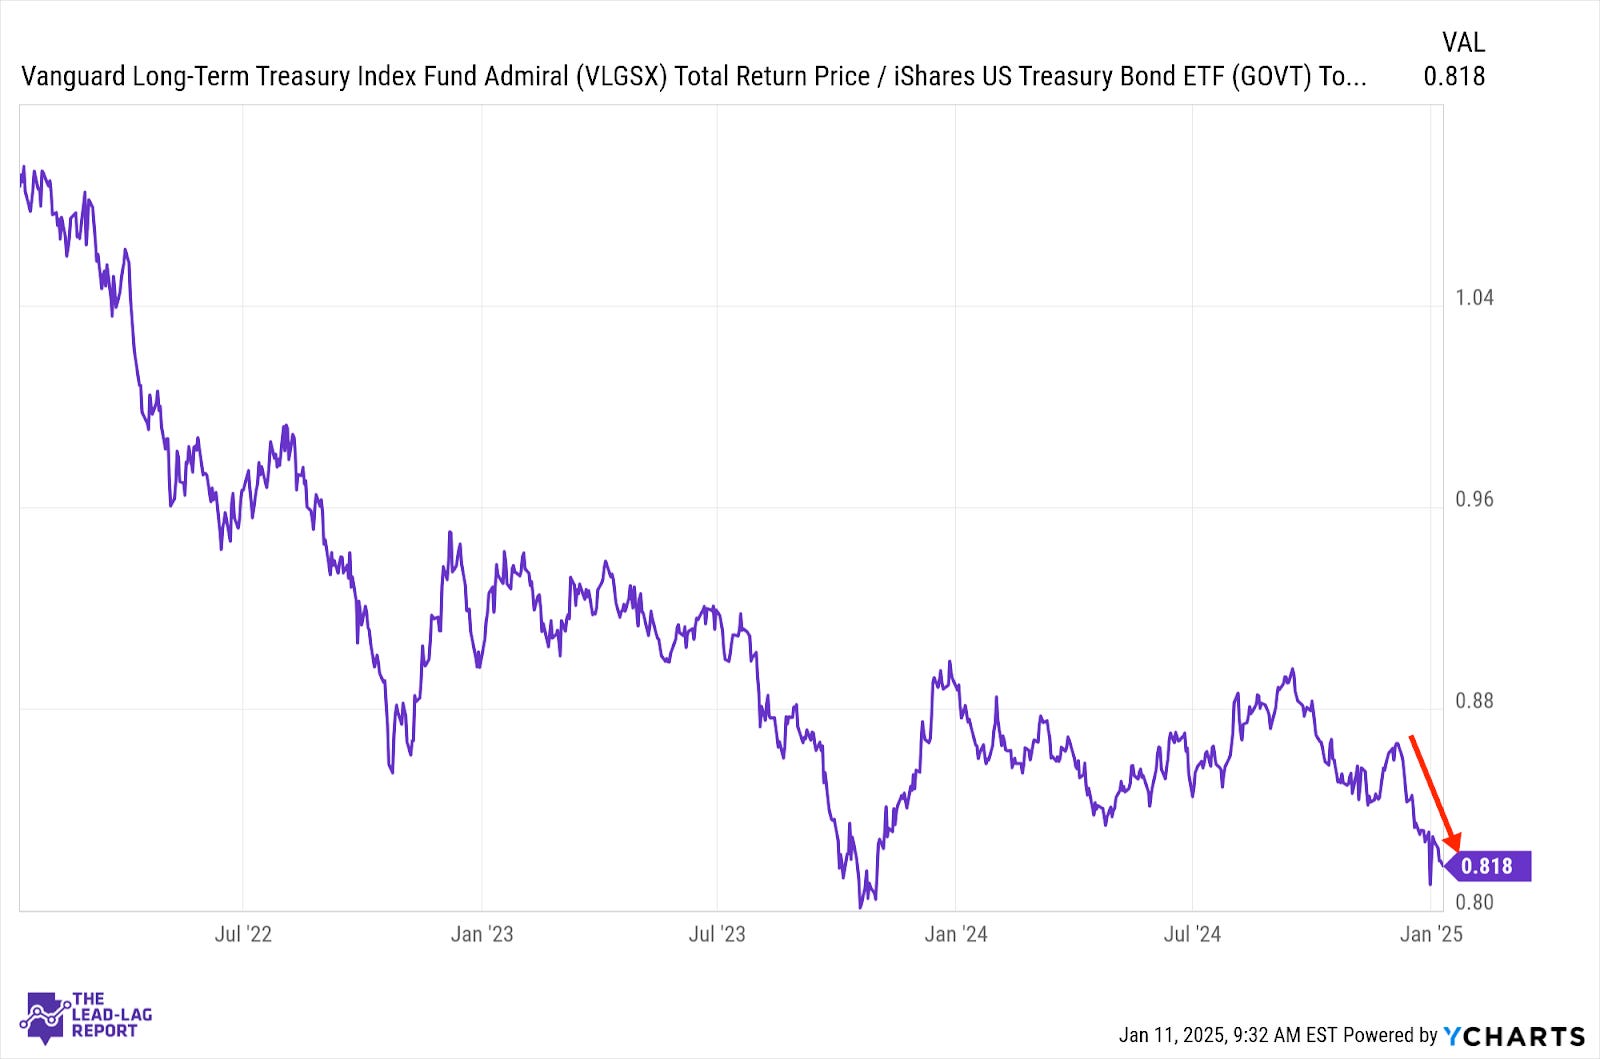
Long bonds continue to lag as inflation (even post-CPI report) is a threat and the Fed is unlikely to cut much over the next 12 months. As mentioned above, the bond market is demonstrating little concern about current credit risks, although they continue to be on the rise. This feels like a situation where once the market gets spooked and investors finally realize that the signs have been there for a while, this ratio shoots higher and quickly.
Europe, Australasia, and the Far East (EFA) – The BoJ Meeting Is Upon Us
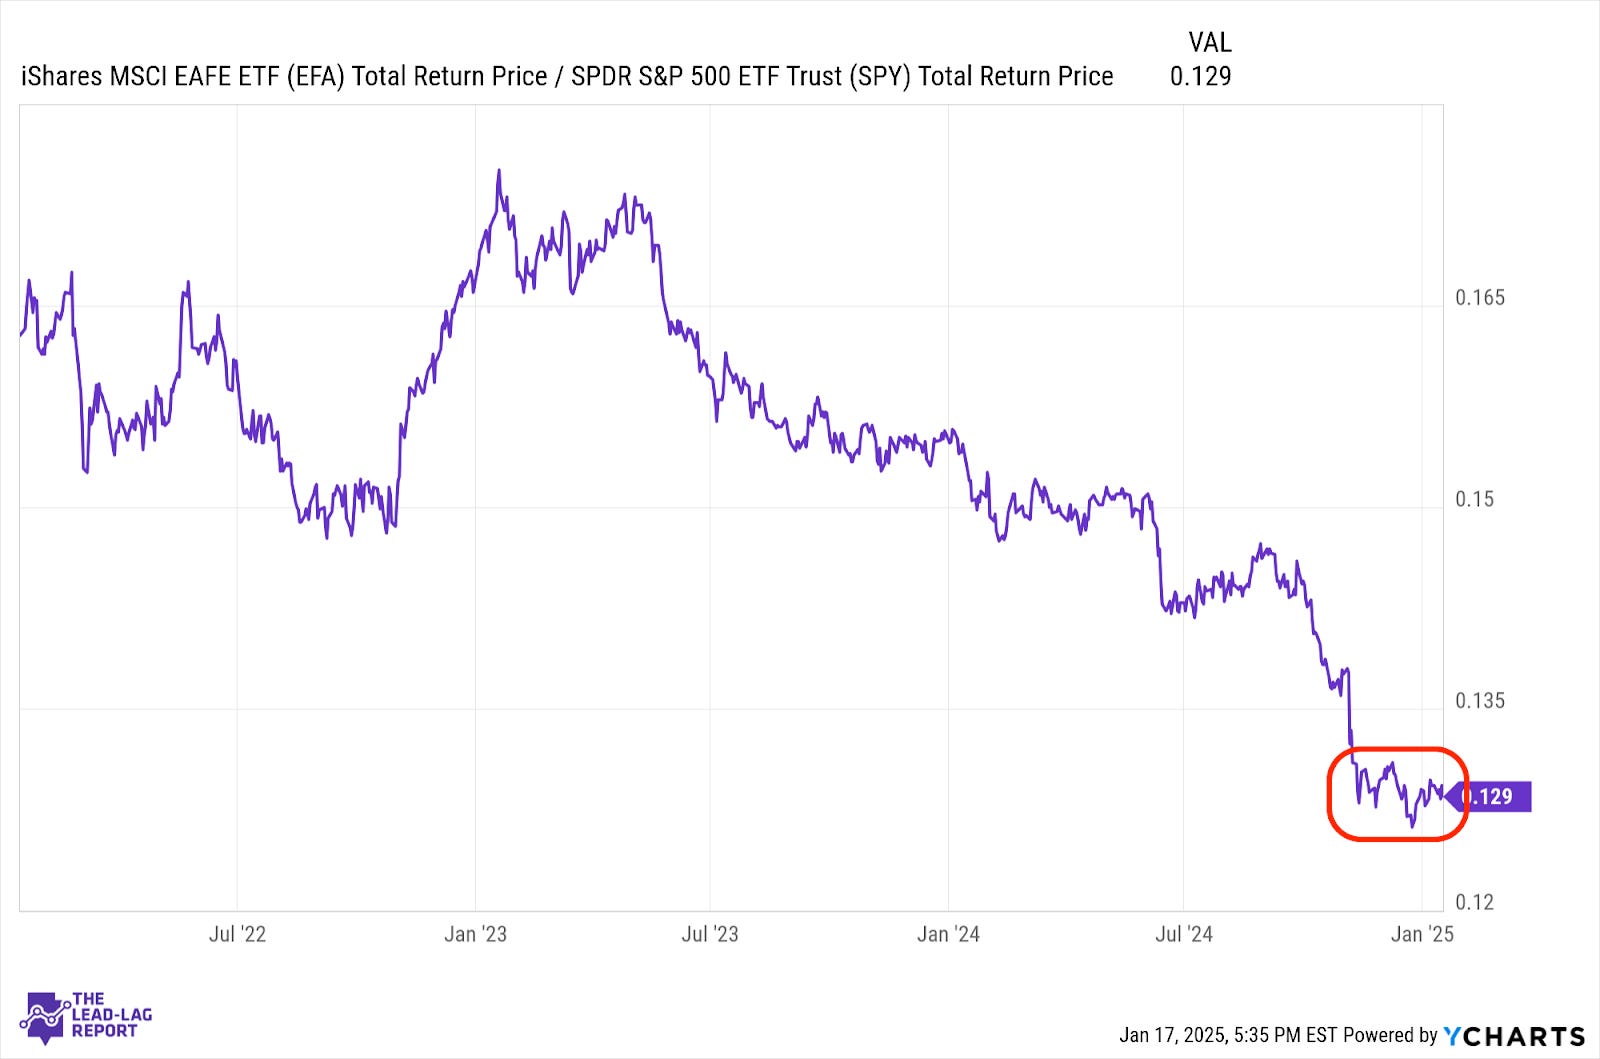
Foreign equities are at least keeping pace with the S&P 500, although there may not be a major case for moving overseas still. Europe is still a basket of mixed signals, but Japan is really the economy getting the spotlight this week. The BoJ decision this week should provide a jolt to both the yen and JGBs, but stocks might have a less clear path. I’d expect some extra volatility within this group over the next couple weeks.
Emerging Markets (EEM) – Risks Build
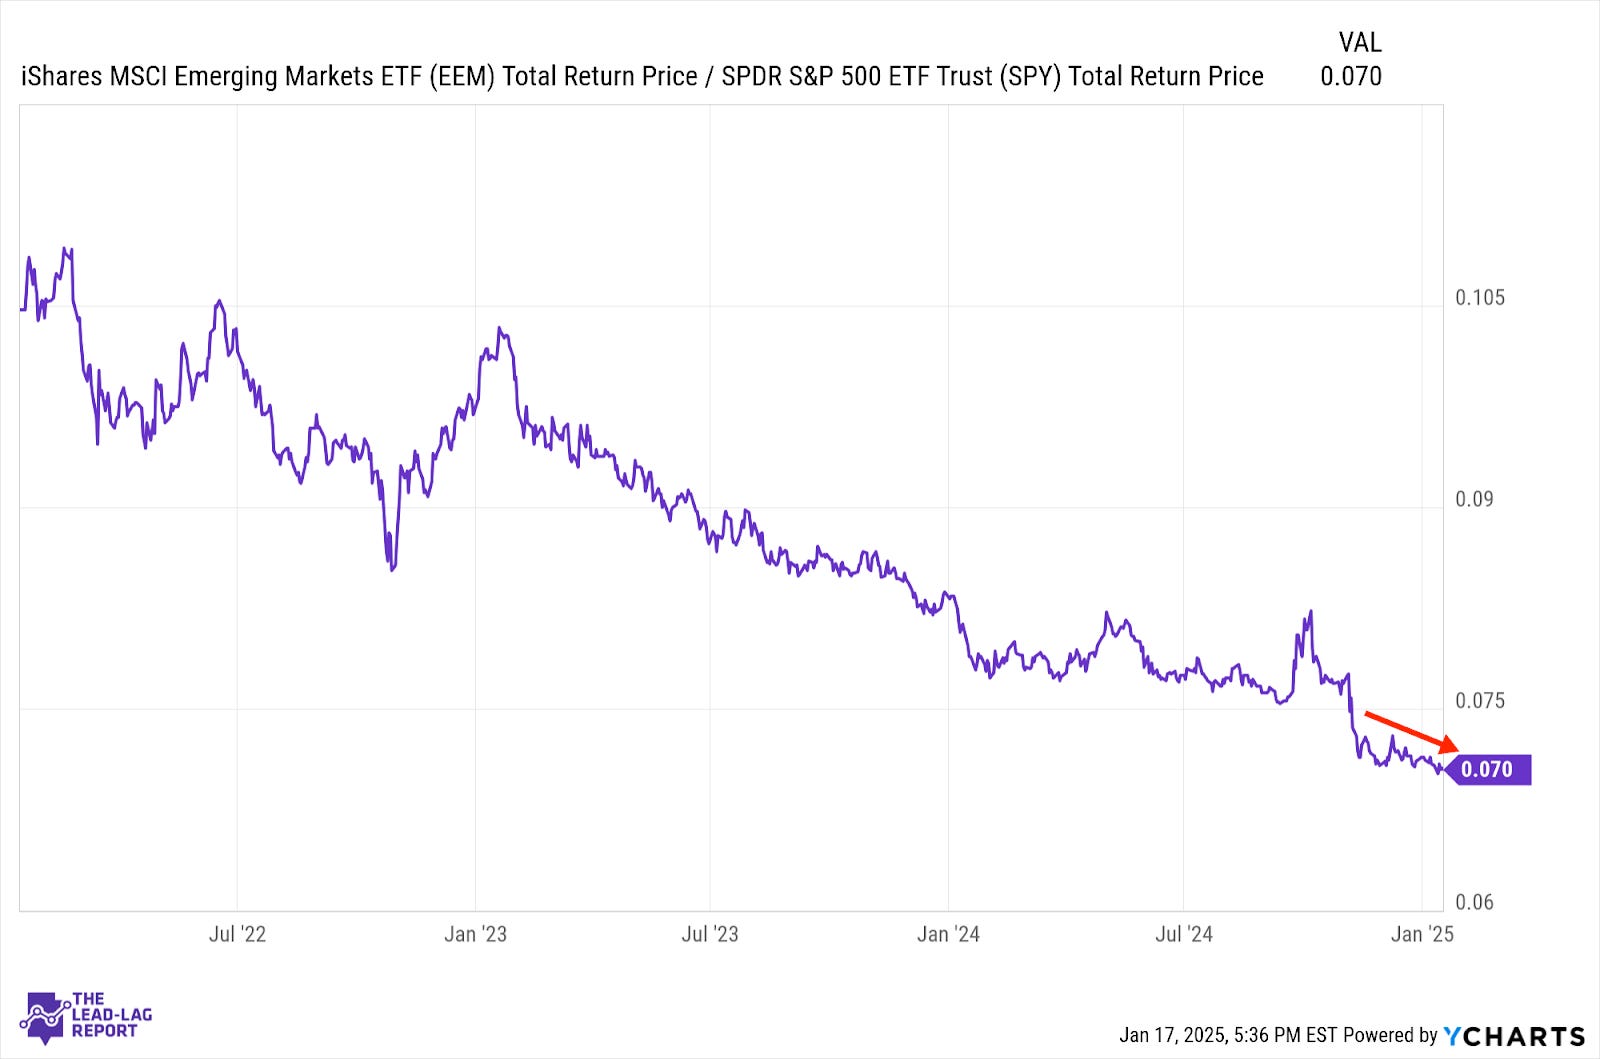
Even though developed markets may be keeping pace with U.S. stocks, emerging markets are not. India and China are still drags on the group with the latter of the two posing particular risks. TikTok may be back in the United States, but China will undoubtedly be in the crosshairs of U.S. trade policy while the country’s economy struggles to reverse itself.
The Lead-Lag Report is provided by Lead-Lag Publishing, LLC. All opinions and views mentioned in this report constitute our judgments as of the date of writing and are subject to change at any time. Information within this material is not intended to be used as a primary basis for investment decisions and should also not be construed as advice meeting the particular investment needs of any individual investor. Trading signals produced by the Lead-Lag Report are independent of other services provided by Lead-Lag Publishing, LLC or its affiliates, and positioning of accounts under their management may differ. Please remember that investing involves risk, including loss of principal, and past performance may not be indicative of future results. Lead-Lag Publishing, LLC, its members, officers, directors and employees expressly disclaim all liability in respect to actions taken based on any or all of the information on this writing.