
Curve Re-Steepening, Calm Spreads, and the Credit Rotation Trap (JOJO)

KEY HIGHLIGHTS
- BB high-yield risk premia remain compressed: **BB OAS was ~1.77% (Apr 20)**, near the bottom end of its post-2020 range.[1]
- Equity volatility is not flashing “crisis,” but it also isn’t asleep: **VIX closed ~18.87 (Apr 20)** after spending much of April in the high-teens.[2]
- The yield curve has been quietly re-normalizing: **10Y–2Y spread is ~+0.5% in mid/late April**, reflecting a market that is less inverted and more cyclical in its rate expectations.[3]
- Fund flows suggest risk appetite is selective: **High Yield Bond ETFs saw roughly -$5.4B of net outflows in March (First Trust)**—a reminder that investors can de-risk even while spreads look calm.[4]
*The easiest time to get lulled into the wrong credit bet is precisely when everything looks “fine.” This week, I see a familiar setup: spreads still complacent, volatility contained, and a curve that’s quietly re-steepening—conditions that often precede a regime shift where timing and rotation matter more than “set it and forget it.”*
THE SETUP: CALM MARKETS ARE WHEN CREDIT SIGNALS MATTER MOST
Most investors associate credit risk with obvious stress—spreads blowing out, VIX spiking, and headlines dominated by defaults. But in my experience, the more dangerous phase is often earlier: when spreads are tight, correlations are low, and “carry” looks like free money.
In that environment, positioning becomes crowded. Investors reach for yield because the last drawdown is far enough in the rear-view mirror that the market starts treating volatility as a temporary nuisance rather than a cycle signal.
That’s why I focus on intermarket relationships—especially the link between stock volatility and credit spreads. When volatility rises, financing conditions tighten and the marginal borrower gets repriced first. The problem is that spreads usually react *after* the market’s early-warning signals have already shifted.
Today’s market is a good example. BB spreads are still compressed, and VIX is not screaming danger. Yet the curve has re-steepened and flows have been less enthusiastic than the headline level of spreads might imply. That mismatch is often where rotation adds value.
WHAT THE CURVE IS TELLING YOU (AND WHY IT MATTERS FOR CREDIT)
A positive 10Y–2Y spread isn’t automatically bullish or bearish—but it is information. After long periods where investors anchored on inversion as a “recession clock,” a re-steepening curve can reflect several different regimes:
1) The market thinks the Fed is closer to easing than tightening.
2) The market thinks growth will hold up and term premia should rise.
3) The market is repricing inflation uncertainty.
For credit investors, the key is that all three regimes can produce **higher volatility**—even if spreads don’t widen right away. If the curve’s re-steepening is driven by growth optimism, credit can remain resilient *until* equity volatility forces a risk-parity and CTA-style deleveraging wave. If it’s driven by inflation uncertainty, the “higher for longer” narrative can hit duration and then spill over into risk assets.
In other words: a re-steepening curve is often a sign of **transition**. Transitions are exactly when static allocations are most exposed to timing risk.
CHART 1: BB HIGH-YIELD SPREADS REMAIN COMPRESSED
(See Chart 1: BB High Yield Option-Adjusted Spread)
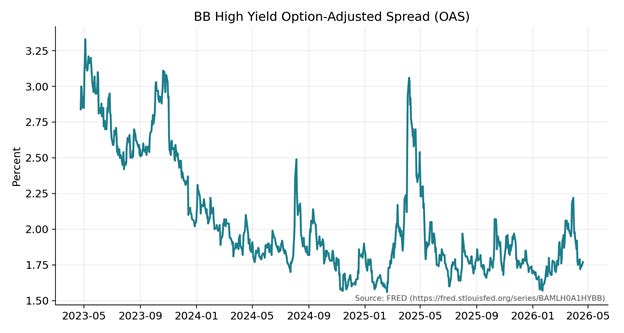
Even without a blowout, it doesn’t take a large move in spreads to hurt total return—especially when carry is modest and duration is non-trivial. When spreads are tight, the distribution of outcomes is asymmetric: there’s less room for further compression, and more room for expansion.
CHART 2: VOLATILITY IS CONTAINED—BUT NOT “DEAD”
(See Chart 2: VIX)
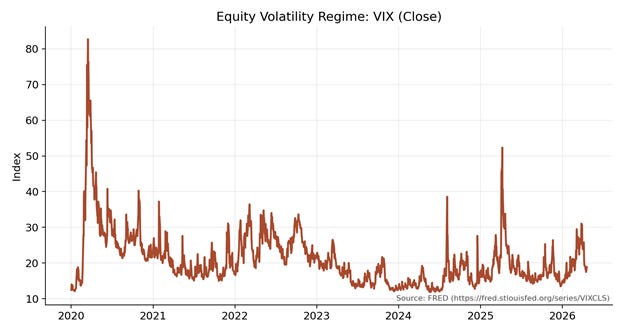
A VIX in the high teens is consistent with calm markets—but it also means the market is only a few shocks away from a volatility regime change. I have long argued that investors underappreciate how quickly volatility can jump from “fine” to “problem” when positioning is crowded and liquidity thins.
The reason this matters for credit is simple: equity volatility tends to lead credit volatility. When stocks become unstable, credit investors begin to demand a higher risk premium, and spreads expand.
CHART 3: 10Y–2Y IS POSITIVE—A SIGN OF REGIME NORMALIZATION
(See Chart 3: 10Y Minus 2Y)
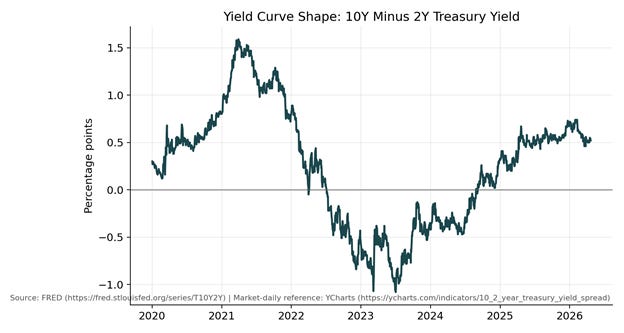
A positive spread isn’t a green light by itself. But it tells you the market has moved away from an “inversion equals inevitability” mindset toward a more cyclical repricing of rate expectations. That shift often increases cross-asset sensitivity, because macro narratives compete: growth vs. inflation vs. policy.
FLOWS: A SUBTLE WARNING THAT “RISK-ON” IS NOT UNLIMITED
One of the more under-discussed realities in bond markets is that flows can deteriorate quietly before price action reacts. In April’s ETF flow monitor, First Trust highlighted **net outflows from High Yield Bond ETFs in March**.[4]
Flows are not a perfect timing tool. But they *are* a sentiment and positioning tool. If investors are withdrawing from high yield even while spreads are tight, it suggests that risk appetite is becoming more selective. That is exactly the kind of backdrop where a rules-based rotation process can outperform ad-hoc discretion.
WHY JOJO EXISTS: ROTATION BETWEEN CREDIT RISK AND DEFENSIVE DURATION
This brings me to **ATAC Credit Rotation ETF (Ticker: JOJO)**.
JOJO is built around a simple premise: credit regimes change, and investors should not be forced to guess exactly when the shift happens. The Fund rotates between high yield exposure and long-duration Treasury exposure based on the behavior of the Utilities sector relative to the S&P 500.
Utilities are often treated as a boring defensive equity sector. But that’s precisely why they can be informative. When Utilities start outperforming the broad market, it can be a sign that the market is rotating toward defense beneath the surface—often *before* credit spreads widen.
In my work, I’ve repeatedly seen that defensive equity leadership can foreshadow rising volatility. And because there is a strong relationship between volatility and spreads, that early signal can be the difference between being paid to take credit risk and being punished for it.
To be clear: this is not a promise of avoiding every drawdown. Rotation can lag and whipsaw, especially around turning points. But I would rather accept the occasional whipsaw than accept the much larger risk of being fully committed to credit during a true volatility regime shift.
HOW I’D FRAME THE NEXT FEW WEEKS
I see three plausible paths from here:
1) **Soft-landing continuation:** spreads stay tight, VIX stays contained, and carry works. In this regime, credit risk can still pay—but investors should recognize the asymmetry when spreads are already compressed.
2) **Inflation re-pricing:** rates volatility rises, equities wobble, and credit spreads respond late. This is when “it came out of nowhere” headlines appear—because the warning signs were intermarket, not in spreads.
3) **Growth scare:** defensives lead, volatility rises, and the market begins to price a more meaningful slowdown. In that case, long Treasuries can provide ballast even if high yield begins to struggle.
The point is not to forecast which path will dominate. The point is to have a process that adapts as the cycle rotates.
CONCLUSION: THE “CARRY TRAP” IS A TIMING PROBLEM
When spreads are tight, investors tend to focus on the income stream and ignore the embedded short-vol nature of credit. That’s the carry trap.
I ask you to consider that the real edge in credit is not collecting yield in good times. It’s avoiding the regimes where volatility rises and spreads widen fast.
JOJO is designed for that problem—because it treats credit exposure as something to rotate, not something to marry.
**Michael A. Gayed, CFA**
ENDNOTES
[1] Federal Reserve Bank of St. Louis, “ICE BofA BB US High Yield Index Option-Adjusted Spread (BAMLH0A1HYBB),” FRED, accessed April 22, 2026, https://fred.stlouisfed.org/series/BAMLH0A1HYBB
[2] Federal Reserve Bank of St. Louis, “CBOE Volatility Index: VIX (VIXCLS),” FRED, accessed April 22, 2026, https://fred.stlouisfed.org/series/VIXCLS
[3] YCharts, “10-2 Year Treasury Yield Spread (Market Daily),” accessed April 22, 2026, https://ycharts.com/indicators/10_2_year_treasury_yield_spread
[4] First Trust, “ETFs Data Watch: Asset Flows Monitor April 2026 Edition,” accessed April 22, 2026, https://www.ftportfolios.com/Commentary/Insights/2026/4/8/asset-flows-monitor-april-2026-edition
DISCLOSURES (JOJO)
Junk debt, also known as high-yield bonds or speculative-grade debt, refers to fixed-income securities issued by companies or governments with lower credit ratings, offering higher interest rates to compensate investors for the elevated risk of default.
The VIX index, often called the “fear gauge” of Wall Street, is a real-time market index that measures the market’s expectation of 30-day forward-looking volatility derived from S&P 500 index options prices, serving as a key barometer of investor sentiment and market risk.
The ICE BofA BB US High Yield Index Option-Adjusted Spread measures the yield differential between BB-rated corporate bonds and a spot Treasury curve, quantifying the risk premium for below-investment-grade debt with a BB rating in the US market.
As with all ETFs, Fund shares may be bought and sold in the secondary market at market prices. The market price normally should approximate the Fund’s net asset value per share (NAV), but the market price sometimes may be higher or lower than the NAV. The Fund is new with a limited operating history. There are a limited number of financial institutions authorized to buy and sell shares directly with the Fund, and there may be a limited number of other liquidity providers in the marketplace. There is no assurance that Fund shares will trade at any volume, or at all, on any stock exchange. Low trading activity may result in shares trading at a material discount to NAV.
Because the Fund invests in Underlying ETFs an investor will indirectly bear the principal risks of the Underlying ETFs, including but not limited to, risks associated with investments in ETFs, equity securities, growth stocks, large and small capitalization companies, non-diversification, fixed income investments, derivatives and leverage. The prices of fixed income securities may be affected by changes in interest rates, the creditworthiness and financial strength of the issuer and other factors. An increase in prevailing interest rates typically causes the value of existing fixed income securities to fall and often has a greater impact on longer duration and/or higher quality fixed income securities. The Fund will bear its share of the fees and expenses of the underlying funds. Shareholders will pay higher expenses than would be the case if making direct investments in the underlying funds.
Because the Fund expects to change its exposure as frequently as each week based on short-term price performance information, (i) the Fund’s exposure may be affected by significant market movements at or near the end of such short-term periods that are not predictive of such asset’s performance for subsequent periods and (ii) changes to the Fund’s exposure may lag a significant change in an asset’s direction (up or down) if such changes first take effect at or near a weekend. Such lags between an asset’s performance and changes to the Fund’s exposure may result in significant underperformance relative to the broader equity or fixed income market. Because the Adviser determines the exposure for the Fund based on the price movements of gold and lumber, the Fund is exposed to the risk that such assets or their relative price movements fail to accurately predict future performance.
Past performance is no guarantee of future results.
The Fund’s investment objectives, risks, charges, expenses and other information are described in the statutory or summary prospectus, which must be read and considered carefully before investing. You may download the statutory or summary prospectus or obtain a hard copy by calling 855-ATACFUND or visiting www.atacfunds.com. Please read the Prospectuses carefully before you invest.
Investing involves risk including the possible loss of principal.
JOJO is distributed by Foreside Fund Services, LLC.
Learn more about $JOJO at https://atacfunds.com/jojo/ Lead-Lag Publishing, LLC is not an affiliate of Tidal/Toroso or ACA/Foreside.