

Below is an assessment of the performance of some of the most important sectors and asset classes relative to each other with an interpretation of what underlying market dynamics may be signaling about the future direction of risk-taking by investors. The below charts are all price ratios which show the underlying trend of the numerator relative to the denominator. A rising price ratio means the numerator is outperforming (up more/down less) the denominator. A falling price ratio means underperformance.
LEADERS: IT’S ALL ABOUT THOSE RATE CUTS
Technology (XLK) – The Rate Cut Tailwind
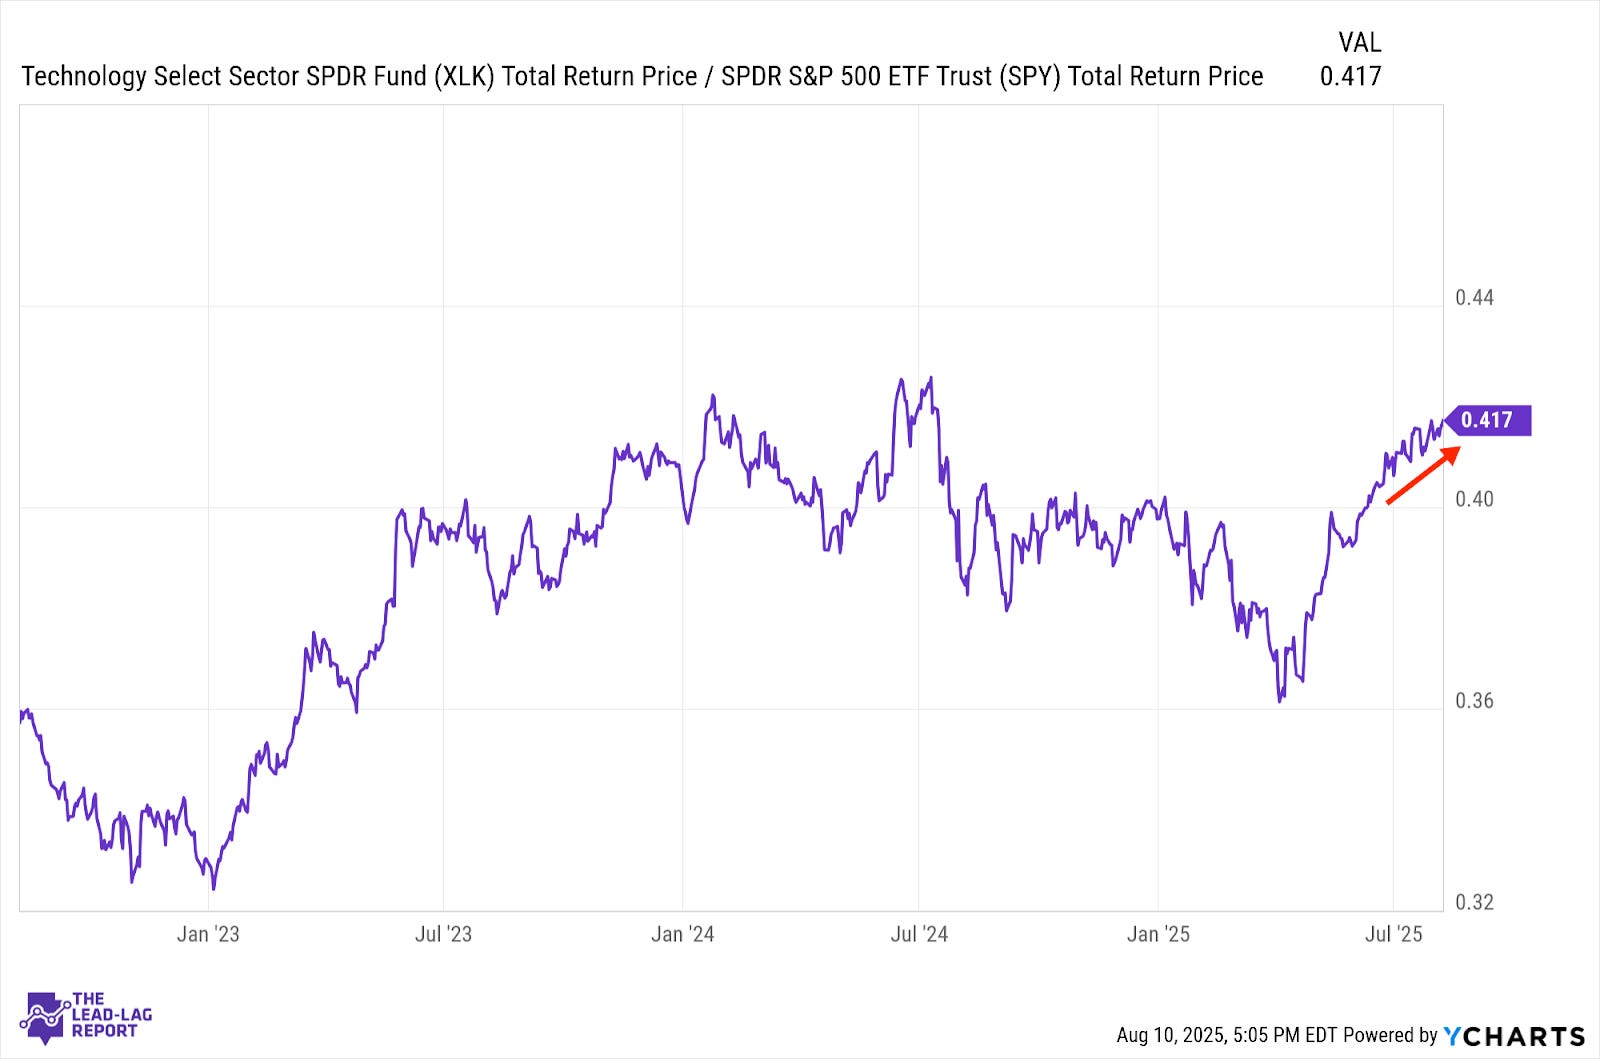
The market has begun pivoting its focus to rate cuts as opposed to the conditions that might necessitate them. Following the earlier non-farm payroll report, the rate cut calendar got pulled forward and that was enough to push investors back into the tech & growth stocks, two groups that often lead in this type of environment. It seems likely that this sector could continue to outperform as long as the focus is on rate cuts.
Utilities (XLU) – Signal Ready To Flip
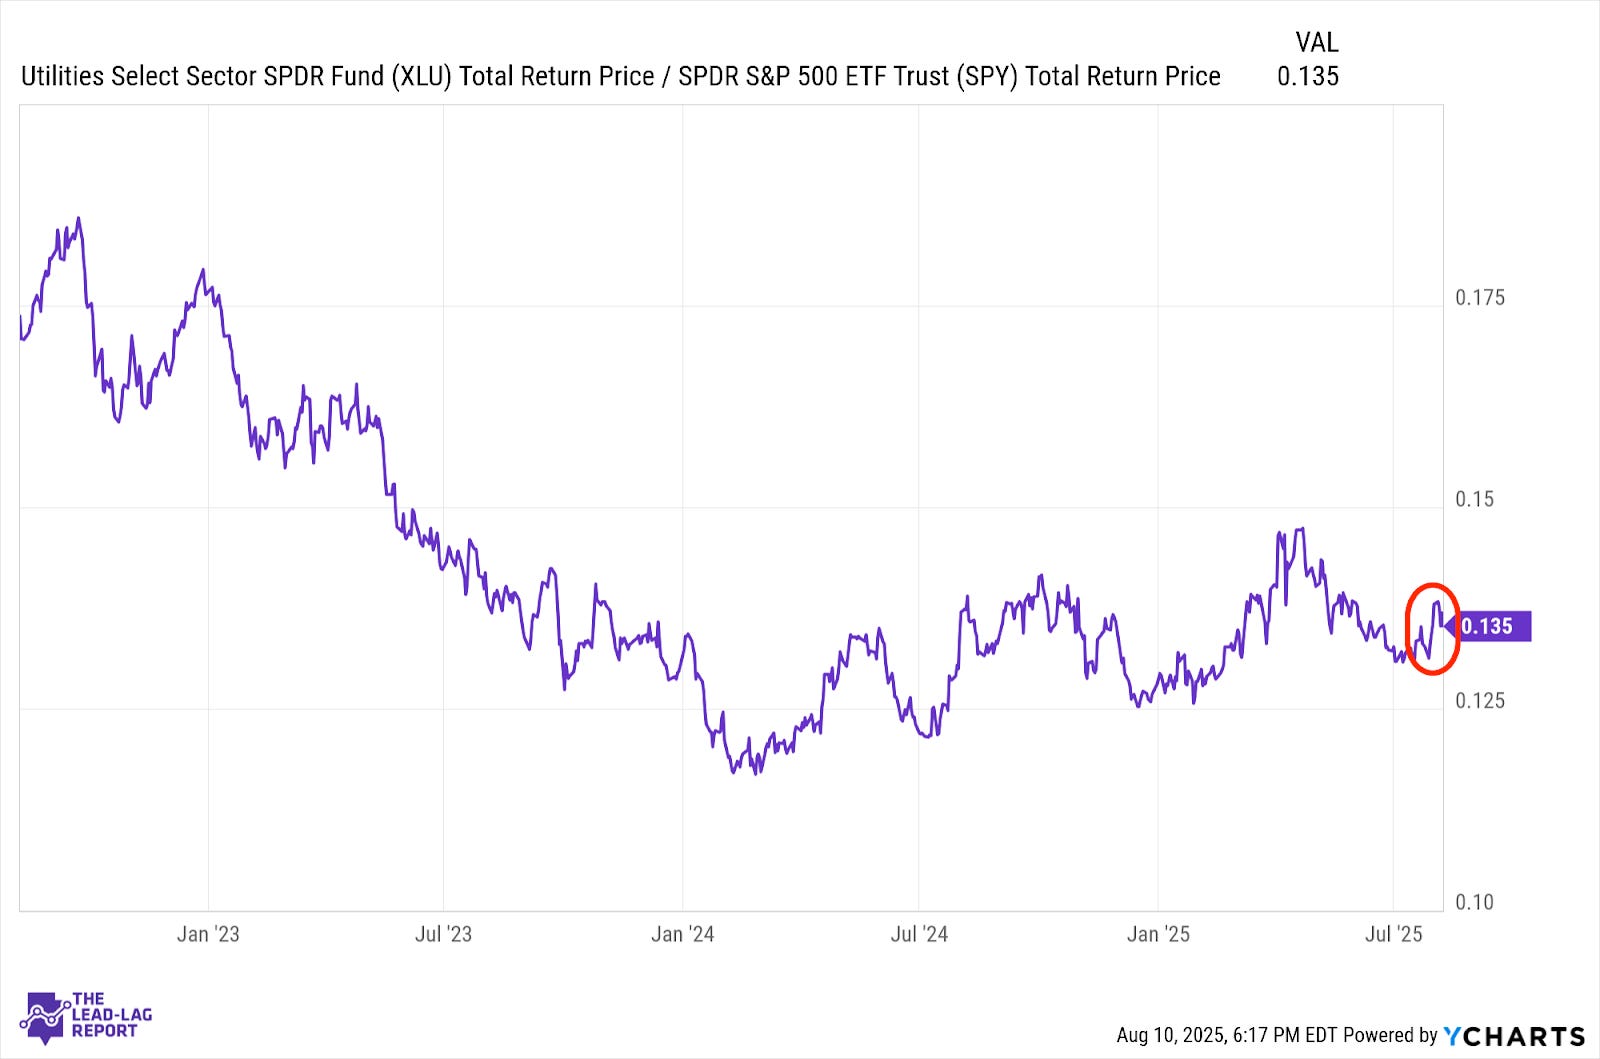
Last week’s underperformance notwithstanding, there’s still a tentative uptrend in place, which is why the utilities signal is still risk-off. While this has historically been a signal with some predictive power, there’s really nothing else under the “defensive” umbrella that’s demonstrating the same trend. It’s looking like there’s a better than 50% chance that this signal will soon flip.
Long Bonds (VLGSX) – Trying To Keep Up
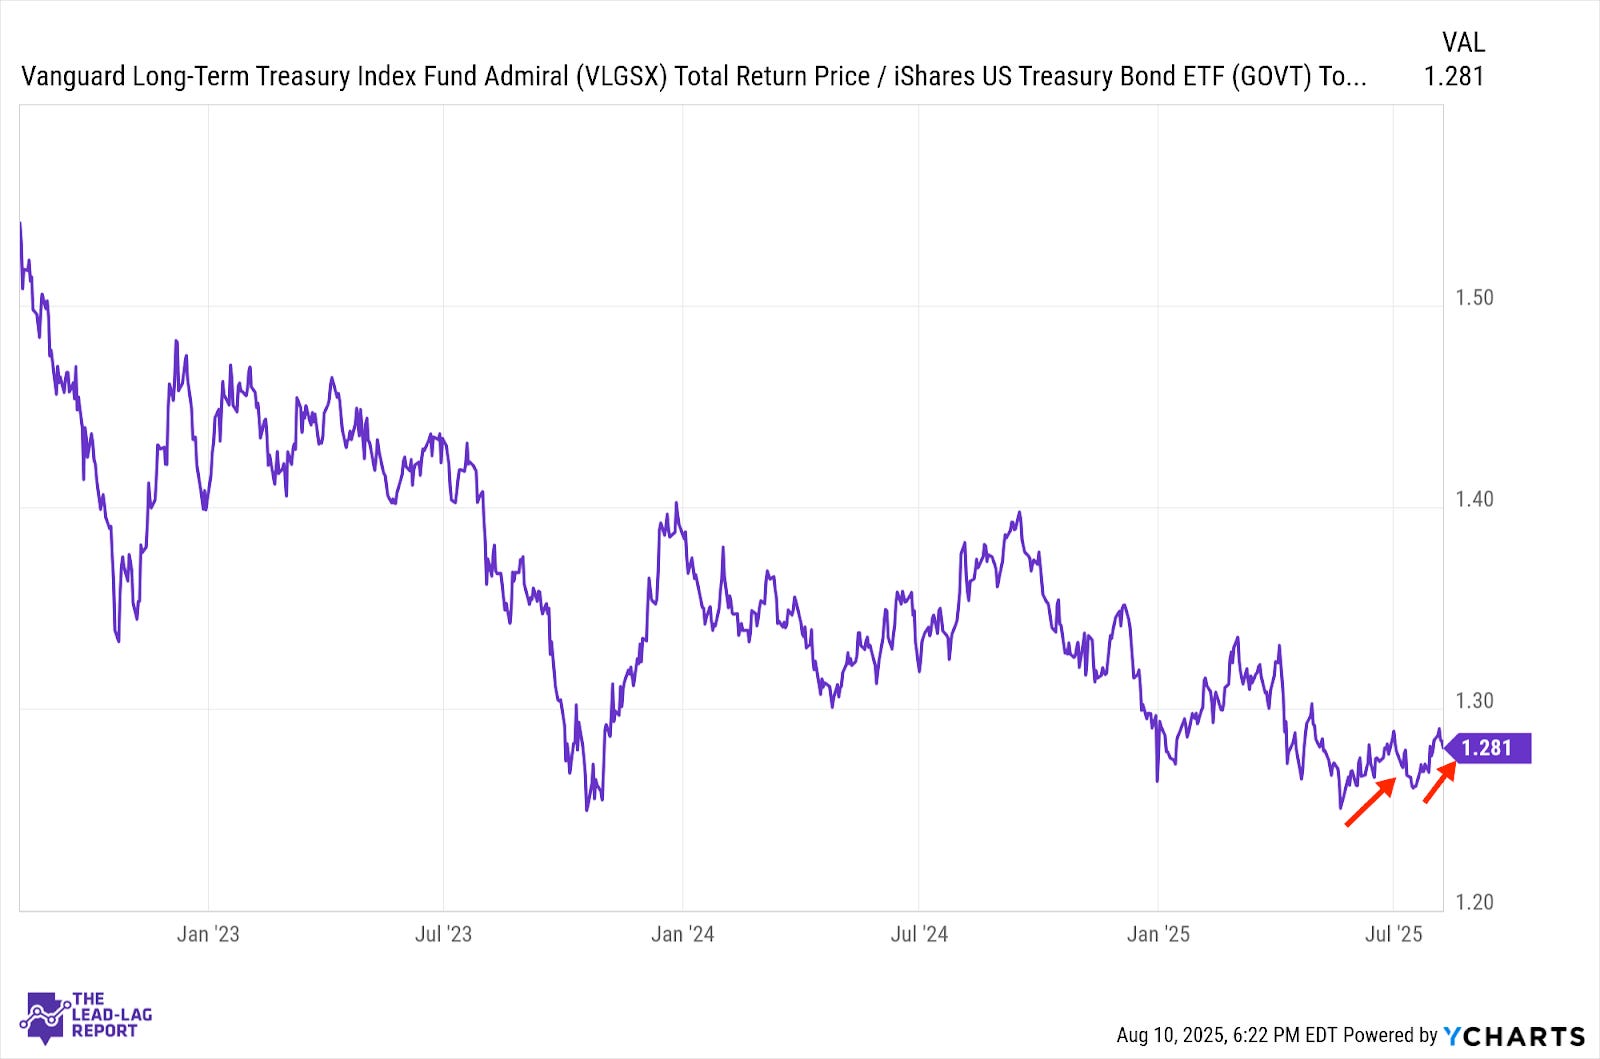
Treasuries are doing better here. Yields rose last week as market conditions were mostly risk-on, but recent outperformance has thus far held. There’s likely to be a continued tailwind from the upcoming Fed rate cutting cycle, but investor sentiment might ultimately be the short-term driver. As long as investors remain confident and are willing to push further into equities, Treasuries might have trouble trying to keep up.
Treasury Inflation Protected Securities (SPIP) – Inflation Might Be Getting Away From The Fed
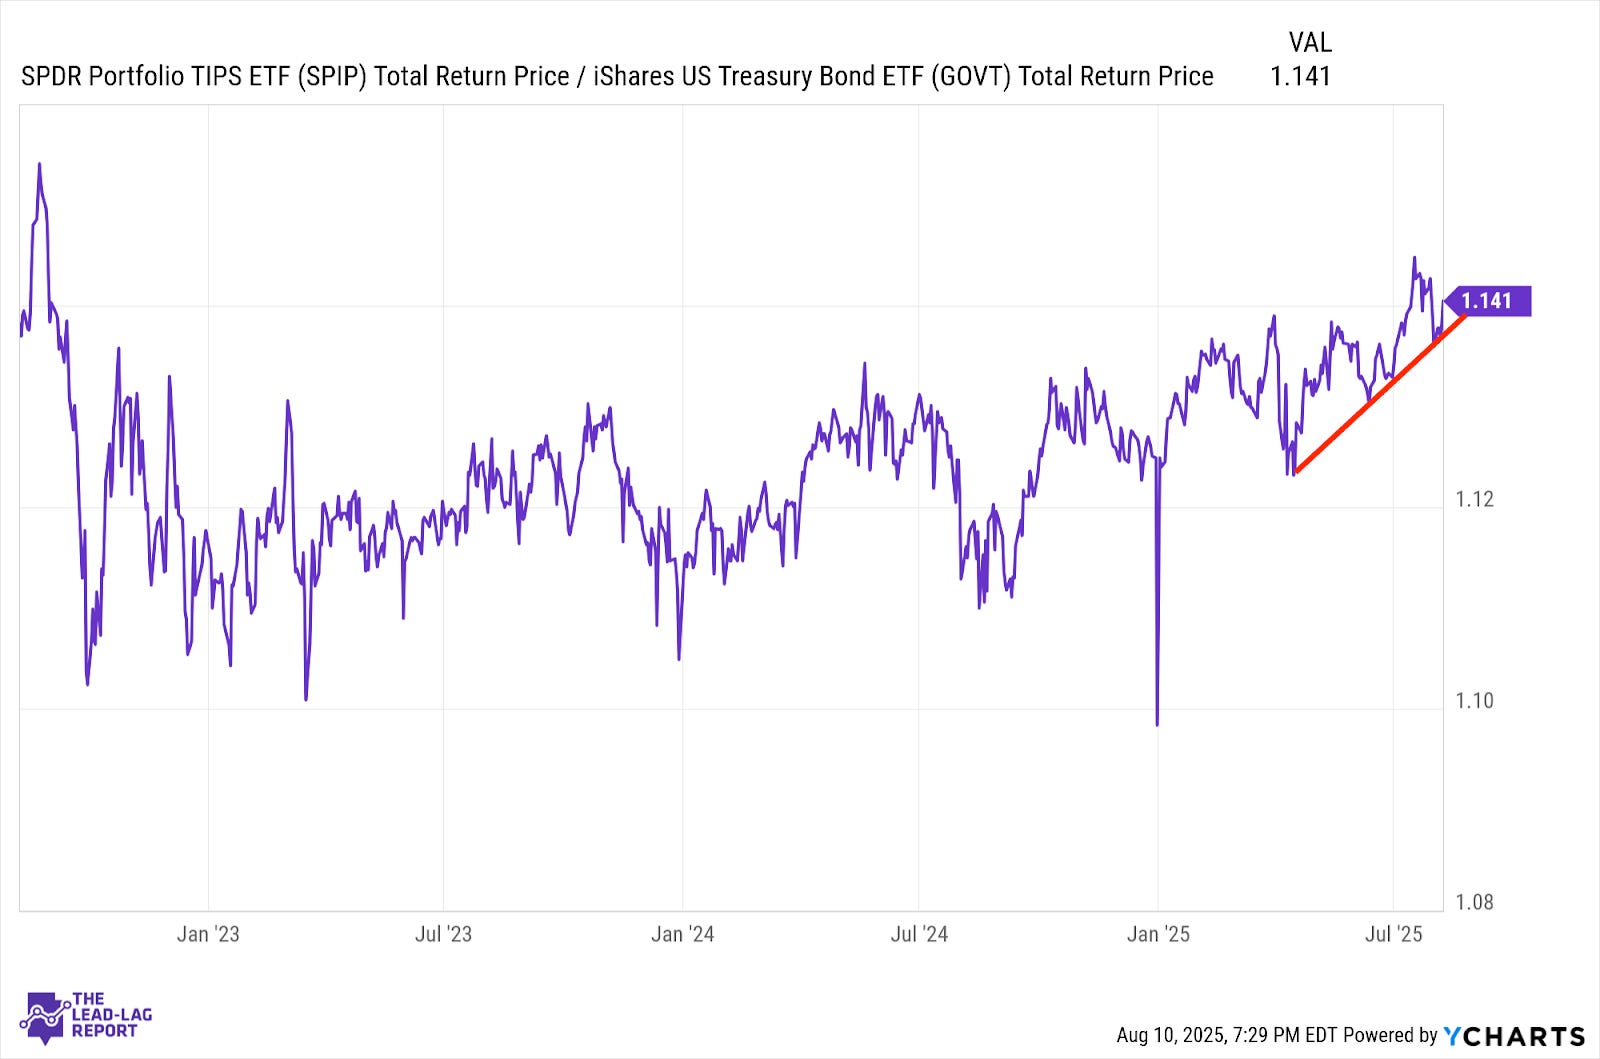
Look closely and you can see something of an uptrend forming in inflation protection. It comes at an interesting time too because this week we’ll get another round of CPI data, which is going to be watched very closely following the big jump in the June rate. Given the trend of this ratio, it appears that investors are at least a little worried that inflation might be getting away from the Fed here.
Junk Debt (JNK) – Favorable Environment Developing
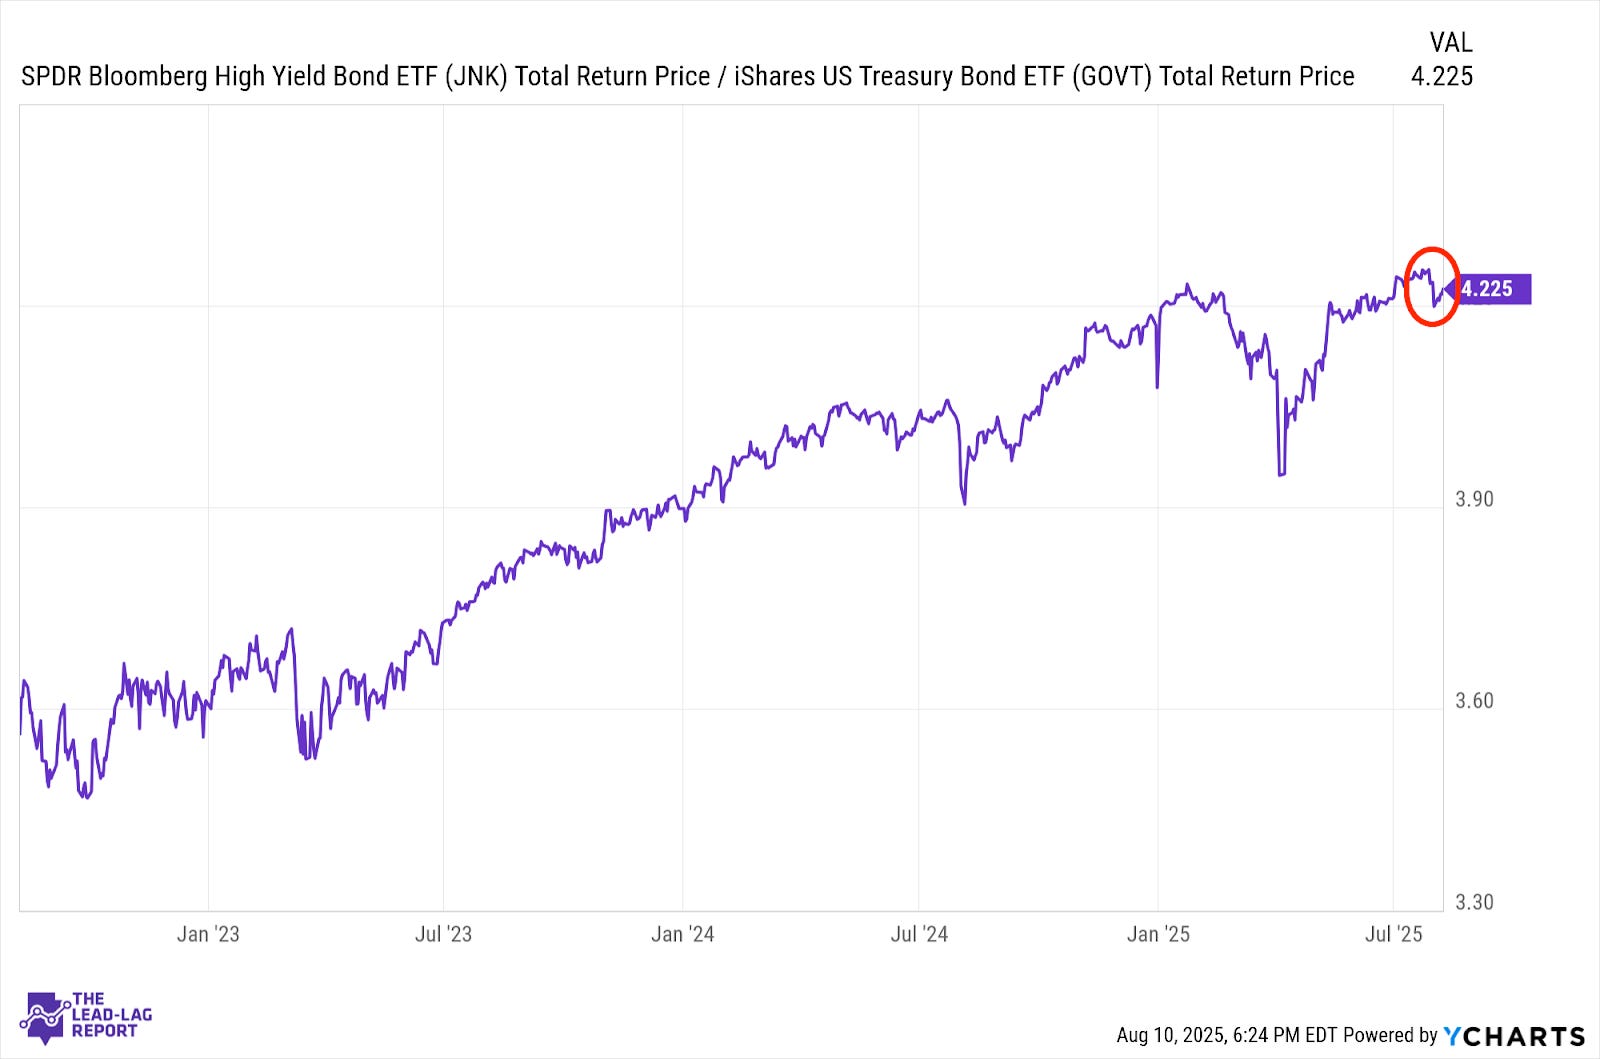
This ratio is reflective of the theme over the past two weeks - labor market fear followed by a risk-on return. As of this moment, the drop in this ratio is looking like it could be another head fake. If the market is looking at 2-3 rate cuts yet in 2025 and we get a liquidity tailwind from the Trump tax cut bill, there’s pretty clearly an environment developing that could be conducive to low-rated debt.
Emerging Markets Debt (EMB) – Momentum Could Soon Fade
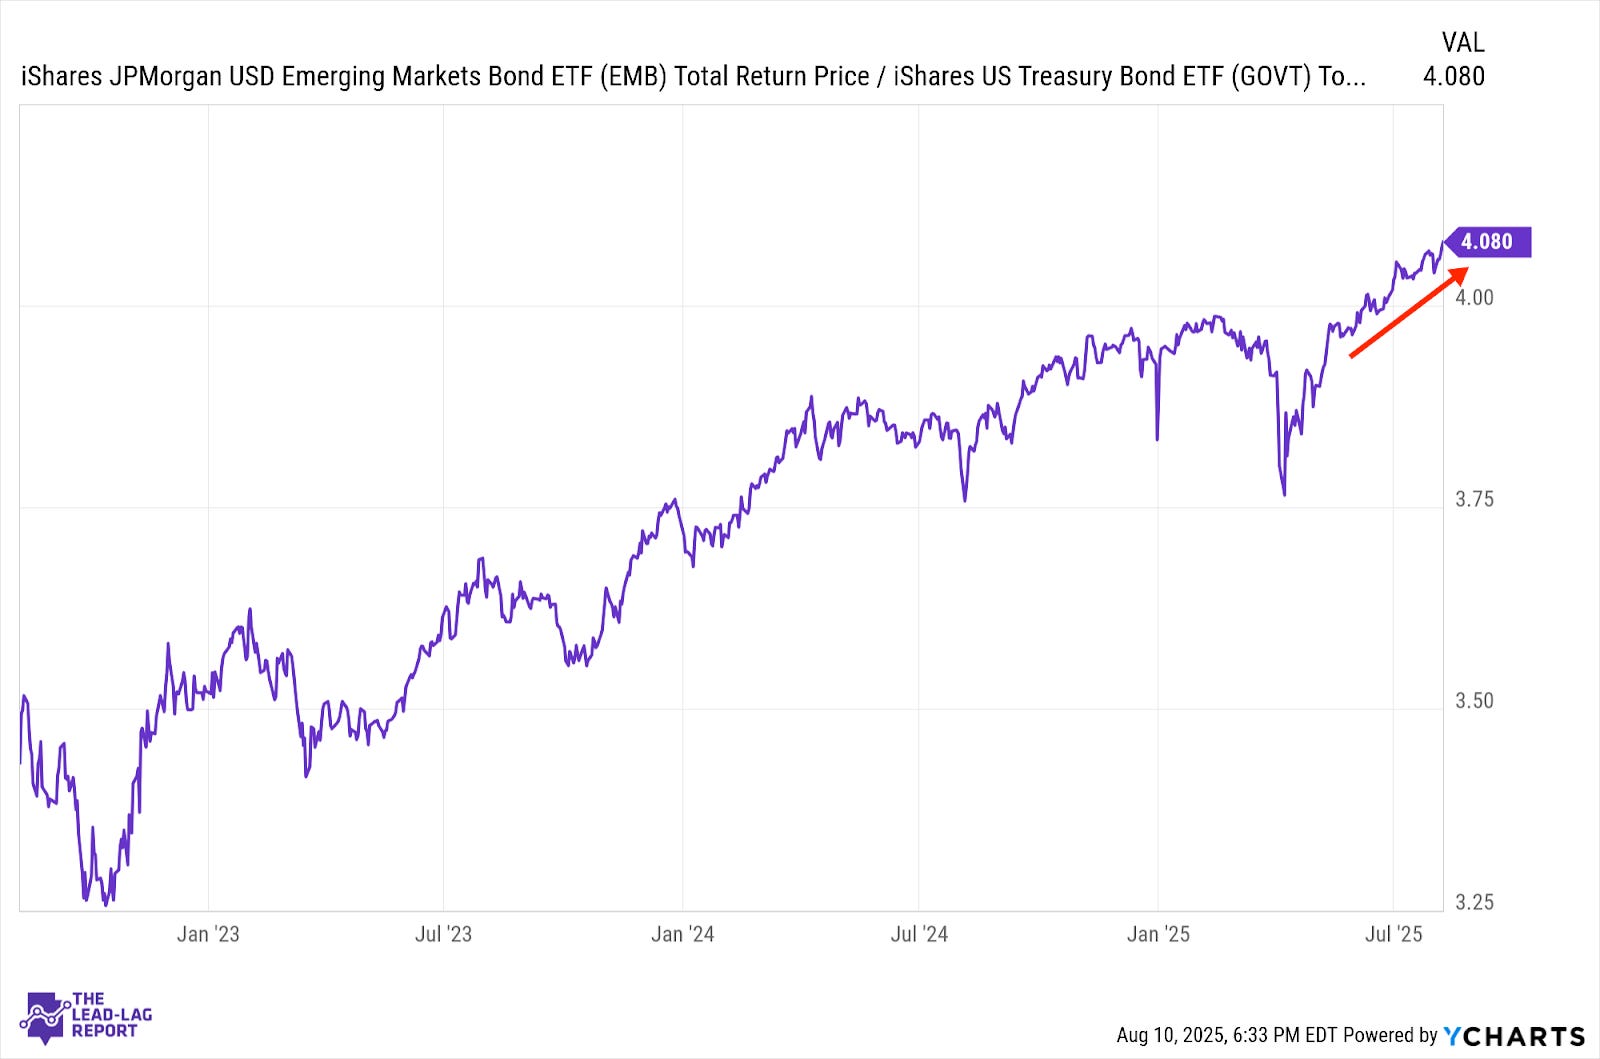
EM debt remains a steady outperformer of Treasuries here. The falling dollar has unlocked some value in this group and the relative rate differentials still look positive. With the trade war environment looking a bit more uncertain than it did a couple weeks ago and the Fed likely to make a push to lower rates shortly, there’s a chance that some of the momentum in this ratio soon fades.
