
End of Year Melt-Up? Weak Utilities, Strong Seasonality, and the Calm Before the Storm

Investors are entering the final stretch of the year wondering if equities have one more rally left in them. After months of turbulence, talk of an “end-of-year melt-up” is growing louder. Seasonality favors a rally, and one curious tell—the severe weakness in utility stocks—has caught my attention. While utilities are usually defensive safe havens, their recent collapse may actually signal a “risk-on” phase. Yet, beneath the optimism, there are signs of complacency in sentiment gauges like the VIX and put/call ratio.
Utilities Weakness: A Contrarian Bullish Signal
Utilities may not seem glamorous, but their performance often foreshadows changes in market volatility. Historically, when utilities outperform the broader market, volatility tends to rise; when they underperform, calm and risk-taking prevail. Short-term utilities leadership often preceded major market drawdowns, while utilities lagging coincided with low volatility periods¹².
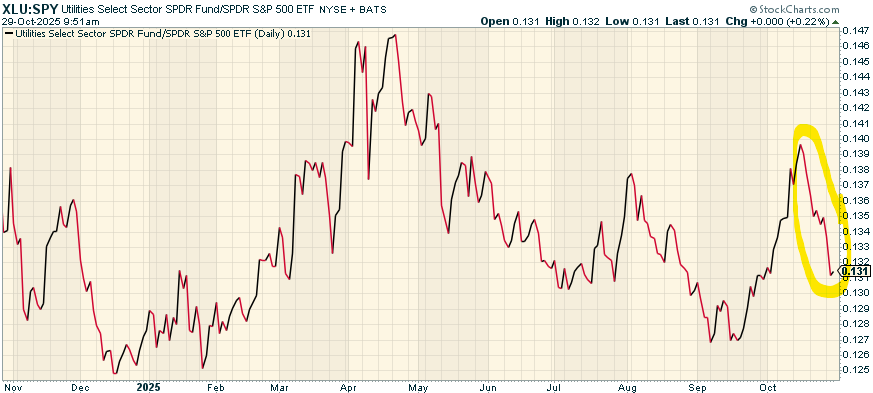
The logic is straightforward: utilities are safe-haven assets. When fear dominates, investors flock to them; when confidence returns, they sell them. The recent steep drop in utilities relative to the S&P 500—one of the weakest in years—implies investors are comfortable shifting into cyclical and growth stocks. If traders truly sensed danger, they’d be hiding in utilities, not abandoning them.
This setup echoes a key principle from intermarket analysis: utilities tend to lead volatility. Their current underperformance therefore suggests a near-term environment of reduced fear and potential equity gains. The last time utilities surged—prior to the tariff tantrum—it preceded a spike in volatility and a brief market pullback³. Now, the opposite dynamic appears to be in play.
Seasonality: Historical Tailwinds for Equities
The timing couldn’t be better for bulls. The November-December stretch is historically the most favorable for stocks. Over the past century, the S&P 500 has risen about 62 percent of the time in November and 74 percent in December, averaging monthly gains near 1 percent and 1.3 percent respectively⁴. This “Santa Claus rally” often reflects holiday optimism, portfolio rebalancing, and new-year expectations.
The convergence of two forces—weak utilities and strong seasonality—creates a classic melt-up setup. When defensive sectors lag while calendar trends turn positive, markets often drift higher. Combined with easing inflation expectations and potential Fed rate cuts, conditions seem aligned for a late-year push.
Still, history warns against complacency. Utilities’ weakness may flag calm conditions, but it doesn’t eliminate risk. Contrarian indicators lose their edge when everyone believes in them.
Complacency Creeps In
As bullish momentum builds, sentiment data reveal a concerning countercurrent: complacency.
