
Every Equity Crisis Was a Currency Crisis First
Fifty years of market history says the tape doesn't break until the money breaks. The signals are already blinking.

Today’s Lead-Lag Report post is sponsored by Infrastructure Capital

Live Webinar TODAY: Investing in Preferred Stocks with Jay Hatfield
Wednesday, July 1, 2026 at 2:00 PM ET
40 minutes | Live Q&A | 1 CFP CE credit approved
Speaker: Jay Hatfield, CEO and Chief Investment Officer, Infrastructure Capital Advisors
Preferred stocks have been one of the more misunderstood corners of the income market through the rate-cycle reset. On Wednesday, July 1 at 2:00 PM ET, Jay Hatfield joins Michael Gayed for a 40-minute live session walking through the active case for preferred stocks, where yield actually lives in this part of the capital stack, and the risks most allocators are still sleepwalking past. Live Q&A with Jay throughout.
This session is approved for 1 CFP CE credit.
Register free here: https://us06web.zoom.us/webinar/register/WN_HFoXfunWRFmQl2n9MCYCYA
Infrastructure Capital Advisors, LLC is an SEC-registered investment adviser. The PFFA ETF (Virtus InfraCap U.S. Preferred Stock ETF) is distributed by VP Distributors, LLC, a wholly owned subsidiary of Virtus Partners, Inc. Carefully consider the investment objectives, risks, charges and expenses of the fund before investing. To obtain a prospectus containing this and other important information, please visit https://www.infracapfunds.com/potential-benefits-of-pffa or call 1-888-383-0553. Read the prospectus carefully before investing.
Past performance is not indicative of future results. This webinar is for educational purposes only and is not investment advice, an offer, or a solicitation to buy or sell any security.
Every Equity Crisis Was a Currency Crisis First
KEY HIGHLIGHTS
● Across eleven major equity drawdowns since 1971, the currency market moved first — sometimes by weeks, sometimes by more than a year, but almost always before the stock market broke.
● The 2008 EUR/USD cross-currency basis blew out roughly forty-five trading days before the S&P 500 peaked. The 2020 basis went first by about ten trading days. The 1997 Thai baht float led the October S&P mini-crash by more than eighty.
● Today’s tape looks calm. Under the surface, USD/JPY sits above 162 after Japan spent roughly ¥11.7 trillion trying to defend it, DXY is at a fifty-two-week high, and JPMorgan’s emerging-market FX vol index crossed above its developed-market counterpart in March for the first time in 209 sessions — a record streak, now broken.
● The counterargument is real. 2013’s Taper Tantrum crushed emerging-market currencies and left the S&P 500 up thirty percent for the year. Currency stress is a necessary condition for global equity crises. It is not always sufficient.
● What would falsify the thesis: a sustained twenty-percent drawdown in US stocks while the dollar sits flat, EM FX volatility stays quiet, and cross-currency basis spreads hover near zero.
The Pattern Nobody Names
Investors talk about earnings. They talk about the Fed. They talk about positioning, sentiment, breadth, credit spreads. What they rarely talk about — until it is too late — is the currency market.
That is a mistake, because the historical record is unusually clean on this point. A currency is not a medium of exchange. It is a claim on the full productive and fiscal capacity of the sovereign that issues it. When that claim starts to break, the equity market that trades against it is next. Not sometimes. Not usually. Almost every time, in some form, since we abandoned the gold anchor in 1971.
Bruno and Shin formalized the mechanism in 2015: global banks fund cheaply in dollars and lend into local balance sheets. When the dollar rises or the local currency falls, leverage ratios collapse, margin calls fire, and something — usually equities — has to be sold to raise dollars.[1] Hélène Rey argued at Jackson Hole in 2013 that there is one Global Financial Cycle, not many, and it moves with the VIX and dollar liquidity regardless of what exchange-rate regime a country happens to have chosen.[2] The Bank for International Settlements has been documenting cross-currency basis violations as the real-time thermometer of dollar funding stress since 2008.[3] These are not exotic academic ideas. They are the plumbing.
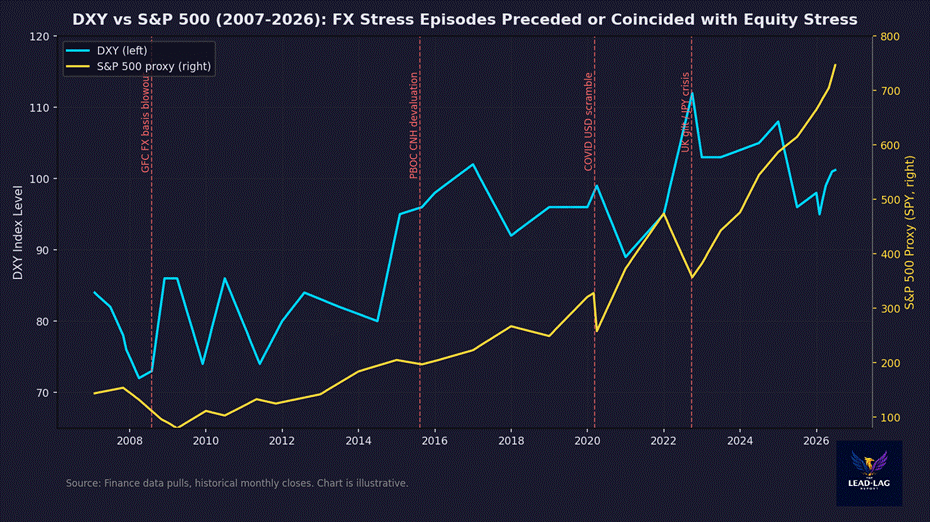
Chart 1. DXY and S&P 500 across the modern floating-rate era, with four illustrative FX stress episodes marked.
What Fifty Years of Case Studies Say
The Nixon Shock of August 1971 broke the dollar’s gold anchor. The S&P 500 peaked seventeen months later, in January 1973, and lost forty-eight percent over the following twenty-three months — the worst bear market since the Great Depression.[4]
The Plaza Accord of September 1985 committed the G5 to depreciate the dollar. DXY fell from 164 in early 1985 to 90 by early 1987 — a forty-five percent decline. The Louvre Accord of February 1987 tried to stabilize the fall and failed. Treasury Secretary Baker publicly hinted at further dollar weakness in the week before October 19, 1987. The S&P 500 fell twenty and a half percent in a single session.[5] The proximate FX signal preceded Black Monday by three to five trading days.
June 1992: Italian lira bond futures broke first. On September 16, 1992, the Bank of England raised its policy rate to fifteen percent in a single afternoon before capitulating — an intervention that Treasury FOI documents later placed at roughly £3.3 billion in confirmed net losses.[6] Sterling devalued roughly ten percent against the deutschmark within days. Italian and Spanish equities lost fifteen to twenty-five percent that quarter.
The Mexican peso devaluation of December 20, 1994 began as a fifteen percent band-widening. Within two weeks the peso had lost roughly thirty percent against the dollar after the government abandoned the band entirely and let the currency float. The Bolsa lost sixty-seven percent in dollar terms between December 19, 1994 and March 9, 1995.[7] The Colosio assassination nine months earlier had already sent the first warning.
July 2, 1997: the Thai baht floated and fell seventeen percent on day one.[8] The rupiah lost eighty-three percent. The won lost fifty percent. Eighty-three trading days later the S&P 500 fell 6.86 percent in a session — the first day cross-market circuit breakers ever tripped.
August 17, 1998: Russia devalued the ruble and defaulted. The ruble lost roughly seventy percent in five weeks. Long-Term Capital Management collapsed. The S&P 500 fell 19.3 percent from its July peak to its October trough, and the VIX hit 49.53 intraday.[9]
August 9, 2007: BNP Paribas suspended redemptions from three money market funds. The EUR/USD three-month cross-currency basis, previously anchored at zero, went negative that day.[10] The S&P 500 peaked forty-five trading days later. By March 2009 it had lost 56.8 percent, and the basis had blown out to negative two hundred basis points above LIBOR.
August 11, 2015: the People’s Bank of China cut the daily yuan reference rate by 1.9 percent — the biggest single-day fix cut ever. Ten trading days later the S&P 500 traded down twelve percent from its July peak.[11]
March 9, 2020: the EUR/USD cross-currency basis blew out toward negative one hundred basis points as COVID triggered a global dollar hoarding scramble. DXY surged eight percent in six weeks. The Federal Reserve opened new swap lines with nine additional central banks. The S&P 500 troughed shortly after, having lost 33.9 percent in thirty-three days.[12]
September 2022: Kwasi Kwarteng’s mini-budget triggered a three-day, 120-basis-point spike in thirty-year UK gilt yields. Sterling touched $1.035 in Asian trading. The Bank of England intervened to stop a liability-driven pension fund fire sale from becoming systemic.[13] The same month, Japan’s Ministry of Finance made its first yen-buying intervention in twenty-four years.[14]
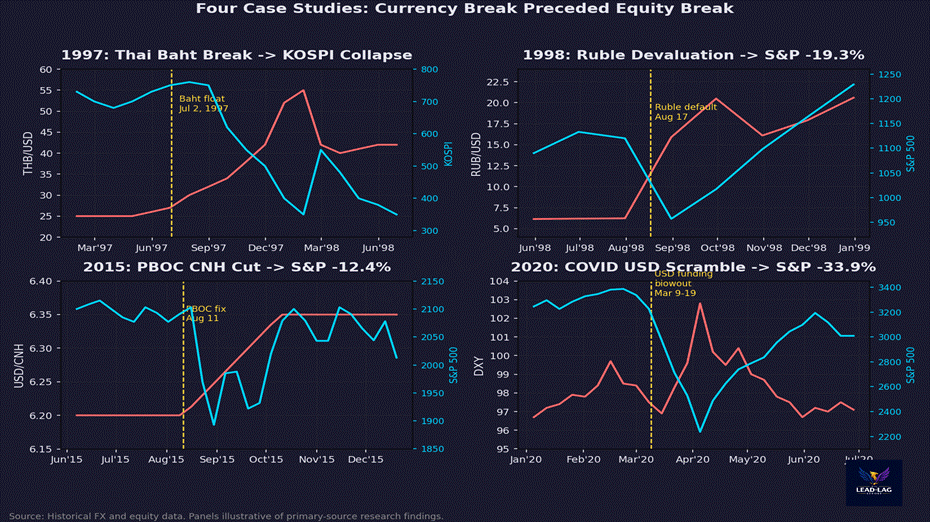
Chart 2. Four representative episodes where currency stress preceded the equity break: 1997 Thai baht, 1998 Russian ruble, 2015 PBOC CNH fix, 2020 COVID USD scramble.
Why This Time Feels Different, and Why It Probably Isn’t
The mechanism runs through four channels: cross-border bank leverage, dollar reserve-currency dynamics, the Global Financial Cycle, and cross-currency basis violations that measure real-time dollar funding stress. Each channel is documented. Each has been tested in real crises. The signal is not perfect, but its false-positive rate is meaningfully lower than the standard equity signals investors watch every day.
The most-cited counterpoint is 2013. Bernanke’s Taper Tantrum sent the Brazilian real, Indian rupee, Indonesian rupiah, and South African rand down thirteen to seventeen percent.[15] The S&P 500 finished the year up thirty percent. The lesson is not that FX signals fail. It is that FX signals matter most when the dollar itself is under stress — 2008, 2020 — and matter less when the dollar is strong for benign reasons like a Fed tightening cycle.
The Other Side
The steelman is real and I take it seriously. First, causation runs both ways: during 2008 and 2020, dollar demand may have been a coincident consequence of equity liquidation, not its cause. Second, 2013 shows that severe EM FX stress can occur without a US equity drawdown. Third, quantitative easing regimes structurally suppress FX volatility, and a basis at negative twenty basis points today does not mean what it meant in 2006, because Basel III has widened the resting level. Fourth, the S&P 500 is now roughly thirty percent Magnificent Seven — a domestically-insulated cash-flow machine less exposed to global funding dynamics than the pre-2010 index was.
None of these arguments falsify the thesis. They constrain it. FX volatility is a necessary but not sufficient condition for a globally-mediated equity crisis. It is most predictive when combined with widening basis swaps, a rising MOVE index, and dollar strength driven by risk-off flight rather than pure policy divergence.
What The Signal Says Right Now
June 2026 is not August 2007. It is also not August 1997. It is something else — a slow-motion coiling.
DXY sits at 101.2, near a fifty-two-week high after recovering from the “Liberation Day” tariff-shock lows of early 2026 near 95 — roughly a six-percent move in a few months.[16] USD/JPY sits at 162.6 despite the Ministry of Finance having spent ¥11.7 trillion — about seventy-three billion dollars — defending the yen in April and May. Former BOJ policymaker Sayuri Shirai has publicly warned the pair could reach 163 to 165 if the Fed tightens further.[17] USD/CNH drifts toward 6.80 as the People’s Bank of China widens its daily fixing band from two percent to two and a half percent — the same kind of quiet policy signal that preceded August 11, 2015.
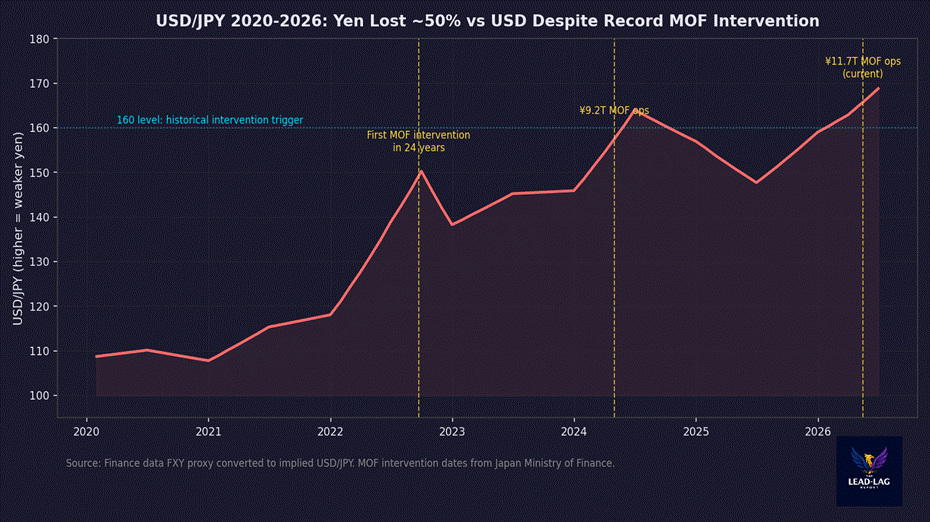
Chart 3. USD/JPY 2020–2026. Three MOF intervention rounds have failed to reverse the underlying trend.
Cross-currency basis is the tell to watch. The three-month EUR/USD basis sits at roughly negative sixteen to negative twenty basis points — benign by post-2015 standards but tighter than the negative thirty-five to negative forty-five that prevailed from 2016 through 2020. A widening from here toward negative forty and beyond would be the classical dollar-funding stress signal that led the equity peaks in 2007 and the equity trough in 2020.
The subtlest signal is the JPMorgan VXY-EM index. In March 2026 it crossed above the G7 FX volatility index for the first time in 209 consecutive trading days — the longest such streak on record.[18] EM FX vol above DM FX vol is historically an early cycle signal, not a late one. It says the periphery is starting to move before the core does.
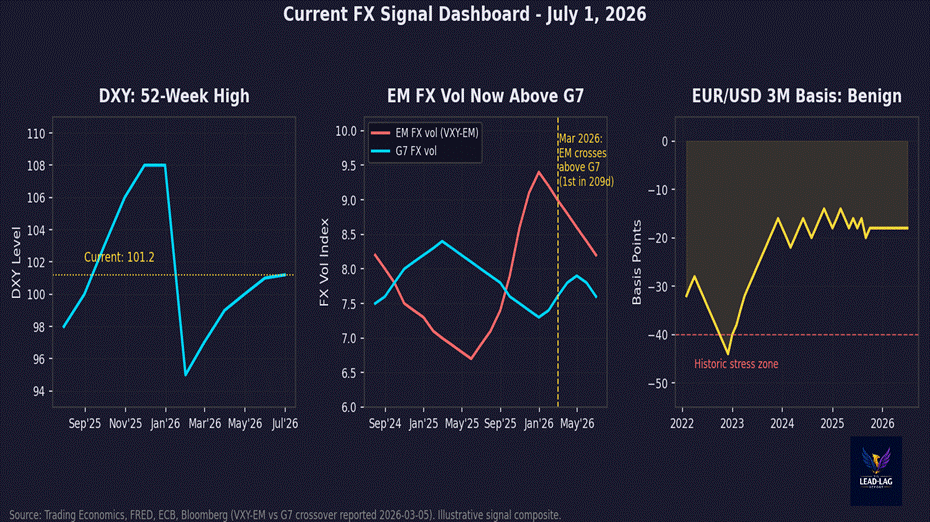
Chart 4. Current FX signal composite: DXY at fifty-two-week high, EM FX vol crossed G7, EUR/USD basis benign but tighter than the 2016–2020 baseline.
I referenced the yen and Bank of Japan carry-trade risk in the June 26 issue.[19] That piece narrowed the lens to one currency, one policy regime. This piece widens it. The Japan story is one instance of the general pattern: reserve-currency systems produce currency crises before they produce equity crises. Every time. The list above is not selective. It is the full major-drawdown history of the modern floating-rate era.
Falsification
I would be wrong about this thesis if the following happened: the S&P 500 falls twenty percent or more, and DXY thirty-day realized volatility stays below six percent annualized, and EUR/USD three-month cross-currency basis stays between zero and negative ten basis points, and the JPMorgan VXY-EM index stays below its two-year median. That combination would prove the equity drawdown was domestically driven — earnings, valuation compression, sector rotation — without a global funding-stress dimension. It would prove FX was not the transmission mechanism. That combination is what should end this thesis. Until it happens, watch the money.
Few understand this.
Notes
1. Bruno, V. and Shin, H.S. (2015), “Cross-Border Banking and Global Liquidity,” Review of Economic Studies 82(2), 535–564.
2. Rey, H. (2013), “Dilemma not Trilemma: The Global Financial Cycle and Monetary Policy Independence,” Federal Reserve Bank of Kansas City Jackson Hole Symposium Proceedings.
3. Bank for International Settlements (2008), “The Spillover of Money Market Turbulence to FX Swap and Cross-Currency Swap Markets,” BIS Quarterly Review, March 2008; BIS Quarterly Review, September 2016.
4. New York Federal Reserve Monthly Review, September 1971. S&P 500 peak-to-trough per Motley Fool historical database.
5. NBER Working Paper 21813, “The Plaza Accord, 30 Years Later”; Federal Reserve History, “Stock Market Crash of 1987.”
6. Bank of England historical account; IMF eLibrary, ERM Crisis Annex.
7. Federal Reserve Bulletin, 1996, “The Mexican Peso Crisis: Implications for International Finance.”
8. Bank of Thailand press release, July 2, 1997; Bloomberg, July 14, 1997.
9. Brookings Institution analysis; Richmond Fed Economic History; VIX intraday data.
10. New York Fed Current Issues, “The Global Financial Crisis and Offshore Dollar Markets”; ECB Financial Stability Review, December 2011.
11. Bloomberg, August 11, 2015; Hong Kong Exchange CNH Flash Report, August 11, 2015.
12. Dallas Fed Economic Research, 2024, “Fed Swap Lines During the COVID Crisis”; State Street Global Advisors, “US Dollar Funding Stress in the Time of COVID-19.”
13. Bank of England Working Paper 1046 (2023), “An Anatomy of the 2022 Gilt Market Crisis”; IMF Selected Issues Paper on LDI Crisis, United Kingdom, 2023.
14. Ministry of Finance Japan, Foreign Exchange Intervention Operations, July–September 2022.
15. IMF Staff Discussion Note SDN/14/09, 2014.
16. Trading Economics DXY series; FRED series DTWEXBGS, Nominal Broad U.S. Dollar Index, June 26, 2026 reading.
17. Reuters, June 23, 2026, “Fed hike could push yen to 165 per dollar, ex-BOJ policymaker says.”
18. Bloomberg, March 5, 2026, “Emerging-Market FX Swings Top Developed Peers After Record Lull.”
19. Lead-Lag Report Macro Observations, June 26, 2026, “The Yen, the Bank of Japan, and the Slow-Motion Carry Trade.”
DISCLAIMER
The Lead-Lag Report is provided by Lead-Lag Publishing, LLC. All opinions and views mentioned in this report constitute our judgments as of the date of writing and are subject to change at any time. Information within this material is not intended to be used as a primary basis for investment decisions and should also not be construed as advice meeting the particular investment needs of any individual investor. Trading signals produced by the Lead-Lag Report are independent of other services provided by Lead-Lag Publishing, LLC or its affiliates, and positioning of accounts under their management may differ. Please remember that investing involves risk, including loss of principal, and past performance may not be indicative of future results. Lead-Lag Publishing, LLC, its members, officers, directors and employees expressly disclaim all liability in respect to actions taken based on any or all of the information on this writing.