

The signals continue to suggest that conditions are mixed. The short-term still looks relatively risk-on as utilities and Treasuries start to underperform, but the strength in gold is dominating the medium-term outlook. This is consistent with my messaging throughout the past several weeks - rate cuts are continuing to fuel investor enthusiasm, but the rally in gold suggests that investors aren’t quite as bullish as they seem.
How To Interpret the Signals: Within each strategy, there is a risk-on and risk-off investment recommendation, with the risk-off option being the more conservative of the two. When a particular signal indicates that investors should be risk-off, for example, subscribers should consider investing in the risk-off option and avoiding the risk-on option. The opposite, therefore, would be true when the signal flips to risk-on. In each strategy, you’d always be invested in one option or the other.
Here’s how to read the scorecard for each strategy:

Some of the strategies will be more aggressive than others. The “Leverage For The Long Run” strategy, for example, uses the S&P 500 and 2x-leveraged S&P 500. The more conservative “Lumber/Gold Bond” strategy, however, uses intermediate-term Treasuries and the S&P 500. In every case, a risk-off signal indicates that you should be invested in the more conservative of the two options, while a risk-on signal indicates you should be invested in the more aggressive one.
For a full user's guide on how to interpret each of the signals and how to put them to work in your portfolio, please click HERE.
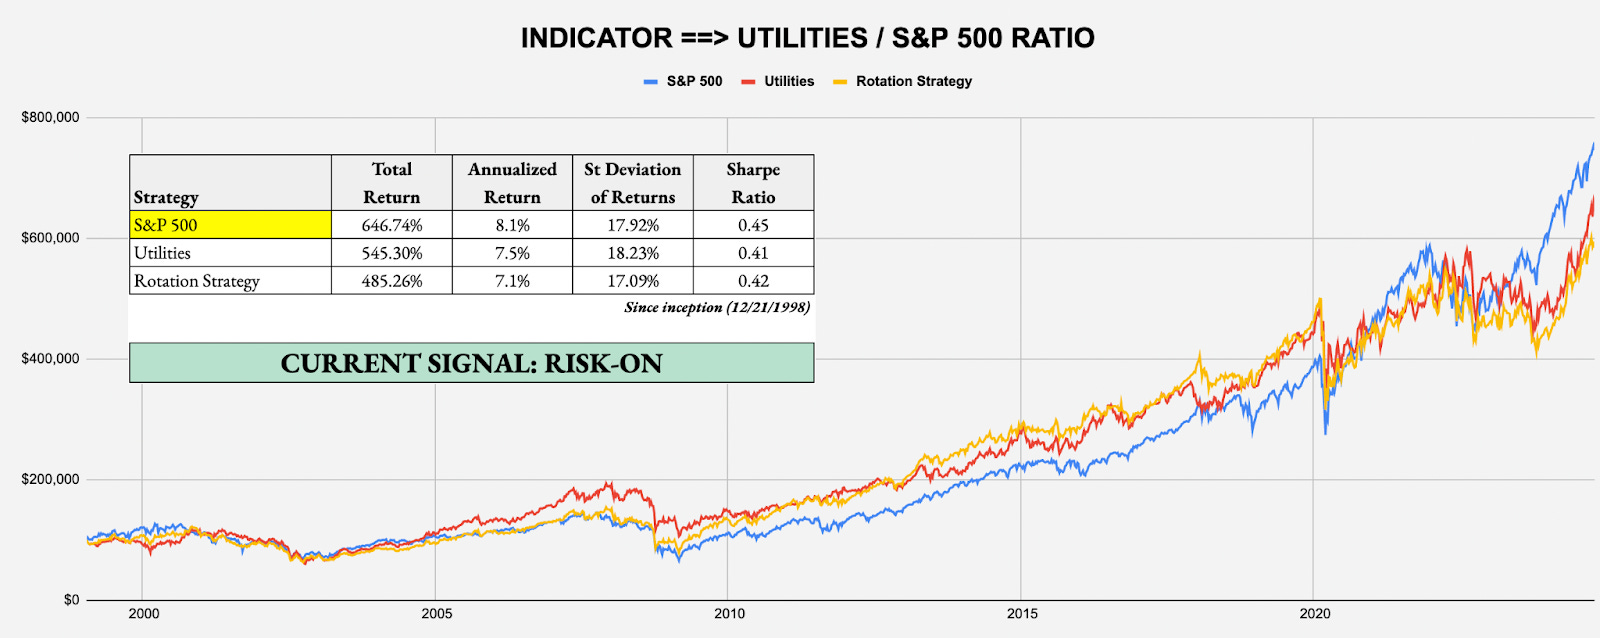
SHORT-TERM SIGNAL: UTILITIES/S&P 500 RATIO
Target Investor: Short-term traders with a higher risk tolerance interested in using an equity momentum strategy to anticipate changes in market risk tolerance.
Current Indicator: Risk-On
Strategy: Beta Rotation - Example: Invest in S&P 500 (SPY) over Utilities (XLU)
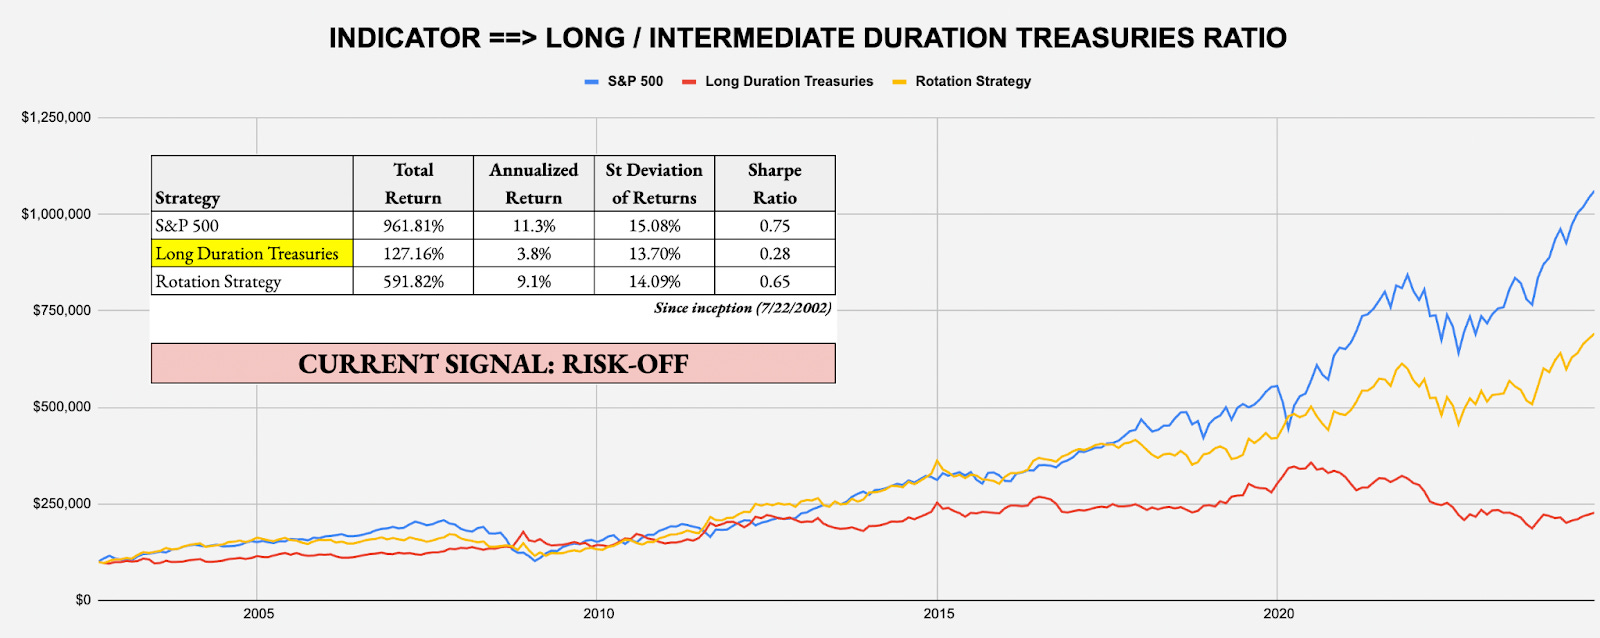
SHORT-TERM SIGNAL: LONG DURATION/INTERMEDIATE DURATION TREASURIES RATIO
Target Investor: Short-term traders with a higher risk tolerance who want to use the activity in the U.S. Treasury market to judge overall risk levels.
Current Indicator: Risk-Off
Strategy: Tactical Risk Rotation - Example: Invest in Long-Duration Treasuries (VLGSX) over S&P 500 (SPY)
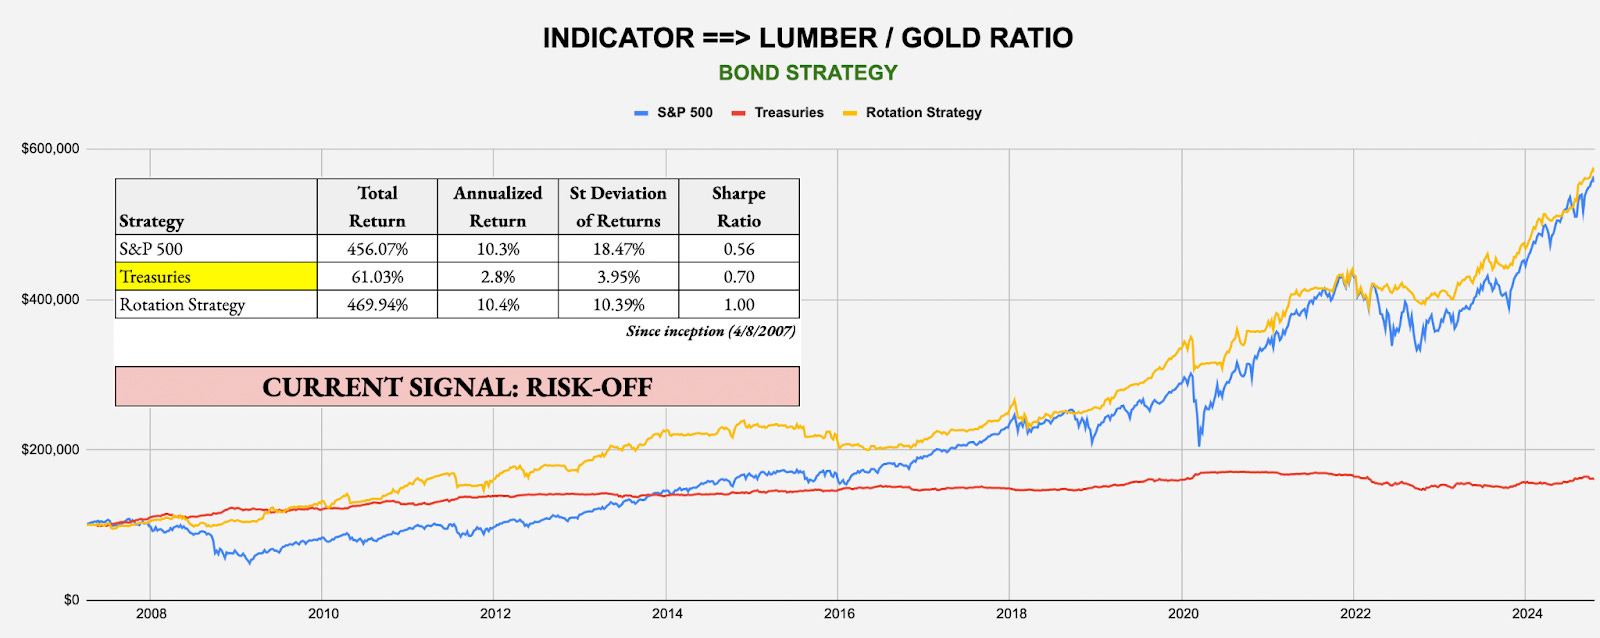
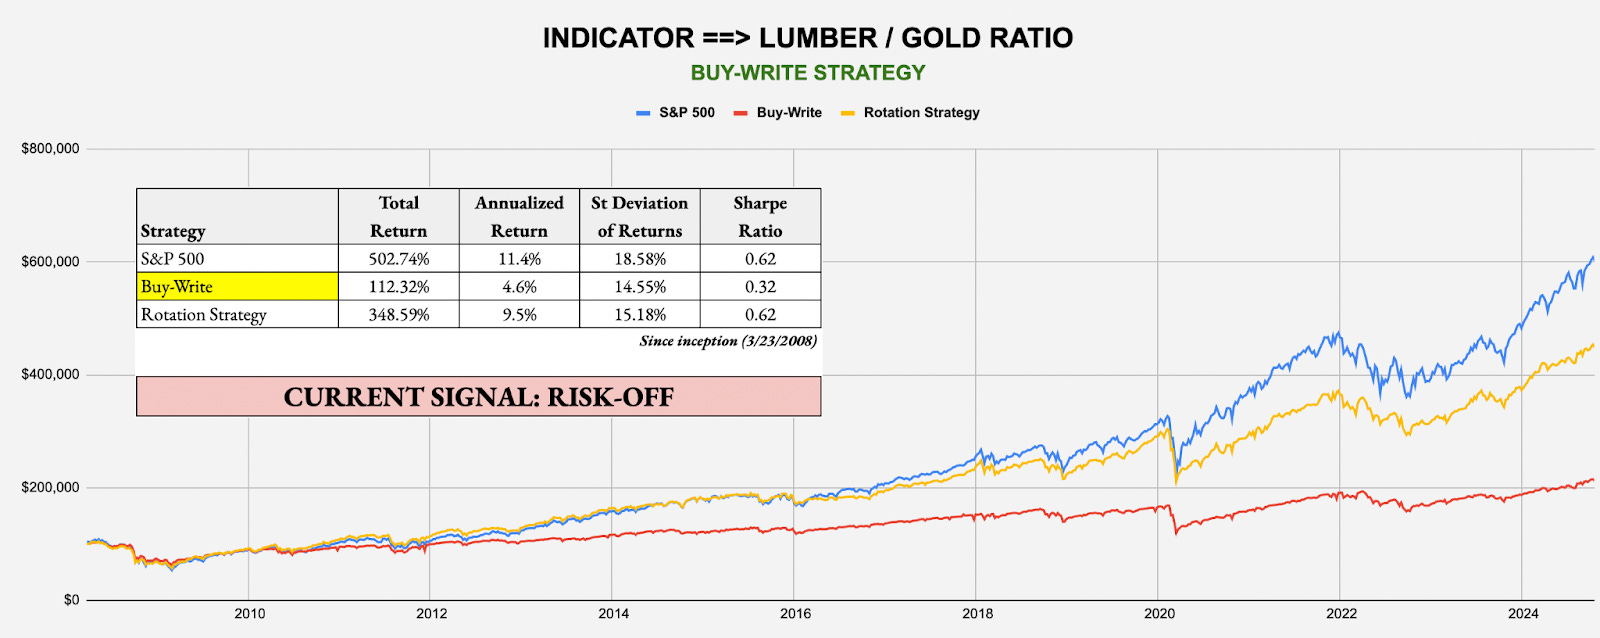
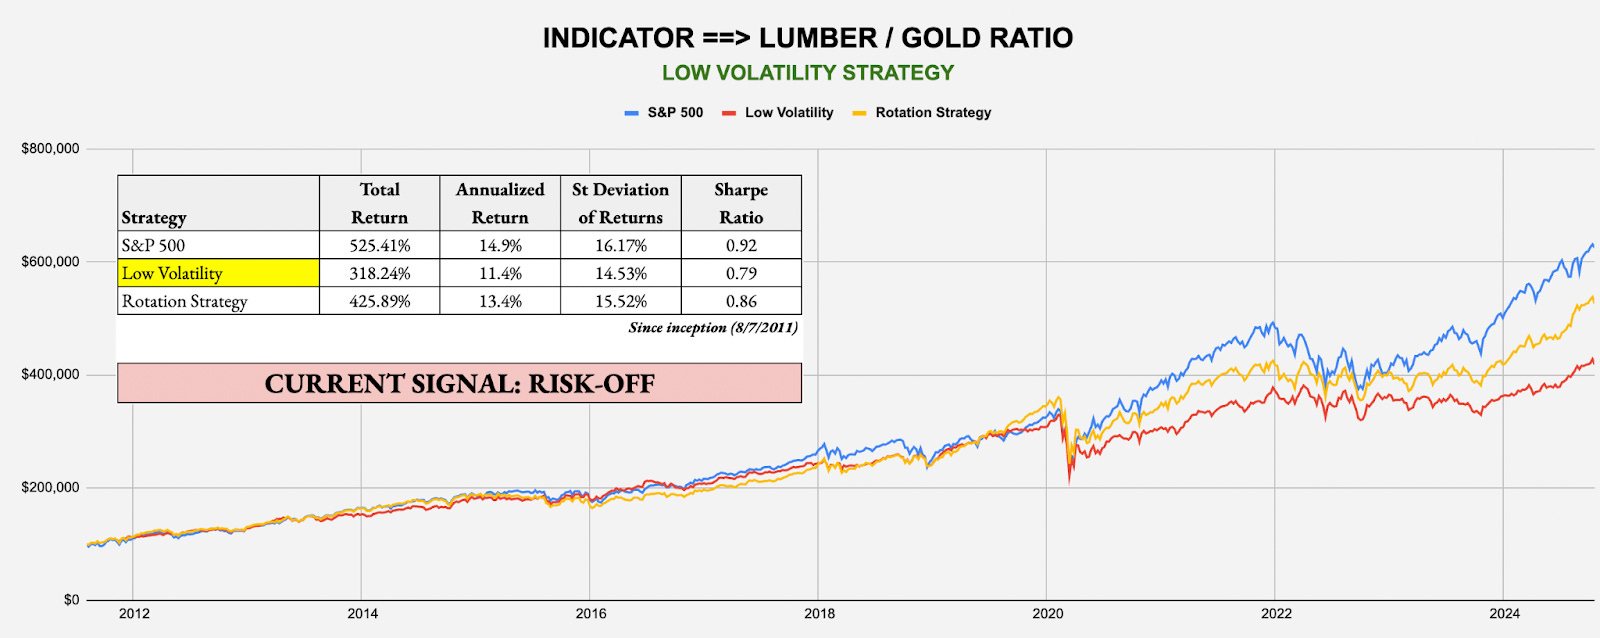
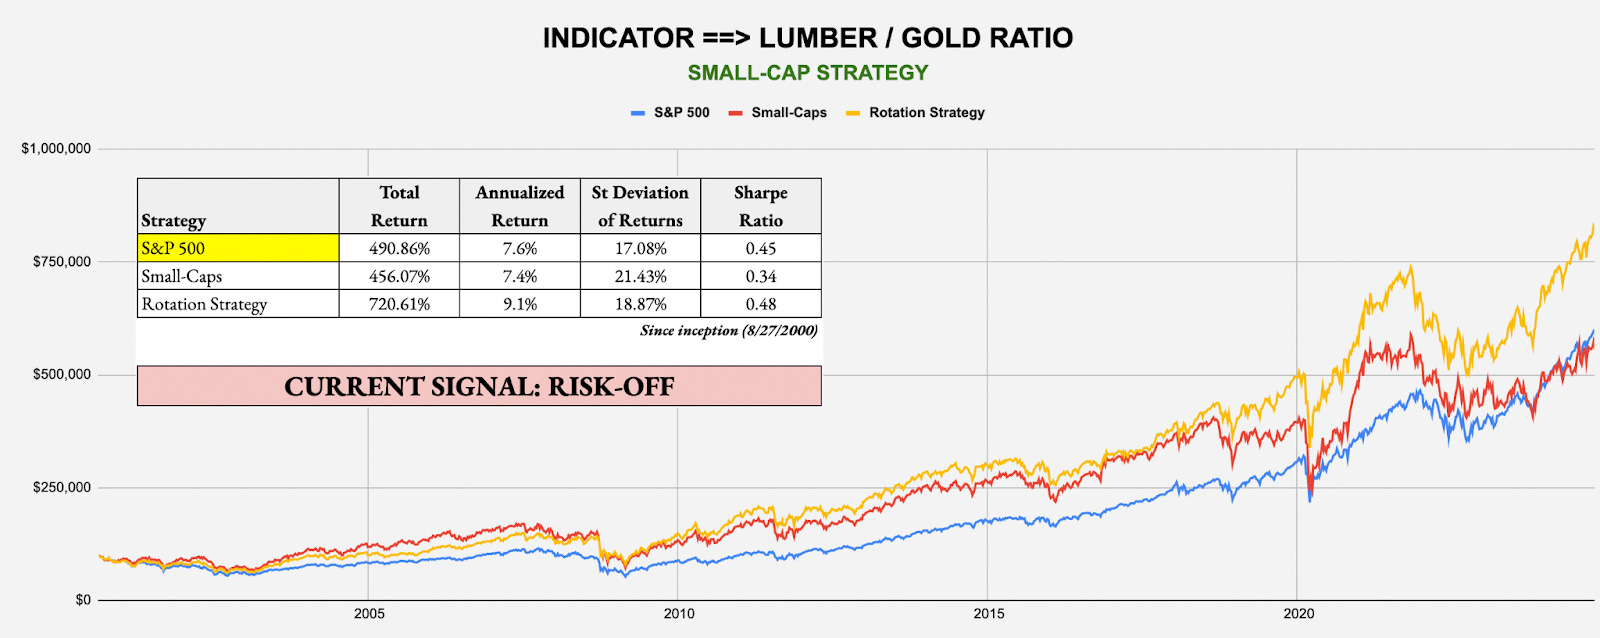
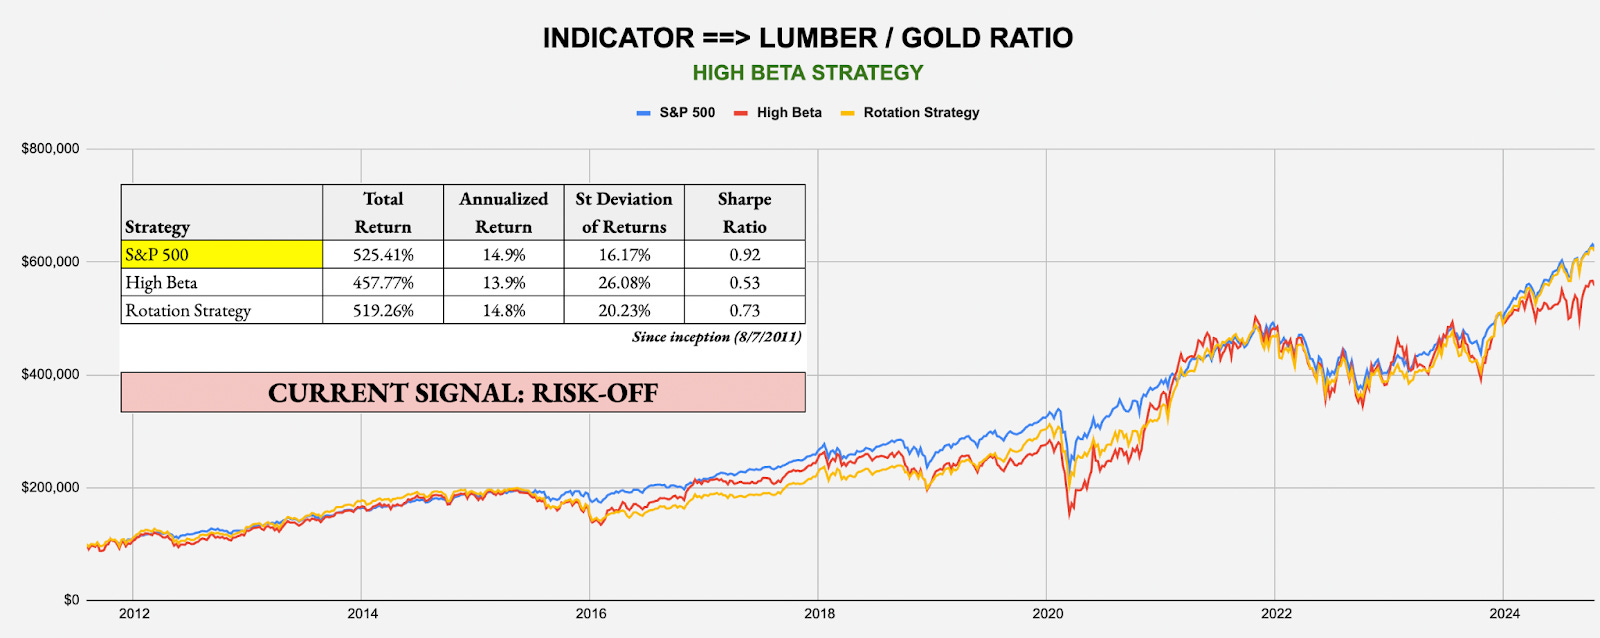
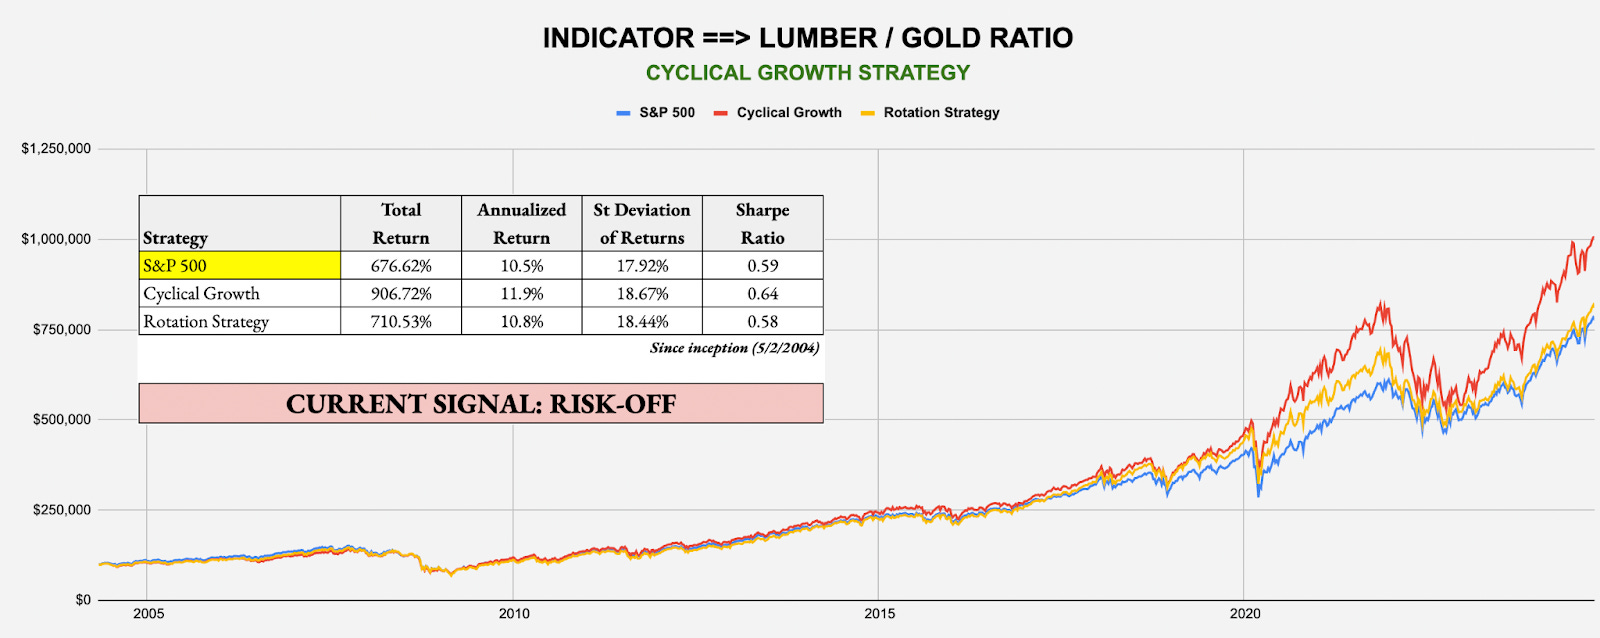
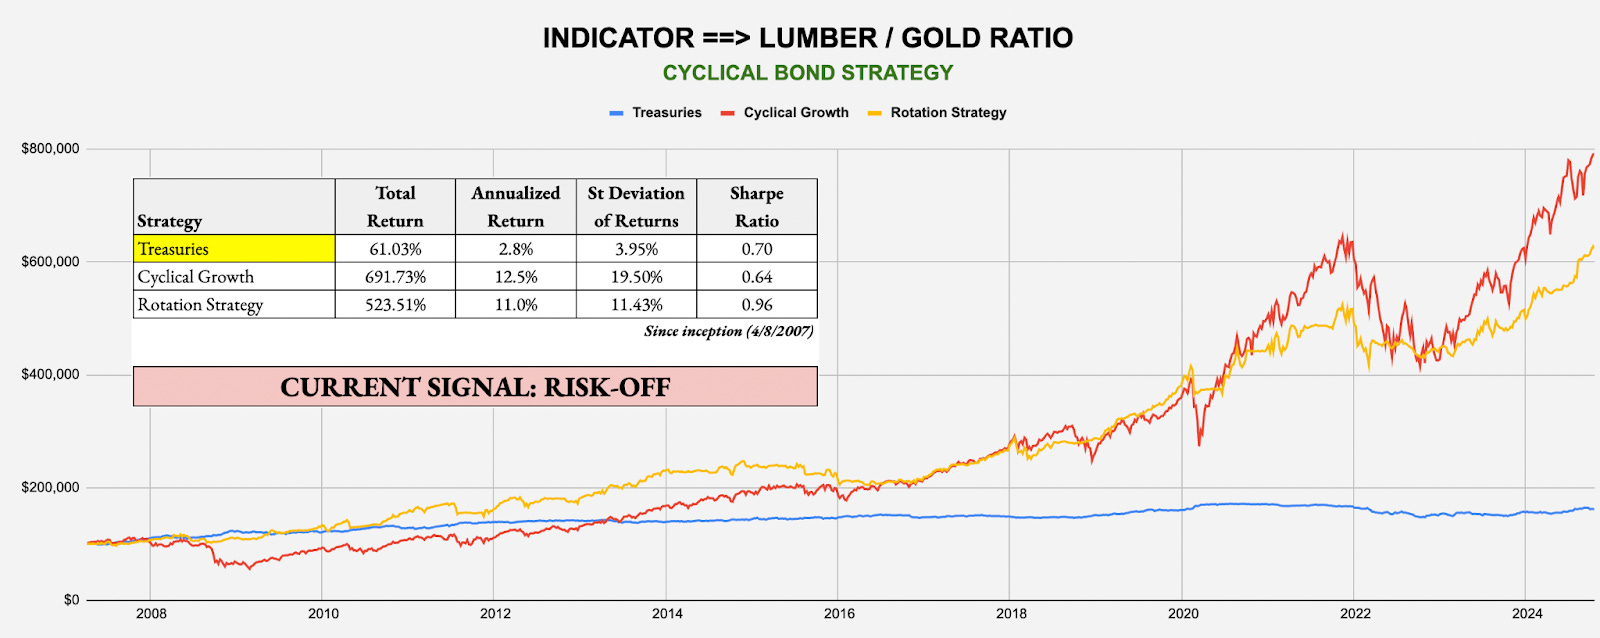
INTERMEDIATE-TERM SIGNAL: LUMBER/GOLD RATIO
Target Investor: Short- and long-term investors willing to trade more frequently using the classic cyclical vs. defensive asset comparison.
Current Indicator: Risk-Off
Strategy: Lumber/Gold Bond - Example: Invest in Treasuries (GOVT) over S&P 500 (SPY)
Strategy: Lumber/Gold Buy-Write - Example: Invest in Buy-Write (PBP) over S&P 500 (SPY)
Strategy: Lumber/Gold Low Volatility - Example: Invest in Low Volatility (SPLV) over S&P 500 (SPY)
Strategy: Lumber/Gold Small-Cap - Example: Invest in Large-Caps (SPY) over Small-Caps (VSMAX)
Strategy: Lumber/Gold High Beta - Example: Invest in S&P 500 (SPY) over High Beta (SPHB)
Strategy: Lumber/Gold Cyclical Growth - Example: Invest in S&P 500 (SPY) over Growth (VUG)
Strategy: Lumber/Gold Cyclical Bond - Example: Invest in Treasuries (GOVT) over Growth (VUG)
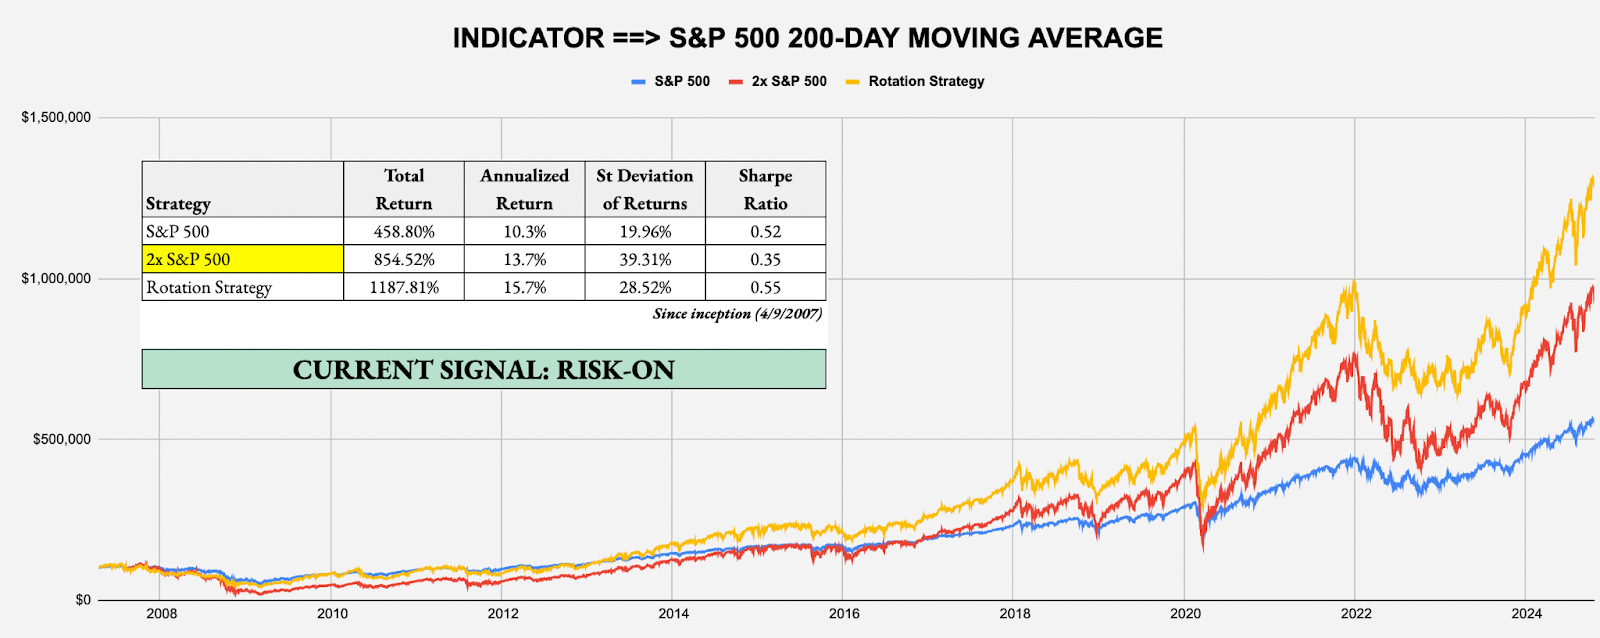
LONG-TERM SIGNAL: S&P 500 200-DAY MOVING AVERAGE
Target Investor: Long-term investors with a higher risk tolerance willing to move to an aggressive strategy when the signal flips to risk-on.
Current Indicator: Risk-On
Strategy: Leverage For The Long Run - Example: Invest in 2x-Leveraged S&P 500 (SSO) over S&P 500 (SPY)
About the Signals: The above trade signals and allocations are taken directly from each of the four award winning white papers I authored, which can be individually read at https://papers.ssrn.com/sol3/cf_dev/AbsByAuth.cfm?per_id=2224980. The underlying commonality across all risk-on/off signals and backtested strategies from these papers is the same: what matters isn’t being up more, but rather being down less. Each strategy historically has significantly outperformed through the avoidance of major drawdowns and volatile periods. The signals can change often from week to week, so it’s important to keep checking The Lead-Lag Report for updates. While not every trade and not every signal will be right, cumulatively over time, the identification of conditions that favor an accident in the stock market can help you slow down entering the storm, even if no one knows the exact mile marker where a crash might occur.
CONCLUSION
We’ll get some big catalysts over the next few weeks. Big tech earnings will hit in full force this coming week and the presidential election the week after that. In 2016, we saw a modest uptick in volatility following Trump’s first election win and we could see something similar happen again this time around. After an initial drop in equity prices, the S&P 500 rallied almost non-stop for more than a year and tacked on nearly 40%. I think the markets could be a little more prepared for a Trump win this time around, but I wouldn’t be surprised to see the VIX start to pick up again.
The Lead-Lag Report is provided by Lead-Lag Publishing, LLC. All opinions and views mentioned in this report constitute our judgments as of the date of writing and are subject to change at any time. Information within this material is not intended to be used as a primary basis for investment decisions and should also not be construed as advice meeting the particular investment needs of any individual investor. Trading signals produced by the Lead-Lag Report are independent of other services provided by Lead-Lag Publishing, LLC or its affiliates, and positioning of accounts under their management may differ. Please remember that investing involves risk, including loss of principal, and past performance may not be indicative of future results. Lead-Lag Publishing, LLC, its members, officers, directors and employees expressly disclaim all liability in respect to actions taken based on any or all of the information on this writing.