
Full Risk-On
All four intermarket signals agree: offense is the play. Trend, rotation, and commodities all aligned.

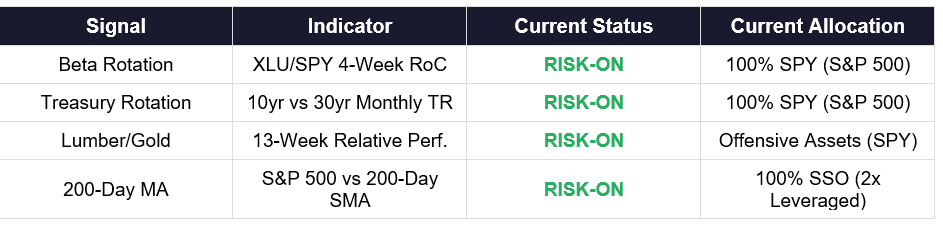
SIGNAL SUMMARY
Key Takeaways:
• Signal 1 (Beta Rotation) remains Risk-On for a second consecutive week, with the XLU/SPY 4-week RoC deepening to -10.04%. The S&P 500 continues to outperform Utilities as the risk-on rally broadens. SPY’s 4.5% weekly gain dwarfed XLU’s modest advance, widening the gap between offensive and defensive equities.
• Signal 2 (Treasury Rotation) holds Risk-On with March monthly data still in effect. TLT returned -4.55% versus IEF at -2.60%. Long-duration bonds continue underperforming intermediate maturities — a classic risk-appetite indicator. This signal will not update until April month-end data is available.
• Signal 3 (Lumber/Gold) has flipped to Risk-Off as gold surges to record highs. Gold’s 13-week return of +-6.99% now overwhelms lumber’s -2.10% decline. The relentless gold bid above $4,800/oz reflects persistent inflation fears, central bank accumulation, and residual geopolitical hedging — even as equities rally, the hard asset signal is flashing caution.
• The S&P 500 at 7,165.07 sits +6.9% above its 200-day SMA of 6,705.59, firmly in Risk-On territory. The index surged to its highest close since January, powered by a 4.5% weekly gain. Signal 4 remains Risk-On, maintaining allocation to SSO (2x leveraged S&P 500). The breakout above 7,000 for the first time since early February is technically significant.
MARKET COMMENTARY
The framework reads 3-1 Risk-On this week, leaning offensive but no longer unanimous. After last week’s rare 4-0 clean sweep, one signal has broken ranks: Lumber/Gold has flipped to Risk-Off as gold surges past $4,800/oz while lumber prices decline. The remaining three signals — Beta Rotation, Treasury Rotation, and the 200-Day Moving Average — all remain firmly Risk-On. The S&P 500 closed at 7,165.07, its highest level since January, capping a blistering 4.5% weekly gain that pushed the index above 7,000 for the first time since early February.
The week of April 14–17 extended the rally that began with the U.S.-Iran ceasefire. The S&P 500 surged 4.5% on the week, its best performance since November 2024. Breadth was solid but not unanimous — 8 of 11 sectors advanced, with Energy the notable laggard (down 3.4%) as crude prices collapsed. Technology led with an 8.2% gain as mega-cap growth names powered the Nasdaq up 6.8%. The Dow added 3.2%. The catalyst was a combination of better-than-expected Q1 earnings — 78% of reporting companies beat estimates on early tallies — and growing confidence that the ceasefire will hold. Bank earnings from Goldman Sachs, JPMorgan, and Citigroup all exceeded expectations, with trading revenue surging on the back of the crisis-driven volatility. Oil collapsed 8% on Friday alone, with crude plunging below $85/barrel after Iran declared the Strait of Hormuz “completely open” to commercial traffic, further easing inflationary pressures.
The rally’s breadth is remarkable. The S&P 500 has now recovered 12% from its March lows, reclaiming the 7,000 level that served as support in January and February. At 7,165.07, the index sits +6.9% above its 200-day SMA of 6,705.59, a comfortable margin that solidifies the bullish trend signal. The advance-decline line is at a multi-week high, and small caps (VSMAX) surged 4.6% on the week, outperforming large caps — a sign that risk appetite is broadening beyond the usual mega-cap leadership. The VIX collapsed to 17, its lowest reading since early March.
The Beta Rotation signal deepened its Risk-On reading, with the XLU/SPY 4-week Rate of Change falling to -10.04%. Utilities are being actively sold in favor of the broad market — SPY’s 4.5% weekly gain vastly outpaced XLU’s 1.7% decline. This is now the strongest offensive reading since January, and the signal is firmly allocating to SPY. The acceleration of the negative RoC suggests money is moving decisively out of defensive positions.
The Treasury Rotation signal holds Risk-On, still using March monthly data. TLT returned -4.55% versus IEF at -2.60%. The 30-year bond’s steeper decline continues to signal risk appetite in the curve. April month-end data will determine whether this signal persists — so far in April, both TLT and IEF have gained modestly as yields pulled back from their March peaks, with IEF (+0.51% MTD) narrowly outpacing TLT (+0.44% MTD). If that ordering persists through month-end, the signal will stay Risk-On in the May reading; if TLT re-accelerates past IEF by April 30, the signal would flip Risk-Off.
The Lumber/Gold signal is the week’s notable divergence. It has flipped to Risk-Off as gold’s relentless rally continues — the metal hit another record above $4,800/oz, delivering a 13-week return of +-6.99% versus lumber’s -2.10% decline. While equity markets celebrate the ceasefire and earnings strength, gold’s record-setting run tells a different story: persistent inflation fears, aggressive central bank buying, and a structural bid for hard assets that is not fading even as risk appetite returns. Lumber’s weakness reflects softening in housing starts and construction activity, a genuine economic signal. All seven Lumber/Gold sub-strategies have now rotated to defensive positioning.
The 3-1 reading is significant because it preserves the offensive posture while introducing a meaningful caveat. Gold’s outperformance is not a fleeting anomaly — it reflects structural forces (de-dollarization, inflation hedging, central bank reserve diversification) that may persist regardless of short-term equity direction. The historical record shows that when Lumber/Gold diverges from an otherwise Risk-On framework, it often signals that the equity rally is running on momentum and sentiment rather than broad economic improvement. Earnings season provides a test: if corporate guidance confirms economic resilience, the Lumber/Gold signal may prove a temporary outlier. If guidance disappoints, the gold signal may prove prescient.
SIGNAL 1: BETA ROTATION
Based on: “Opposing Behavioral Forces: Beta Rotation” (SSRN 2417974)
Target Investor: Self-directed investors who want to capture relative strength between equity market segments. This signal uses the 4-week rate of change of the Utilities-to-S&P 500 price ratio to determine whether the market favors offense (broad equity) or defense (Utilities).
CURRENT INDICATOR: RISK-ON
XLU/SPY 4-Week Rate of Change: -10.04%
Current Allocation: 100% SPY (S&P 500)

Growth of $100,000 | YTD from January 3, 2025 | Data: Lead-Lag Publishing, LLC
SIGNAL 2: TACTICAL RISK ROTATION
Based on: “A Quantitative Approach to Tactical Asset Allocation” (SSRN 2431022)
Target Investor: Conservative to moderate investors seeking a tactical overlay between equities and long-duration Treasuries. This signal compares the prior month total return of 10-year versus 30-year Treasury bonds to identify shifts in the yield curve’s risk appetite signal.
CURRENT INDICATOR: RISK-ON
30yr Treasury (TLT) March Return: -4.55%
10yr Treasury (IEF) March Return: -2.60%
Current Allocation: 100% S&P 500 (SPY)

Growth of $100,000 | Monthly Data from January 2025 | Data: Lead-Lag Publishing, LLC
