

Below is an assessment of the performance of some of the most important sectors and asset classes relative to each other with an interpretation of what underlying market dynamics may be signaling about the future direction of risk-taking by investors. The below charts are all price ratios which show the underlying trend of the numerator relative to the denominator. A rising price ratio means the numerator is outperforming (up more/down less) the denominator. A falling price ratio means underperformance.
LEADERS: JUNK BONDS ARE BACK TO UNDERPRICING REAL RISKS
Technology (XLK) – At The Whim Of Trade Policy
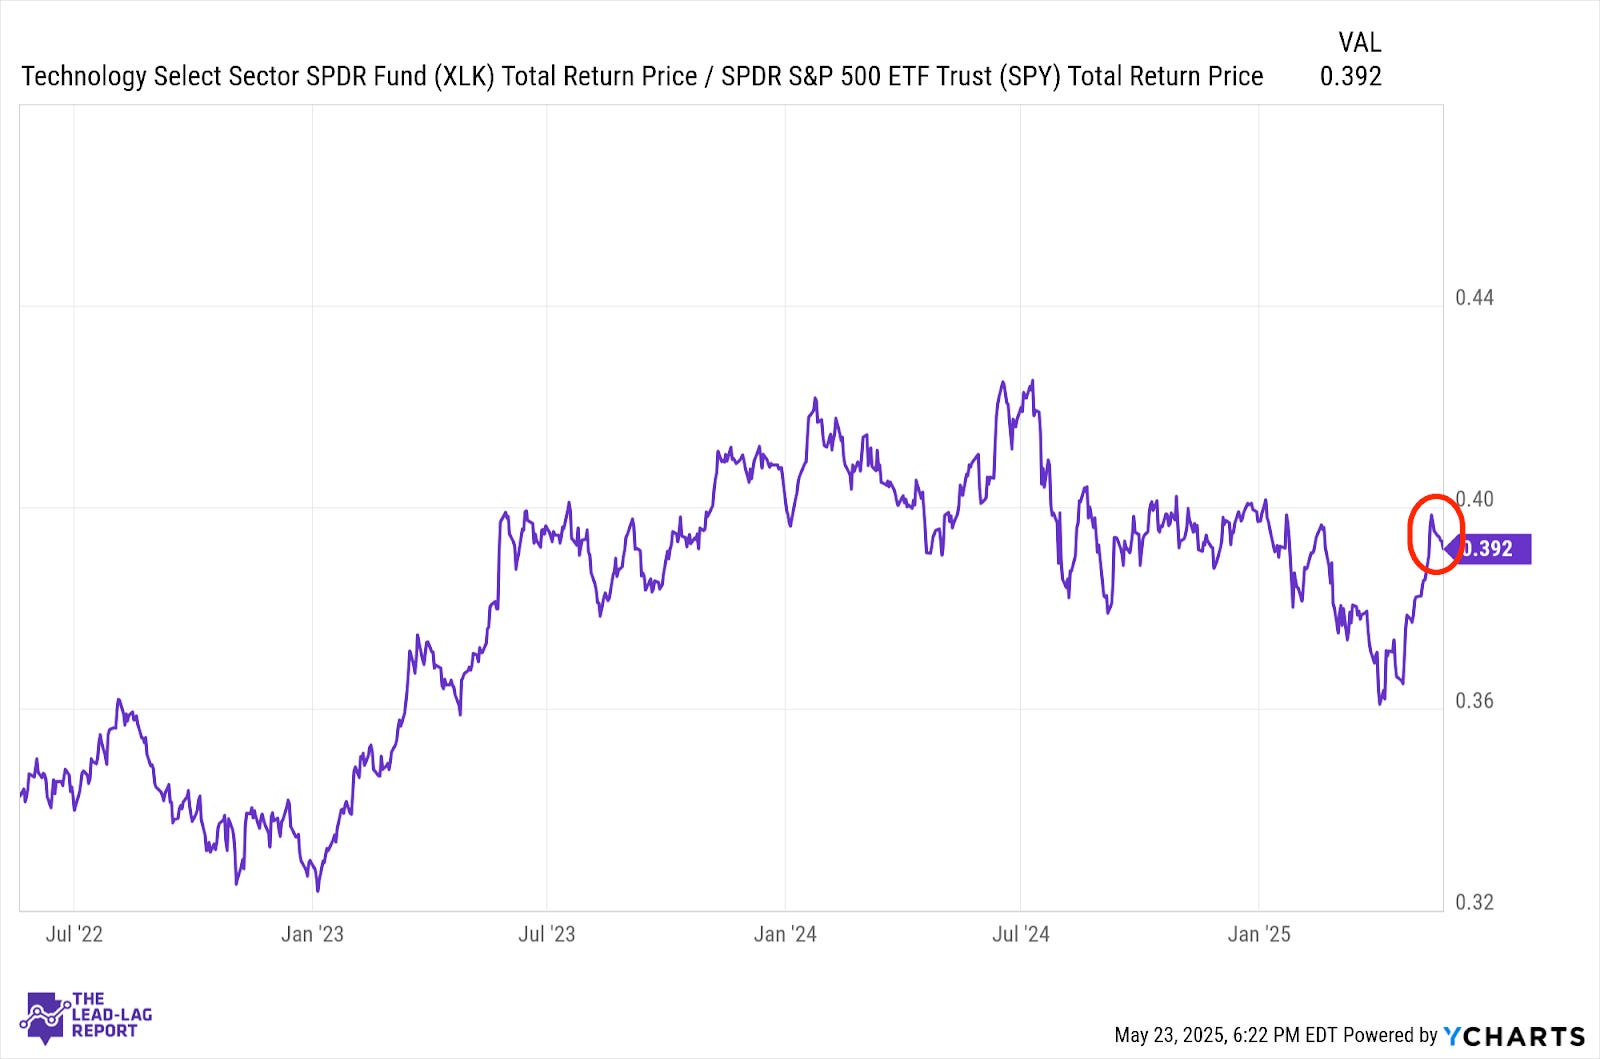
Tech & growth stock performance has been heavily dependent on the path of trade policy throughout 2025. That was back on display last week when Trump decided to again threaten high tariff rates, this time against the Eurozone and Apple. At this point, it’s almost impossible to figure out whether the White House feels progress on the trade front is being made or not, which probably means more whipsaws for equities.
Consumer Discretionary (XLY) – Cracks Starting To Show
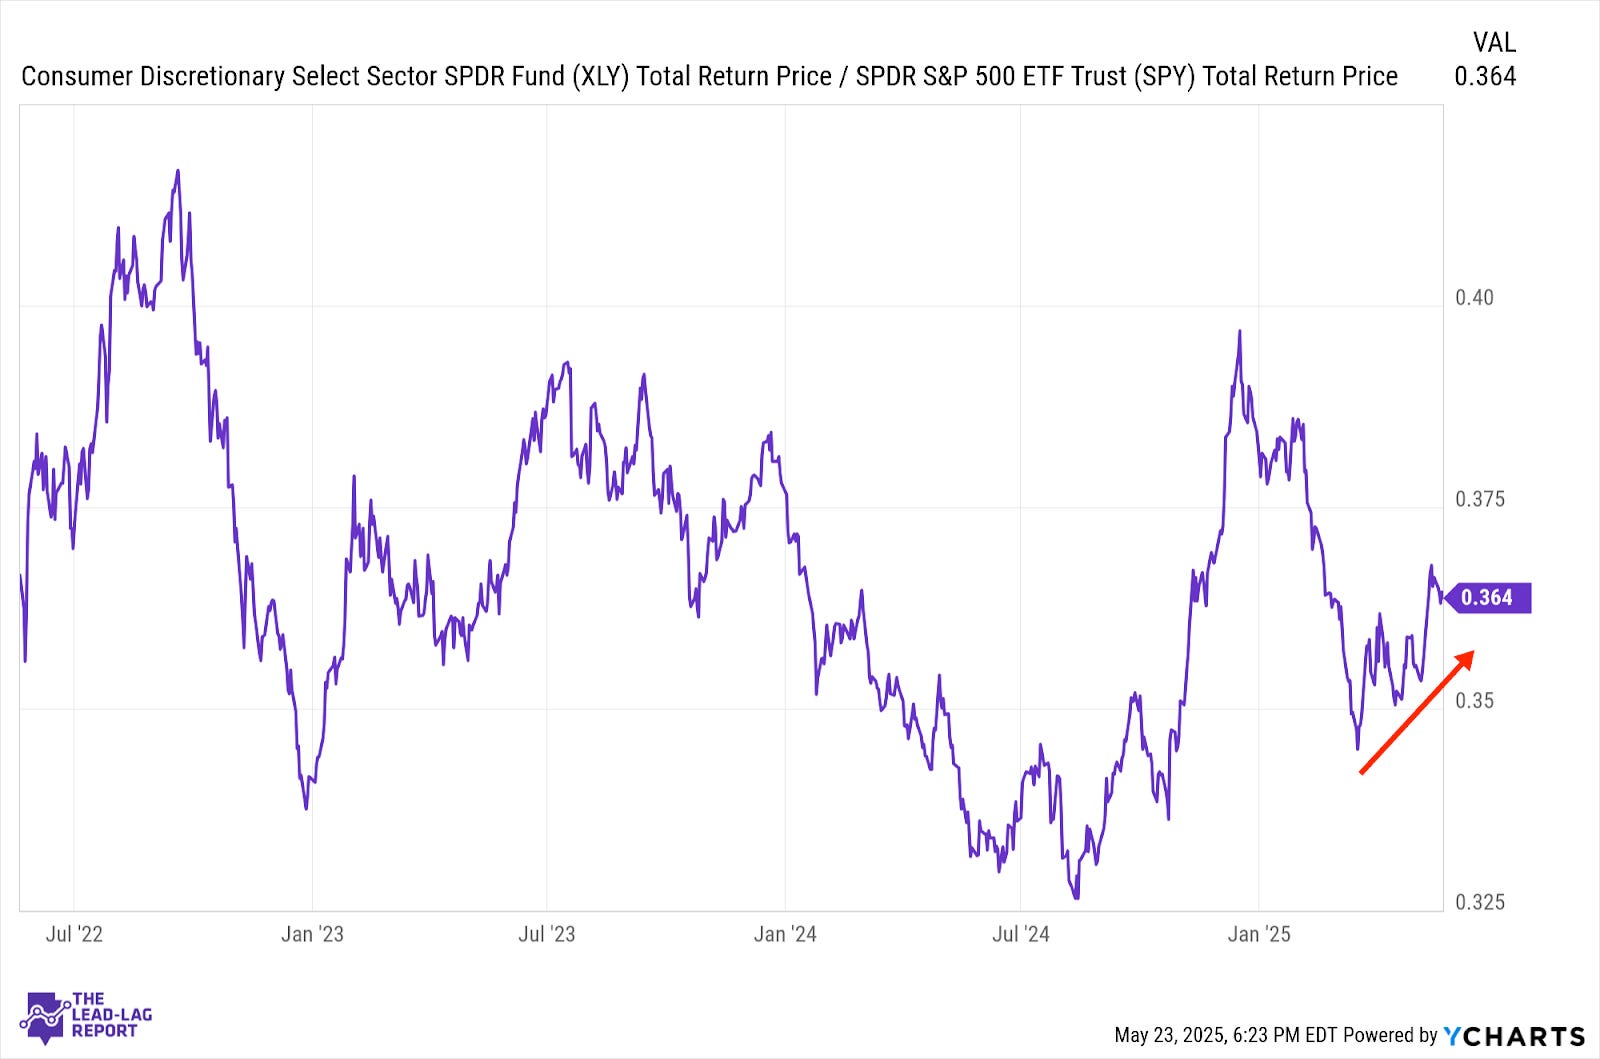
Discretionary stocks underperformed last week in response to the latest turn on the trade front, but the damage was relatively minimal. Overall, this sector looks like it’s still in an uptrend relative to the market, but it’s going to depend on the strength of the consumer going forward. So far, spending and the jobs market are holding up, but cracks are starting to show.
Industrials (XLI) – Withstanding Geopolitical Pressures
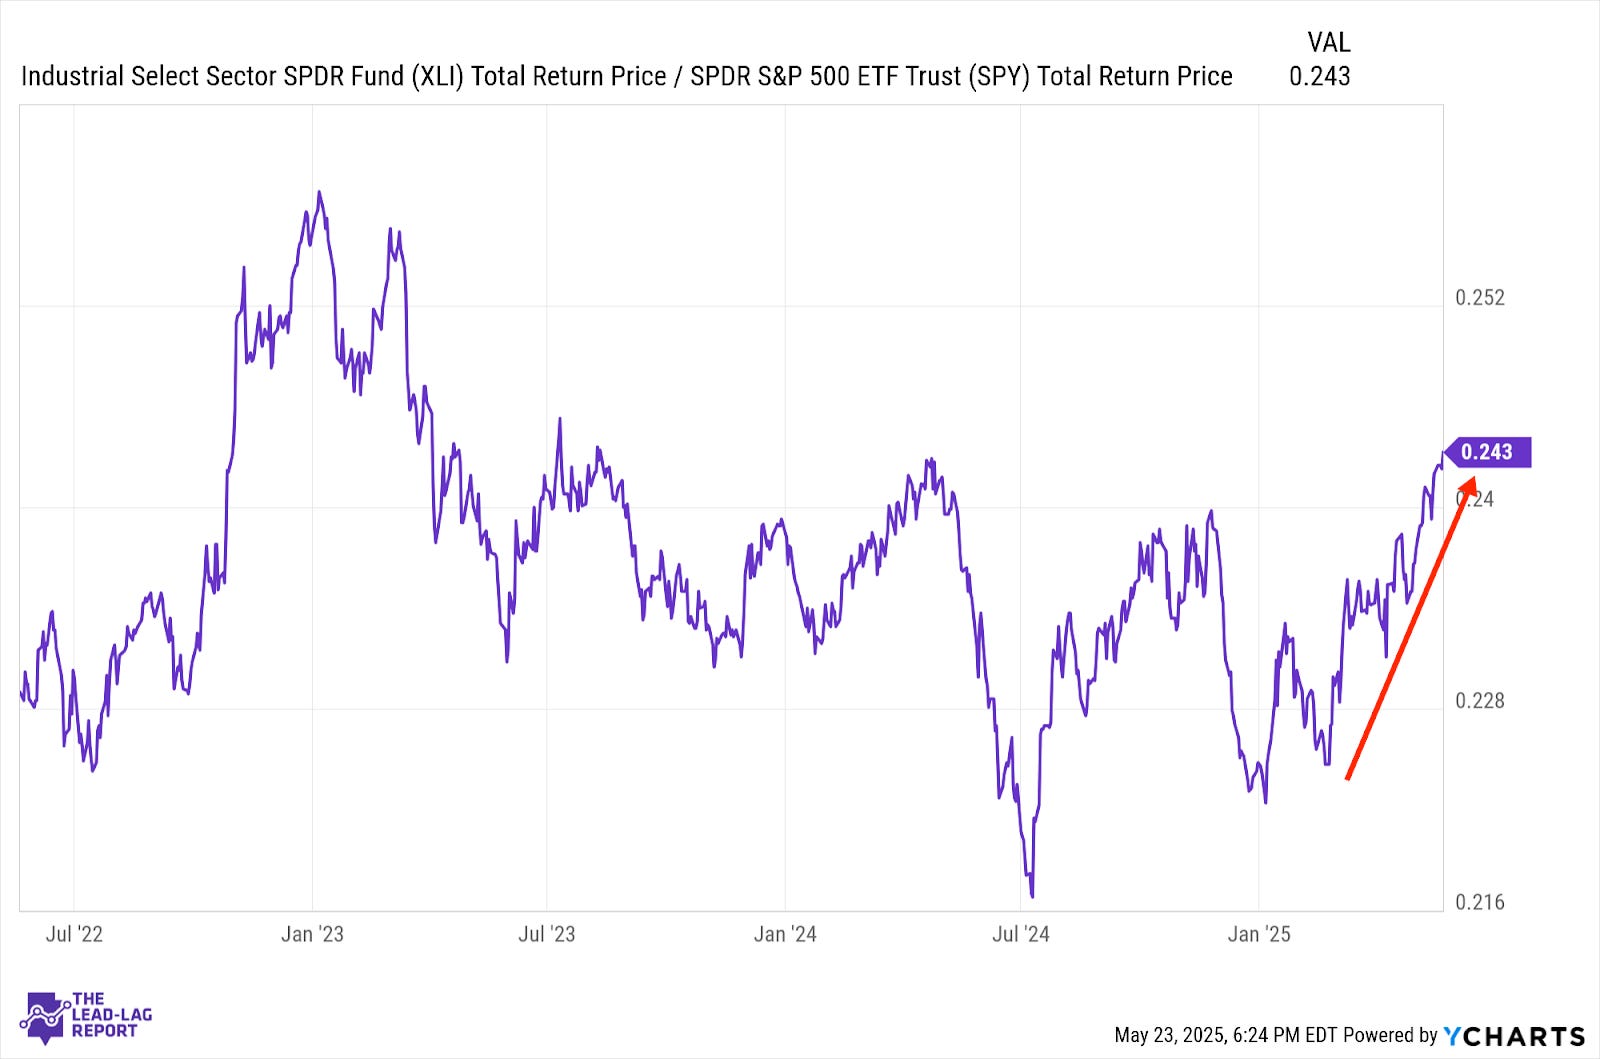
The steadiest outperforming sector without question in this recent cycle has been industrials. That’s perhaps a bit counterintuitive given how the Trump tariffs are going to disproportionately impact the manufacturing sector. Despite that, S&P Global says that manufacturing activity picked up again in the U.S. in May, demonstrating a further resilience in spite of geopolitical pressures.
Treasury Inflation Protected Securities (SPIP) – Getting Tougher To Gauge Direction
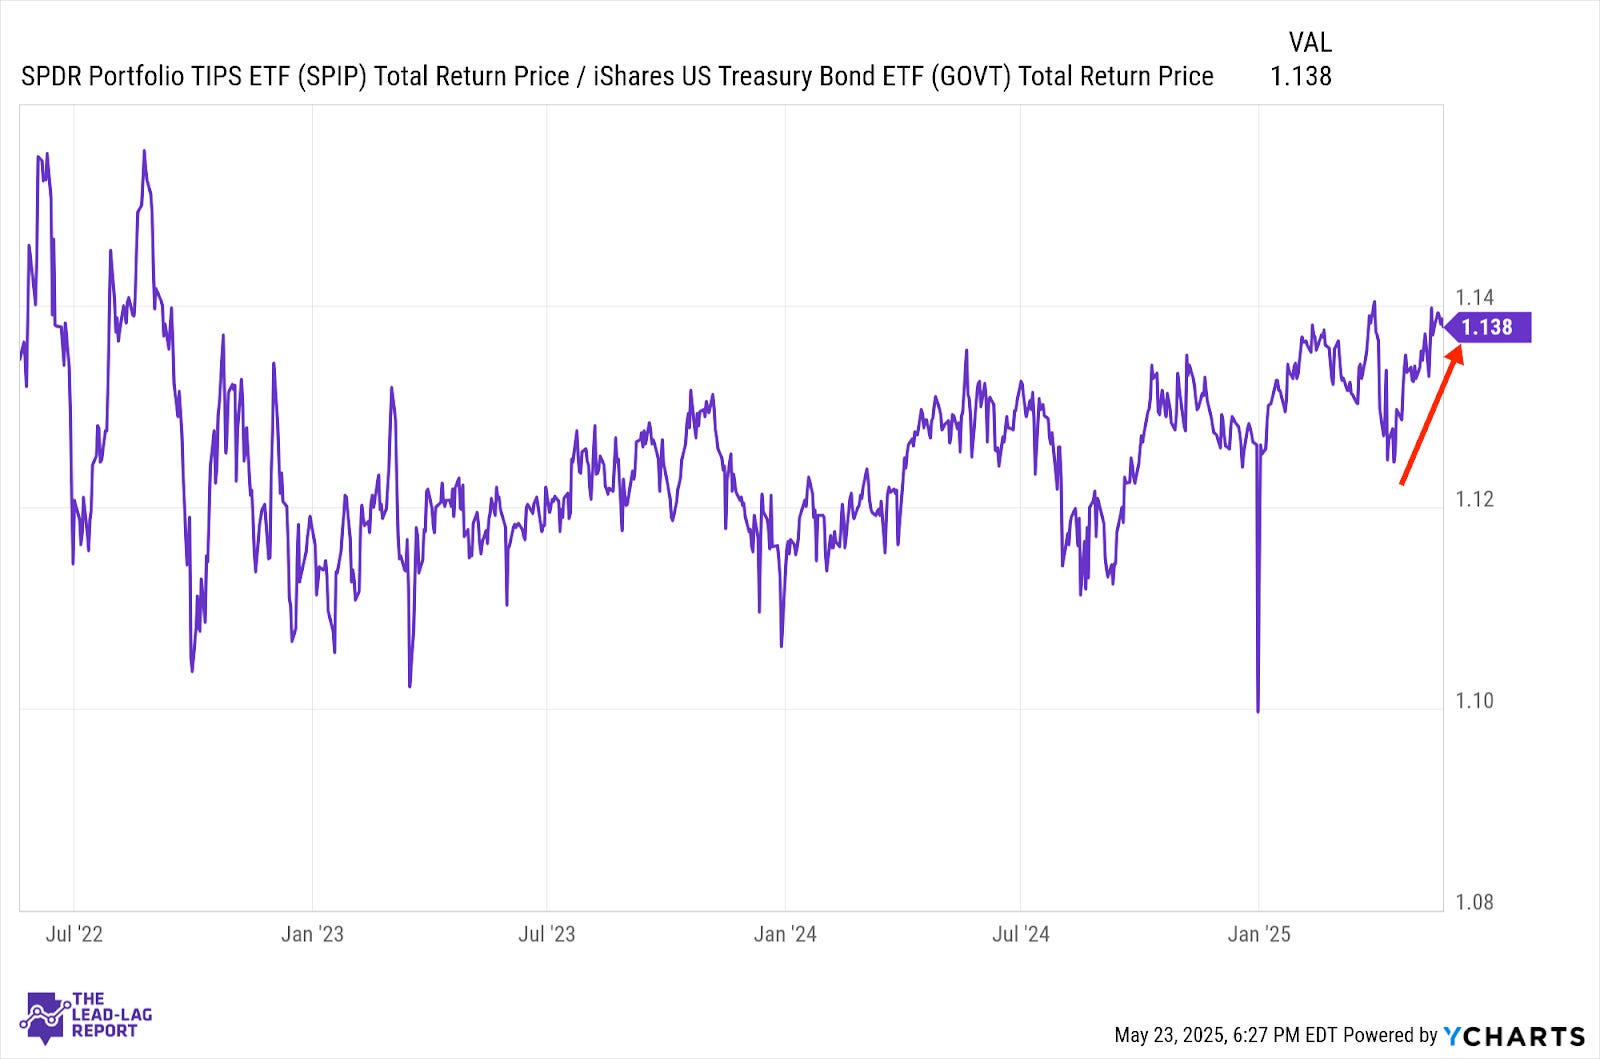
It’s been getting tougher gauging the future direction of inflation. Expectations for the remainder of 2025 are really high, but the hard data still has yet to show a meaningful uptick. Trump’s tariff plan seems to escalate and de-escalate on almost a weekly basis. It’s challenging for investors and institutions to try to assess if inflation is a real threat here. But the likely passage of the Trump tax cut bill adds another inflationary catalyst to the mix.
Junk Debt (JNK) – A Real Disconnect
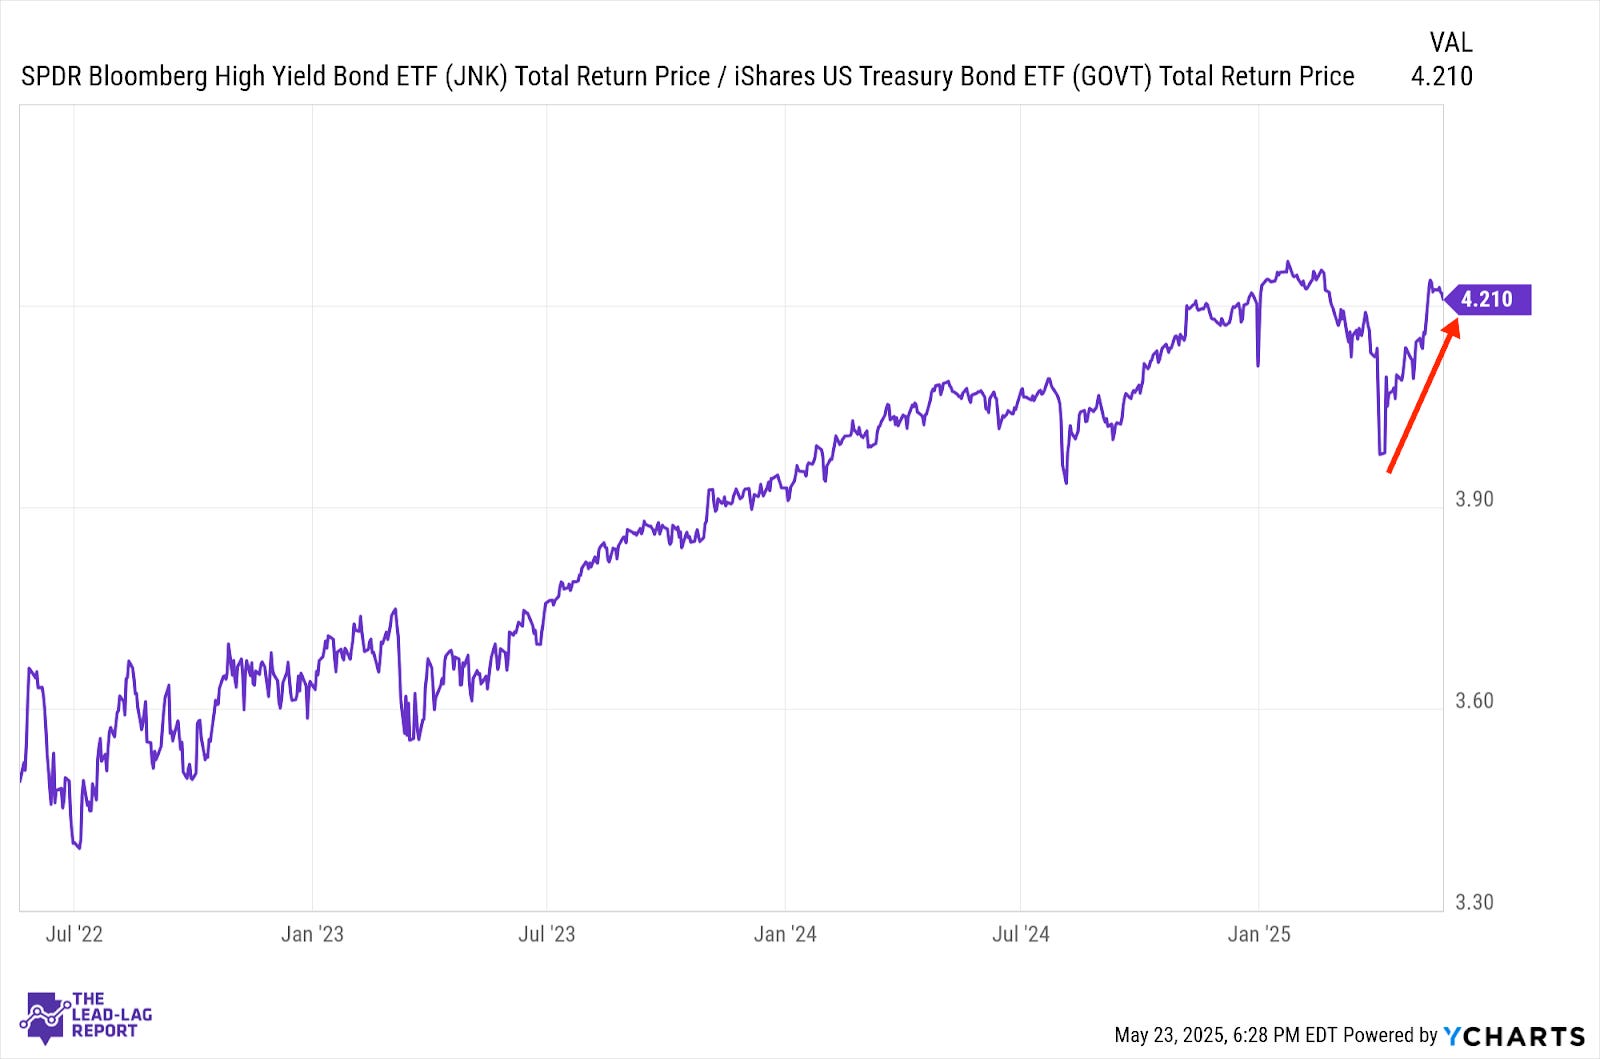
Junk bonds quickly regained the mantle of bond market leadership in the wake of U.S.-China tariff easing and it has yet to really give it up. High yield spreads have come down considerably since the tariff pause and investors are largely back to believing there isn’t much risk to be found in fixed income. There’s a real disconnect between the volatility, uncertainty and manipulation actually at play in the bond market versus what investors believe the case to be.
Europe, Australasia, and the Far East (EFA) – All Over The Place
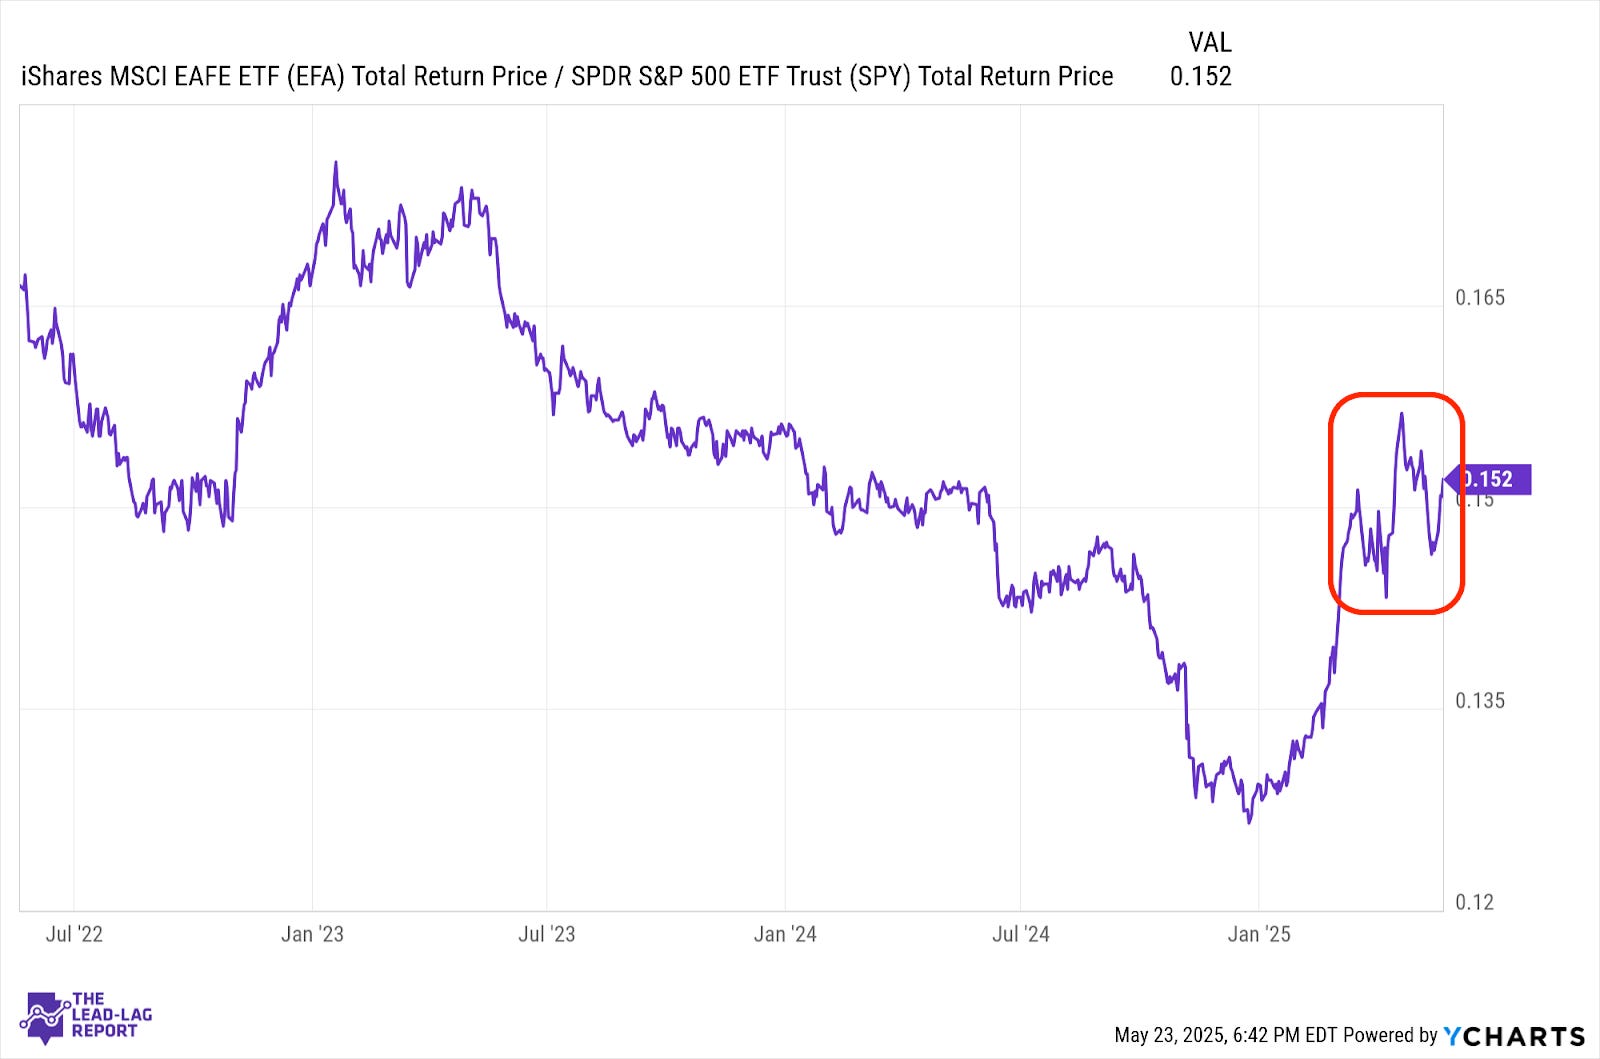
Relative to the S&P 500, international stocks have seen their performance bounce all over the place, usually following the sentiment of the moment related to trade conditions. If the ballooning U.S. federal debt continues to be a focus of the market, foreign stocks might be comparatively better positioned moving forward. The value is certainly there as well.
Emerging Markets (EEM) – A Stock Picker’s Market
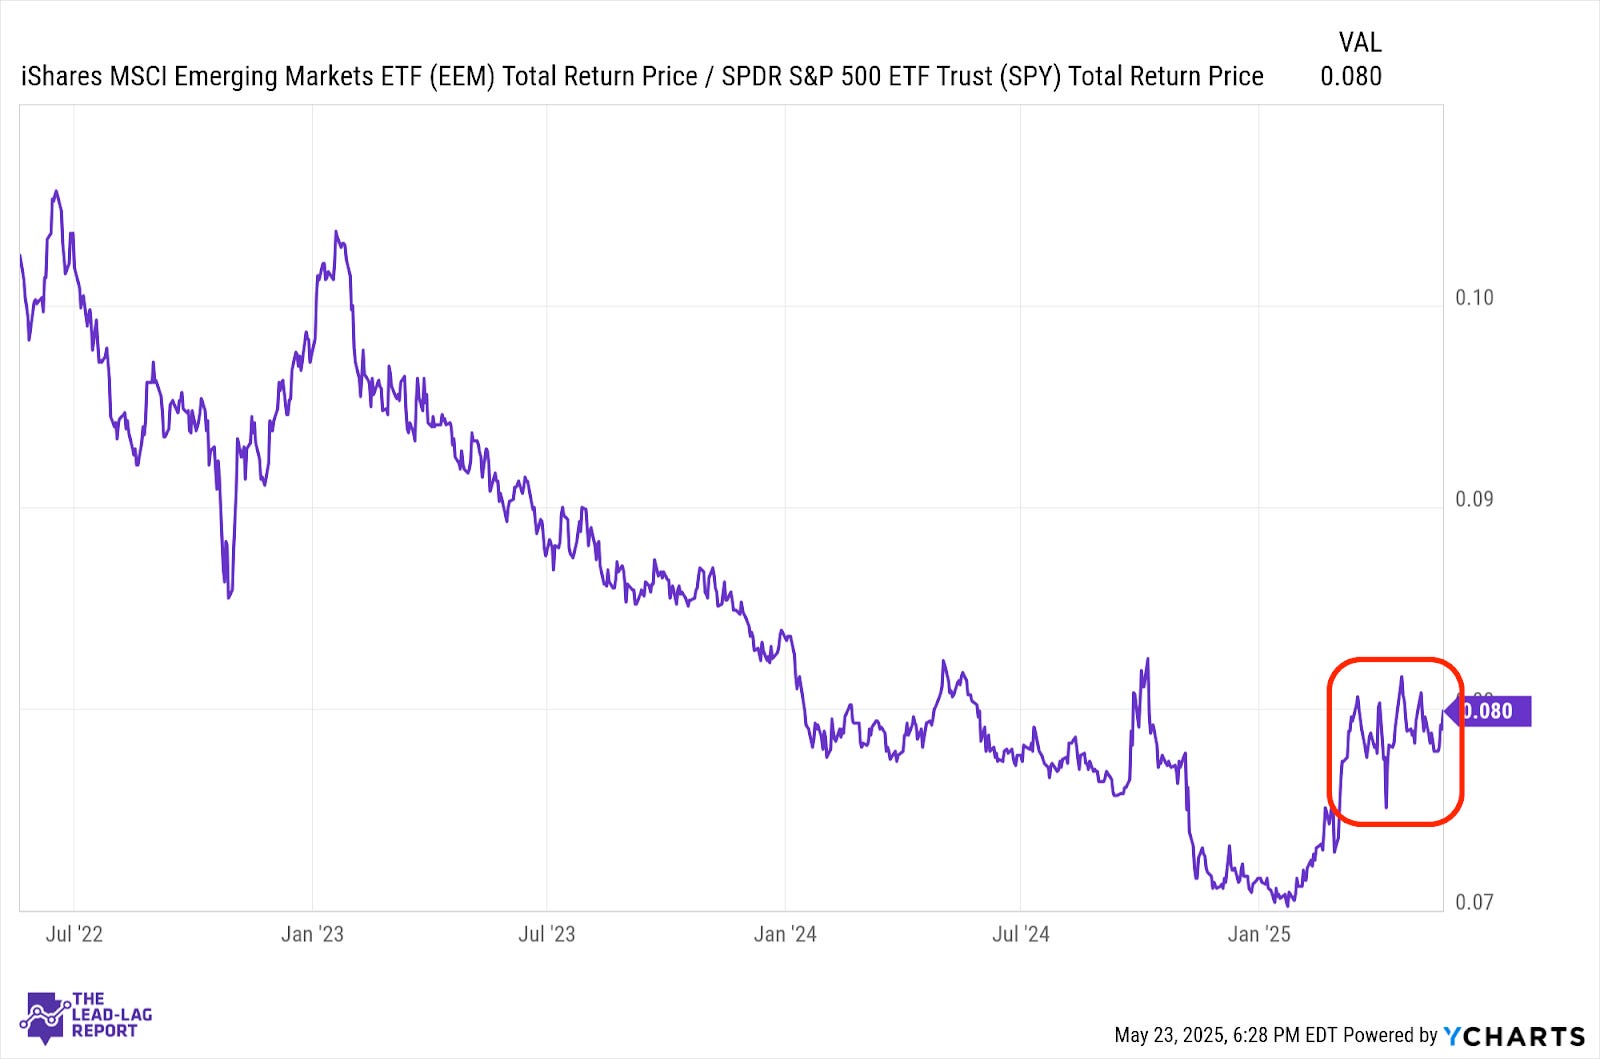
Emerging markets remain volatile above all else, but clearly influenced by global trade trends and China’s outsized weight in the index. This group remains an interesting value play and could draw some interest if trade tensions re-escalate, as they did in the first quarter of this year. There are also a wide range of individual narratives within this group that could make it a stock picker’s market.
European Banks (EUFN) – Income Prospects Improving
