

Key Highlights
Gold’s surge above $5,000 has been historically extreme, raising short-term risk concerns.
Long-term valuation measures, including the Dow-to-Gold ratio, suggest gold may still be early in a secular cycle.
Whether gold has “topped” depends far more on an investor’s time horizon than on the latest price level.
A Parabolic Rally Tests Investors’ Nerves
Gold’s recent price action has been nothing short of extraordinary. In late January 2026, the metal crossed the $5,000-per-ounce threshold for the first time, then surged beyond $5,500 within days.¹ By the end of the month, gold was trading near $5,400, cementing one of the most dramatic advances in its modern history.²
Put into context, the magnitude of the move is striking. Gold rose roughly 64 percent in 2025, its strongest annual performance since the late 1970s, followed by another sharp gain in the opening weeks of 2026.³ Such a near-vertical ascent has understandably triggered both excitement and unease among investors.
Market observers have not been subtle in their characterization of the rally. Commentators have repeatedly described gold’s trajectory as “parabolic,” warning that price action of this speed often reflects emotionally driven positioning rather than steady accumulation.⁴ Volatility has surged alongside prices, with large intraday swings becoming common. These conditions frequently emerge when an asset becomes crowded and speculative interest accelerates.
The forces behind the move are not mysterious. Gold has benefited from a convergence of macroeconomic and geopolitical anxieties: persistent inflation concerns, renewed doubts about fiscal discipline, heightened global tensions, and a weakening U.S. dollar.⁵ Unpredictable policy signals and trade rhetoric have further undermined confidence in traditional financial anchors. In that environment, gold has reasserted its role as a perceived store of value when faith in paper assets wavers.
That said, short-term market history offers a clear warning. Moves that unfold this quickly often correct sharply, even if the broader trend remains intact. Indeed, gold has already shown signs of instability, retreating abruptly after brief excursions above recent highs. For traders focused on weeks or months, the risk of a meaningful pullback appears elevated after such a rapid advance.
A Century-Long Context: The Dow-to-Gold Ratio
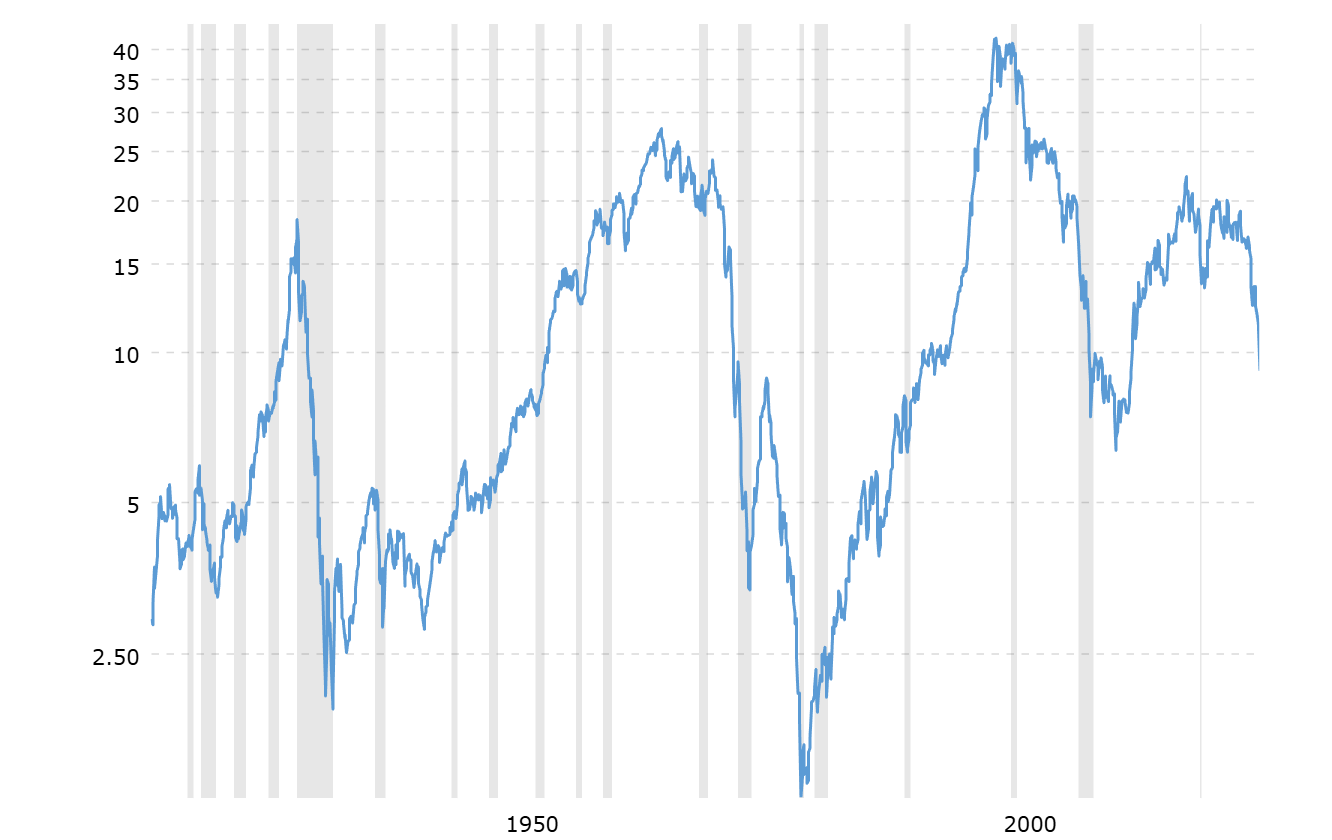
Source: Macrotrends.net
Determining whether gold has truly “topped” requires stepping back from the price chart and viewing the metal in a longer historical framework. One of the most enduring valuation tools for this purpose is the Dow-to-Gold ratio, which measures how many ounces of gold are required to equal the level of the Dow Jones Industrial Average.⁶
Over the past century, this ratio has traced clear secular cycles. High readings have tended to coincide with periods of equity optimism and economic confidence, while low readings have emerged during episodes of financial stress, inflation, or systemic uncertainty. In 1929, just before the Great Depression, the ratio peaked near 19. It reached roughly 29 during the equity boom of the mid-1960s and soared to nearly 45 at the height of the dot-com bubble in 1999.⁷
Conversely, the ratio has collapsed during major resets. In 1932, amid widespread bank failures and deflation, it fell near 2. In 1980, during a period marked by runaway inflation and collapsing confidence in fiat currencies, the ratio briefly approached parity, with gold prices roughly matching the Dow index level.⁸
Today, despite gold’s explosive rally, the Dow-to-Gold ratio has again moved into low single-digit territory, a zone historically associated with major shifts in the financial landscape.⁹ Importantly, this measure had been trending downward for years before gold’s most recent surge, suggesting that the metal’s outperformance may reflect a broader structural rebalancing rather than a purely speculative spike.
