Iran Struck. Oil Spiked. Vol Refused to Panic.
Is the vol-selling machine still bigger than the geopolitical shock function?

Today’s Lead-Lag Report post is sponsored by Figure
Unlock Cash Without Selling Your Crypto
Your crypto strategy shouldn’t pause when you need liquidity. With Figure’s Crypto-Backed Loan, you can borrow against your BTC, ETH, or SOL without selling a single coin — keeping your portfolio intact and your upside open.
Why Crypto Holders Choose Figure
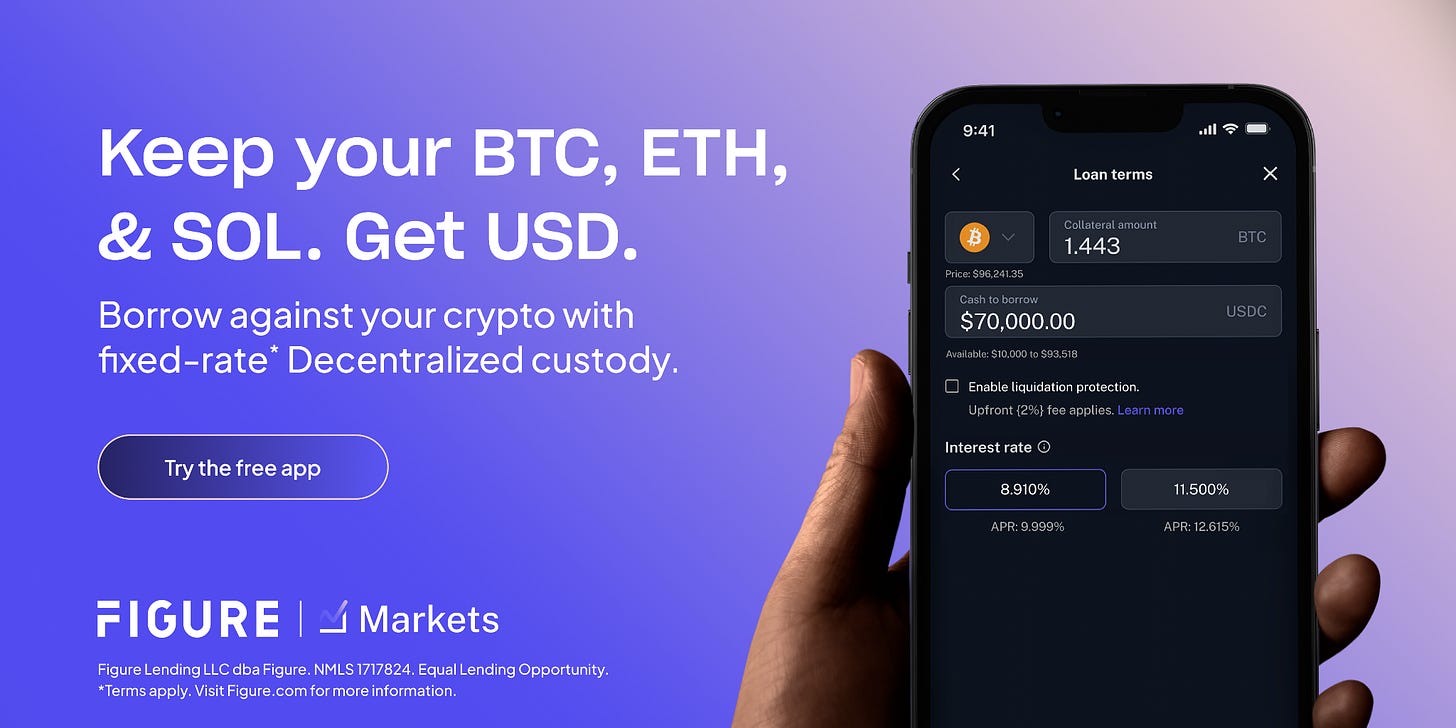
Figure offers one of the market’s lowest fixed-rates for crypto backed loans at 8.91% (9.999% APR), letting you turn dormant digital assets into working capital. Every loan features a 50% fixed LTV, 12-month term, and zero prepayment penalties, giving you flexibility and predictability from day one.
And unlike most lenders, Figure uses decentralized MPC custody. Your collateral stays in a segregated, on-chain verifiable MPC wallet, meaning you retain control and transparency. No pooled custody. No hidden rehypothecation risk. Just trust backed by cryptographic proof.
How It Works
Deposit your BTC, ETH, or SOL. Instantly access a USD loan at a low fixed rate while your crypto remains securely stored and visible on-chain. Because you’re borrowing rather than selling, you avoid taxable events and maintain exposure to future appreciation.
Key Benefits
- Ultra-low rate: 8.91% interest (9.999% APR)*
- Collateral options: Bitcoin, Ethereum, Solana
- Term: 12 months, no prepayment or deferral fees
- Custody: Decentralized MPC - transparent, verifiable, segregated
- Protection: Liquidation Protection helps safeguard your position during sudden market drops
Primary Use Cases: Immediate liquidity, tax-efficient leverage, refinancing, or accessing capital without disrupting long-term holdings
Why It Matters
This is the bridge between traditional finance structure and DeFi transparency. By pairing low, fixed rates with on-chain verifiable collateral, Figure gives crypto holders a smarter, safer way to access cash - without compromising their investment strategy.
Ready to unlock liquidity and keep every coin working for you?
Apply now and get started with Figure’s Crypto-Backed Loan.
Disclosures:
Figure Lending LLC dba Figure 650 S. Tryon Street, 8th Floor, Charlotte, NC 28202. 888) 819-6388. NMLS ID 1717824. For licensing information go to www.nmlsconsumeraccess.org. Equal Opportunity Lender
Digital currency is not legal tender, is not backed by the government, and BIA accounts are not subject to FDIC or SIPC protections.
Crypto loans are offered to U.S. borrowers by Figure Lending LLC. This product is not available to U.S. residents of DC, ID, IL, KY, MD, MS, SD, TX, VT, or VA.
Crypto loans are offered through Figure Markets Credit LLC to residents of the state of New York and to international customers except in the following jurisdictions: Crimea (Ukraine), Donetsk (Ukraine), Luhansk (Ukraine), Afghanistan, Albania, Belarus, Central African Republic ,Congo (the Democratic Republic), Cuba, Ethiopia, Haiti, Iran (Islamic Republic of), Iraq, Lebanon, Libya, Mali, Myanmar (Burma), Nicaragua, Nigeria, North Korea (Democratic People’s Republic of), Pakistan, Palestine (State of), Russia, Somalia, South Sudan, Sudan, Syria, Ukraine, Venezuela, Yemen, or Zimbabwe.
Figure Markets Credit LLC. 650 S. Tryon Street, 8th Floor, Charlotte, NC 28202. (888) 926-6259. NMLS ID 2559612. For licensing information, go to www.nmlsconsumeraccess.org.
Figure Payments Corporation offers self-directed investors and traders cryptocurrency services. It is neither licensed with the SEC or the CFTC nor is it a Member of NFA. Figure Payments Corporation’s NMLS ID number is 2033432, and is located at 100 West Liberty Street, Suite 600, Reno, NV., 89501. You can verify Figure Payments licensing status at the NMLS Consumer Access website. Click here for Figure Crypto’s state license and regulatory disclosures.
*The interest rate on Figure’s Crypto-Backed Loan is 8.91% (9.999% APR) at 50% LTV or 11.50% (12.62% APR) up to 75%. The advertised Annual Percentage Rate (APR) is based on a $5,000 loan amount and contemplates the payment of 1% origination fee, which would yield a monthly payment of $42.47. Rates will be higher for applications secured by assets with a higher LTV ratio. The Figure Crypto-Backed Loan has a 12 month interest-only repayment term and allows for a maximum initial LTV ratio of 75%. Interest rates change frequently so your exact interest rate will depend on the date you apply and may depend on many factors such as LTV ratio.
DISCLAIMER — PLEASE READ: This is sponsored advertising content for which Lead-Lag Publishing, LLC is being paid a fee. The information provided is solely the creation of Figure. Lead-Lag Publishing, LLC does not guarantee the accuracy or completeness of the information provided or make any representation as to its quality. All statements and expressions provided are the sole opinion of Figure and Lead-Lag Publishing, LLC expressly disclaims any responsibility for action taken in connection with the information provided.
Iran Struck. Oil Spiked. Vol Refused to Panic.
Key Highlights
· US Central Command resumed strikes on Iran on July 7 and July 8 after Hormuz tanker attacks, sending Brent up 6.6% intraday to $79.07 and pushing the 3-2-1 crack spread to a record $64.58/bbl.
· The VIX peaked at only 16.90 on the strike day and closed the week at 15.03, materially lower than the 19.23 close reached during the April 2024 Iran episode and the 23.16 close during the October 2024 escalation.
· High-yield credit spreads widened just three basis points on the day of the strikes (274 to 270 to 267 to 270 bps across the week), refusing to price geopolitical stress even as Hormuz tanker traffic collapsed from 125-140 daily vessels to roughly 40.
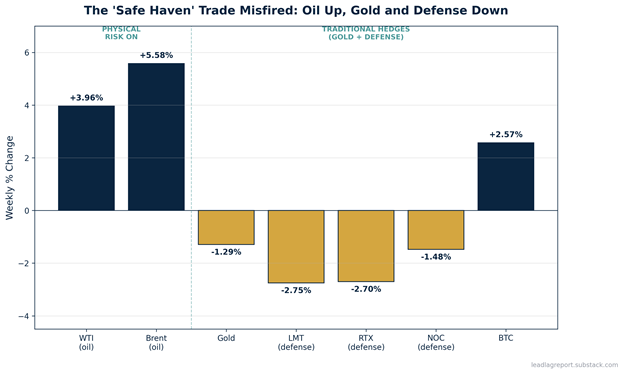
· Traditional hedges misfired: gold fell 1.29% on the week, every major defense stock closed lower (LMT -2.75%, RTX -2.70%, NOC -1.48%), and bitcoin rallied 2.57%; the war trade priced like a risk-on episode, not a flight to safety.
Thesis Status
Standing thesis: The structural bid for short volatility, driven by systematic vol-selling strategies, dispersion trades, and the sheer weight of premia-suppression capital, has become large enough to absorb geopolitical shocks that would have moved markets meaningfully a decade ago.
This week’s evidence: A genuine kinetic escalation between the United States and Iran, with an oil supply chokepoint partially disrupted, produced a VIX peak below the level of the anticipatory Iran fear trade in April 2024. Credit refused to blink. Gold and defense, the textbook hedges, went the wrong way.
Margin of confidence: Rising. The three data points I would have expected to break simultaneously (VIX, HY OAS, gold) all failed to. That is not one anomaly. That is a system.
What would break it: A sustained Hormuz closure beyond four to six weeks, a coordinated OPEC+ response, or a single US casualty event that forces a broader mobilization. Any of these would shift the risk from a policy-managed geopolitical spike to a persistent supply and demand shock, and the vol-selling infrastructure is not designed for persistence.
Cross-Asset Weekly Changes
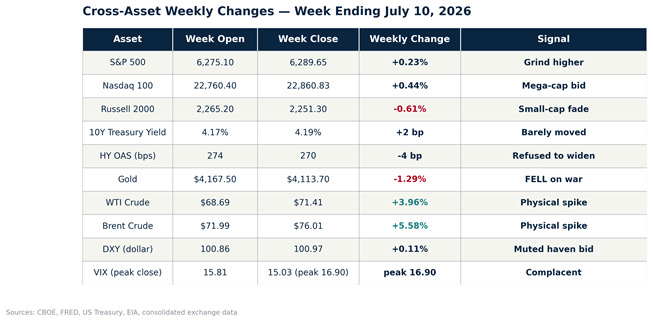
Table 1: Cross-asset weekly changes, week ending July 10, 2026. / Every risk asset closed flat to higher while every traditional hedge closed weaker. / Source: CBOE, FRED, US Treasury, EIA, consolidated exchange data.
The Surface Narrative
The week reopened a conflict that markets had convinced themselves was contained. On the morning of July 7, US Central Command resumed strikes against Iranian military targets following a coordinated attack on commercial tanker traffic in the Strait of Hormuz. By the following day, CENTCOM had disclosed strikes against roughly 90 additional Iranian sites, and four oil and gas tankers had turned back from the strait entirely. By July 9, Iran claimed retaliatory strikes on US bases in Bahrain, Kuwait, Qatar, and Jordan’s Azraq facility; US Central Command reported no material damage. By July 10, President Trump publicly stated that “the ceasefire is over,” even as the White House affirmed that the underlying memorandum of understanding remained operative.
The oil market did exactly what the playbook said it should. Brent jumped $4.91 on July 8 to $79.07, a 6.6% single-session gain. WTI added $4.27 to $74.71. Refined product margins told an even sharper story: the 3-2-1 crack spread hit a record $64.58 per barrel, and diesel margins pushed above $60 per barrel for the first time since the 2022 dislocation. The Strategic Petroleum Reserve drew 6.166 million barrels for the week ending July 3, leaving it at 319.489 million.
Read only through oil, this was a serious event. The physical market did what the physical market does. Refiners bid frantically for crude they could turn into diesel and gasoline. Shipping desks in Singapore and Rotterdam re-routed cargoes around the Cape of Good Hope. Insurance underwriters raised war-risk premiums on Persian Gulf hulls by an order of magnitude within twenty-four hours. Every desk that touches physical oil was, by mid-week, operating in crisis mode.
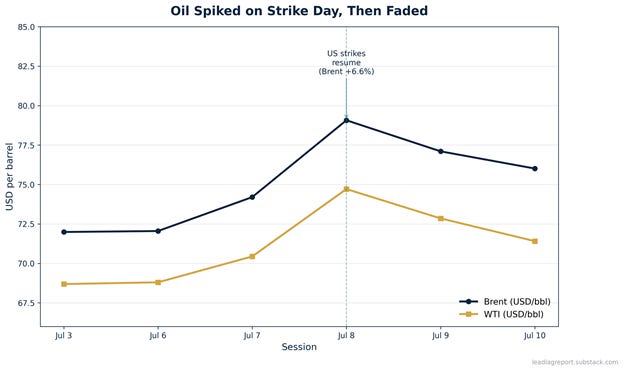
Figure 1: WTI and Brent daily settles, July 3 to July 10, 2026. / Physical oil obeyed the geopolitical playbook and spiked on strike day before fading. / Source: US EIA, ICE, week ending July 10, 2026.
The Real Catalyst
The real story is what did not happen everywhere else.
Consider the volatility complex. The CBOE VIX opened Monday at 15.81, closed Tuesday at 16.13, and peaked on the strike day at 16.90 before finishing Friday at 15.03. The VVIX, the volatility of VIX itself, spiked to 91.38 on July 8 and closed the week at 87.28. The SKEW Index, which measures the market’s demand for out-of-the-money puts, reached 149.79 on the strike day, elevated but not extreme.
Now compare the historical analogs. In April 2024, when the market was pricing an anticipatory Iran conflict, the VIX closed as high as 19.23 with an intraday peak of 21.36. In October 2024, when Iran launched ballistic missiles at Israel, the VIX closed at 23.16. This week, with actual US strikes, tanker attacks, retaliatory claims on US bases, and a formal statement from the President that the ceasefire had collapsed, the VIX could not push through 17.
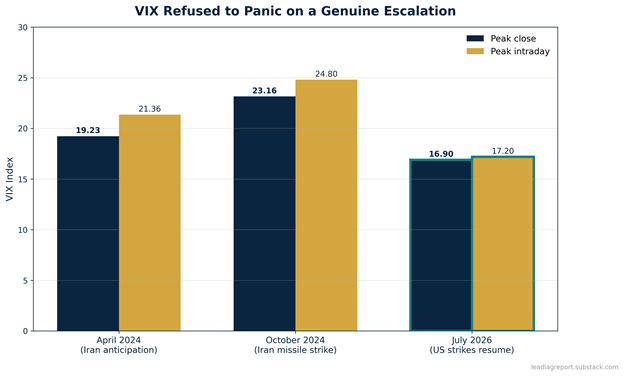
Figure 2: VIX peaks across the last three Iran-related escalations. / A more direct escalation produced a materially lower vol response than either 2024 episode. / Source: CBOE, week ending July 10, 2026.
Credit markets showed the same refusal. High-yield option-adjusted spreads moved from 274 basis points on Monday to 270 by mid-week, to a low of 267, and back to 270 by Friday. A three basis point round trip during a week that included direct US-Iran kinetic exchange is not a normal reaction function. Ten-year Treasury yields moved from 4.17% to 4.19% across the week, with a brief flight-to-quality dip to 4.15% on the strike day. That is noise, not signal.
There is a mechanical explanation and a behavioral one, and they reinforce each other. The mechanical story is that the systematic vol-selling complex, dispersion strategies, variance swap sellers, structured note issuers, zero-day option overwriters, has grown large enough that any short-term VIX spike is met with an immediate, price-insensitive supply of implied volatility for sale. The behavioral story is that after roughly two years of headlines resolving faster than the option chain expected, the marginal trader has been conditioned to treat geopolitical spikes as opportunities to sell premium rather than reasons to buy protection. Every prior fade has trained the next fade. That is exactly the structure that produces the widest gap between physical stress and financial calm.
The policy response only amplified the signal. On July 7, the Treasury’s Office of Foreign Assets Control revoked General License X and re-imposed the full sanctions architecture on Iran’s financial infrastructure. On July 10, State and Treasury jointly sanctioned Ali Ansari and thirteen other individuals connected to Iran’s shadow banking network. These are meaningful escalations. Yet the term structure of implied volatility barely re-priced them.
Divergences Beneath the Surface
The most instructive divergences were in the assets that should have benefited most from the shock.
Gold, the archetypal geopolitical hedge, closed the week down 1.29% from $4,167.50 to $4,113.70. On the strike day itself, gold did not rally; it drifted lower. Every major defense contractor traded lower on the week: Lockheed Martin fell 2.75%, Raytheon Technologies dropped 2.70%, Northrop Grumman lost 1.48%, General Dynamics slipped 0.48%, and Leidos declined 1.56%. The dollar, which the world reflexively bids in geopolitical crises, rose only 0.11% on the DXY. USD/JPY continued to trade near a 40-year yen low at 162.41, a yen-carry configuration, not a haven configuration.
Bitcoin, meanwhile, rallied 2.57% on the week. Whether one accepts bitcoin as a hedge or as a risk asset, its behavior this week was unambiguous: it traded like a risk-on speculative instrument, not like digital gold.
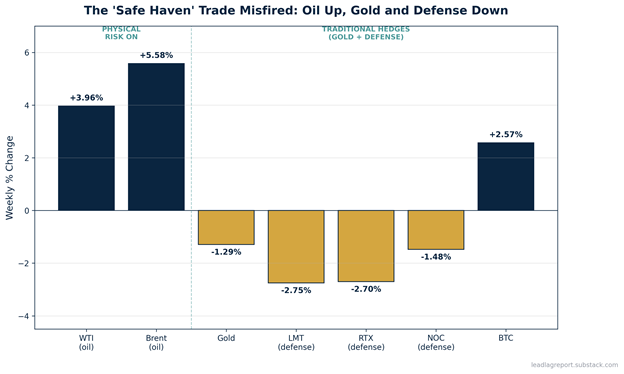
Figure 3: Weekly percentage change by asset class, week ending July 10, 2026. / Physical risk assets rallied while gold and every major defense name closed lower on a week of active US-Iran strikes. / Source: consolidated exchange data.
Read those five signals together, gold down, defense down, dollar flat, yen weakening, bitcoin up, and the market was not pricing a geopolitical escalation. It was pricing a policy-managed news cycle that would resolve in a matter of days, and it was continuing to fund short-volatility positions right through it.
The defense stock behavior deserves a closer look. In prior Iran episodes, the defense sector traded as a reliable directional hedge on Middle East escalation. April 2024 and October 2024 both produced multi-day defense rallies that outperformed the S&P 500 by 200 to 400 basis points over the escalation window. This week, the sector lagged the tape. That happens when either the market believes the conflict will be resolved through diplomacy and stockpile drawdowns rather than new procurement, or when defense multiples had already priced in a permanent geopolitical premium that leaves little room for further re-rating. Both interpretations point in the same direction: the marginal buyer of geopolitical risk hedges is not currently in the defense complex.
Gold is even more revealing. Central bank buying has been the dominant marginal bid in the gold market for the past two years. When gold falls during a genuine escalation, it usually means either that leveraged positioning was so long that any pause in the news cycle triggered a stop cascade, or that dollar strength and rising real yields overwhelmed the safe-haven bid. The former is structural. The latter is macro. Neither is a sign that gold is functioning as an active geopolitical hedge in the traditional sense.
The Bank of Israel cut its policy rate 25 basis points to 3.5% on July 6, one day before the US strikes. A cutting central bank in the country at the epicenter of the conflict, that is not the fiscal or monetary posture of an economy expecting a prolonged war. The signal from the sovereign that has the most information is that the situation is manageable. Markets took the same view.
So What
The question is not whether the vol-selling infrastructure is impressive. It is. The question is whether the confidence embedded in it, the confidence that any geopolitical spike is a fade, is actually calibrated to the size of the tail risk that Hormuz represents. Roughly 20% of global oil supply moves through that strait. Tanker traffic dropped from 125-140 daily vessels to 40 on July 9. LNG carriers resumed on July 10, but insurance and rerouting costs are already climbing.
The vol-selling machine is designed for mean reversion. It profits when the world resolves itself faster than the option chain implies. It bleeds when reality persists longer than the theta decay.
So what: The signal of the week is not that credit and vol were resilient. The signal is that the distance between what the physical oil market is telling you and what the derivatives complex is telling you has become wider than at any point in the post-2022 cycle. That gap eventually closes, either because the geopolitical situation resolves and physical prices come down to meet vol, or because the situation persists and vol finally catches up to physical. History suggests both paths eventually clear. What history does not tell you is how sharply the second path clears when it does.
Signals lead. Markets lag. The gap between them is where the opportunity lives.
Sources
1. “US oil prices jump after US military launches strikes against Iran,” Reuters, July 7, 2026.
2. “Fuel markets flash supply crunch despite calmer oil prices,” Reuters, July 9, 2026.
3. CBOE VIX Historical Data, Cboe Global Markets, week ending July 10, 2026.
4. ICE BofA US High Yield Index Option-Adjusted Spread, Federal Reserve Economic Data, week of July 6, 2026.
5. “Oil tanker traffic through Hormuz near standstill as attacks strain Iran truce,” Reuters, July 9, 2026.
6. Daily equity closes from consolidated exchange data, week ending July 10, 2026.
7. “Four oil, gas tankers turn back from Hormuz Strait after vessel attacks,” Reuters, July 8, 2026.
8. “Iran-Israel war liveblog, July 9, 2026,” The Times of Israel, July 9, 2026.
9. “Iran-Israel war liveblog, July 10, 2026,” The Times of Israel, July 10, 2026.
10. US Weekly Crude Oil Ending Stocks in the Strategic Petroleum Reserve, Energy Information Administration, week ending July 3, 2026.
11. Daily Treasury Par Yield Curve Rates, US Department of the Treasury, week of July 6, 2026.
12. “More LNG, Japan-linked vessels transit Hormuz despite renewed Mideast tensions,” Reuters, July 10, 2026.
13. “Treasury Revokes General License X and Sanctions Iranian Financial Networks,” US Department of the Treasury, Office of Foreign Assets Control, July 7, 2026.
14. “US Squeezes Iran’s Regime Financiers and Shadow Banking Networks,” US Department of State, Office of the Spokesperson, July 10, 2026.
15. “The Monetary Committee Decides on July 6, 2026, to Lower the Interest Rate to 3.5 Percent,” Bank of Israel, July 6, 2026.
Disclosure
The Lead-Lag Report is provided by Lead-Lag Publishing, LLC. All opinions and views mentioned in this report constitute our judgments as of the date of writing and are subject to change at any time. Information within this material is not intended to be used as a primary basis for investment decisions and should also not be construed as advice meeting the particular investment needs of any individual investor. Trading of securities may not be suitable for all types of investors. All investing involves risk, including loss of principal. Past performance is no guarantee of future results. This is not an offer to buy or sell any security.