
Jobs Cracked, Yields Climbed, Credit Stayed Calm
What happens when the Fed loses its labor argument but the bond market refuses to celebrate?

Today’s Lead-Lag Report post is sponsored by Columbia Threadneedle
What if you could target only the strongest performers in an index?
Columbia Research Enhanced Core ETF (RECS) leverages our firm’s quantitative research by investing in our highest-rated stocks from the Russell 1000. The result is an ETF with reduced drag and enhanced return potential at an attractive price point.
Potential benefits of RECS:
· Aims to optimize core equity exposure
· Sector-neutral to the Russell 1000
· Competitive expense ratio of 15 basis points1
1 Net and gross expense ratio. The fund’s expense ratio is from the most recent prospectus.
Investors should carefully consider the investment objectives, risks, charges and expenses of the Fund before investing. To obtain a prospectus containing this and other important information, please visit https://www.columbiathreadneedleus.com/etf to view or download a prospectus. Read the prospectus carefully before investing.
Investing involves risks, including the risk of loss of principal. Market risk may affect a single issuer, sector of the economy, industry or the market as a whole. The fund is passively managed and seeks to track the performance of an index. There is no guarantee that the index and, correspondingly, the fund will achieve positive returns. Risk exists that the index provider may not follow its methodology for index construction. Errors may result in a negative fund performance. The fund’s net asset value will generally decline when the market value of its targeted index declines. The fund concentrates its investments in issuers of one or more particular industries to the same extent as the underlying index. Investments in a narrowly focused sector may exhibit higher volatility than investments with a broader focus. Investments selected using quantitative methods may perform differently from the market as a whole and may not enable the fund to achieve its objective. Investment in larger companies may involve certain risks associated with their larger size and may be less able to respond quickly to new competitive challenges than smaller competitors. Investments in mid-cap companies often involve greater risks that investments in larger companies and may have less predictable earning and be less liquid than the securities in larger firms. Growth securities, at times, may not perform as well as value securities or the stock market in general and may be out of favor with investors. Value securities may be unprofitable if the market fails to recognize their intrinsic worth or the portfolio manager misgauged that worth. Although the fund’s shares are listed on an exchange, there can be no assurance that an active, liquid or otherwise orderly trading market for shares will be established or maintained. The Fund may have portfolio turnover, which may cause an adverse cost impact. There may be additional portfolio turnover risk as active market trading of the fund’s shares may cause more frequent creation or redemption activities that could, in certain circumstances, increase the number of portfolio transactions as well as tracking error to the Index and high levels of transactions increase brokerage and other transaction costs and may result in increased taxable capital gains.
ETF shares are bought and sold at market price (not NAV) and are not individually redeemable. Investors buy and sellshares on a secondary market. Shares may trade at a premium or discount to the NAV. Only market makers or “authorized participants” may trade directly with the Fund(s), typically in blocks of 50,000 shares.
Shares are not FDIC insured, may lose value, and have no bank guarantee.
For broker/dealer or institutional use only.
Columbia Management Investment Advisers, LLC serves as the investment manager to the ETFs. The ETFs are distributed by ALPS Distributors, Inc., which is not affiliated with Columbia Management Investment Advisers, LLC, Columbia Management Investment Distributors, Inc. or its parent company Ameriprise Financial, Inc. Columbia Management Investment Distributors, Inc., LLC (Member FINRA | SIPC) is a marketing agent for the ETFs. Columbia Threadneedle Investments is the global brand name of the Columbia and Threadneedle group of companies.
DISCLAIMER – PLEASE READ: This is sponsored advertising content for which Lead-Lag Publishing, LLC has been paid a fee. The information provided in the link is solely the creation of Columbia Threadneedle. Lead-Lag Publishing, LLC does not guarantee the accuracy or completeness of the information provided in the link or make any representation as to its quality. All statements and expressions provided in the link are the sole opinion of Columbia Threadneedle and Lead-Lag Publishing, LLC expressly disclaims any
Jobs Cracked, Yields Climbed, Credit Stayed Calm
KEY HIGHLIGHTS
• June payrolls rose +57K versus roughly 115K expected, while April and May were revised lower by a combined -74K.1
• July hike odds fell from about 29% to about 18% after the payroll report, even as the 10Y yield finished near 4.49%.1,5
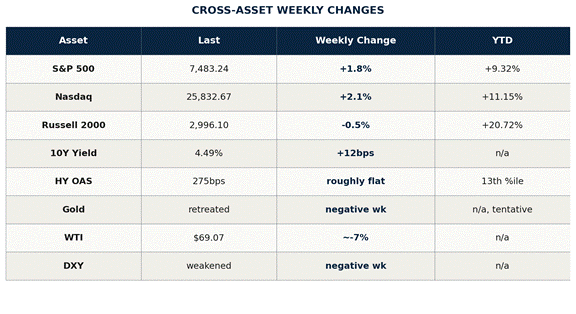
• The S&P 500 rose +1.8% to 7,483.24, while the Nasdaq gained +2.1% to 25,832.67.2
• The Russell 2000 fell -0.5% to 2,996.10 while high yield OAS held near 275bps, around the 13th percentile.2,3
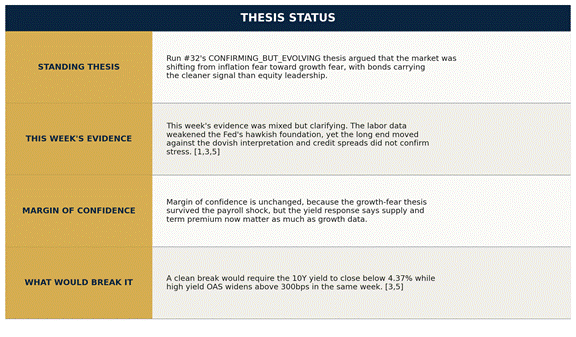
THESIS STATUS
CROSS-ASSET WEEKLY MOVES
The Surface Narrative
Last week’s watch item was simple: Russell had to hold its outperformance over Nasdaq into the holiday close for the rotation thesis to keep gaining force. It failed. Russell fell while Nasdaq roared back, and the spread that had looked like a regime shift became a reversal.2
That failure matters because it changes the question. Run #32 treated small-cap strength as possible evidence that the market was moving beyond mega-cap dependency. This week, the tape said not yet. Mega-cap AI leadership reasserted itself, and the small-cap rotation paused before it could become a durable broadening signal.2
The surface narrative is easy to write. Equities finished the shortened week firm, with the S&P 500 and Nasdaq higher while the Dow reached a record close. The market looked through a weaker labor print, embraced a lower expected Fed path, and kept rewarding the large-cap growth complex.2
June payrolls rose by +57K against roughly 115K expected, the biggest miss of the year. That should have been enough to challenge the premise behind the June hawkish dot plot.1
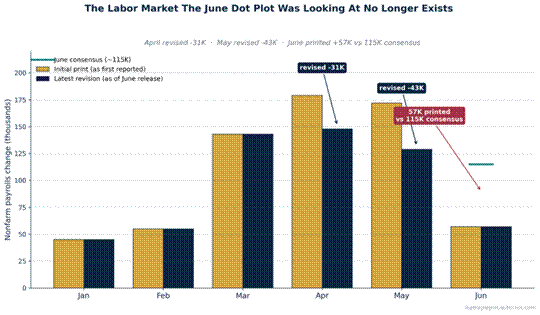
Figure 1: Payroll Miss Breaks the Dot-Plot Foundation / The June labor print made the hawkish policy path harder to defend, but it did not produce a clean duration rally. / Source: BLS Employment Situation and CNBC June jobs report, July 2, 2026
The prior two months were revised lower by a combined -74K. The labor market the Fed thought it was seeing at the prior meeting no longer exists in the same form.1
The consensus interpretation is that weaker payrolls are good for risk because they reduce policy pressure. That is reasonable. July hike odds fell from about 29% to about 18%, which means the front-end policy narrative moved in the direction equity bulls wanted.1
That is the surface. The surface is incomplete. The problem is not that equities rose on dovish news. The problem is that the part of the market that should have rallied most did not.
The Real Catalyst
The real catalyst was not the jobs miss. It was the long end’s refusal to validate the jobs miss.
The ten-year yield rose about 12 basis points to 4.49% into news that should have pushed duration the other way. That is the week’s central contradiction.5
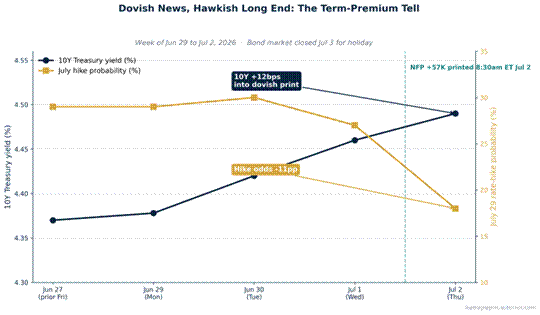
Figure 2: Dovish Odds, Higher Yields / The long end rose into softer labor data, shifting the story from Fed hawkishness to term premium and supply. / Source: Barchart Treasury Rates and Lighthouse Live Macro, July 2 to July 3, 2026
A normal dovish-growth scare sends yields lower. This did not. The long end looked less like it was debating the next Fed move and more like it was demanding compensation for supply, fiscal dominance, and term premium.5
That distinction matters. A hawkish story is about the Fed. A term-premium story is about the buyer of duration. When the buyer of duration asks for a higher yield while the labor market weakens, the signal is not cleanly bullish or bearish. It is unstable.
The June FOMC backdrop makes the reaction more important. The median dot had shifted higher, and half of the committee projected at least one hike this year. That posture depended on a labor market strong enough to absorb restrictive policy.1
This week attacked that foundation. Payrolls disappointed, prior months were marked lower, and unemployment ticked to 4.2%. The case for pressing hawkishness became harder to defend on labor grounds alone.1
Yet the bond market did not trade as if policy relief solved the problem. Treasuries generated negative returns across most maturities in the cache, even as the payroll data undercut the Fed’s hiking argument.3
That is why the week cannot be reduced to a Fed pivot story. The policy probability moved dovish, but the market price of long-term money moved the other way. That gap is the article.
Divergences Beneath the Surface
The first divergence is between rates and credit. If the labor miss were a true stress event, high yield should have complained. It did not. High yield OAS sat near 275bps, around the 13th percentile, which is not where broad credit fear usually announces itself.3
That does not make the data benign. It makes the signal narrower. Credit is saying default risk is still contained, while Treasuries are saying duration risk is not cheap enough. Those are different warnings.
The second divergence is inside equities. The Russell had the better first-half story, with the cache noting its strongest first-half gain since 1991. This week, the Russell slipped while Nasdaq led, meaning the broadening trade lost momentum at exactly the moment it was supposed to receive help from lower hike odds.2
That is not a collapse in risk appetite. It is a return to selectivity. The tape is directing capital toward the part of the equity market with the clearest earnings narrative, not the part most sensitive to cheaper money.2
The third divergence is between oil and yields. WTI fell toward $69.07 as geopolitical pressure eased and the ceasefire held through the week. A weaker energy tape usually makes the inflation story easier.4
But easier inflation pressure did not pull the long end lower. That reinforces the idea that the driver was not simply inflation fear. Supply and term premium kept doing the work that a pure inflation narrative cannot explain.5
There is a steelman for the bullish side. Equities rose, credit stayed tight, and the Fed’s hawkish labor argument took a hit. If one looks only at risk assets, the week looks like a clean soft-landing repricing.2,3
The rebuttal is the Treasury market. A clean soft-landing repricing should not require higher long rates on weaker payrolls. If duration refuses to help, equity multiple expansion becomes more dependent on leadership concentration and less supported by broad macro relief.5
That is where the prior thesis evolves rather than breaks. Run #32 said bonds were starting to price growth more than inflation. This week says bonds may also be pricing supply more than the Fed. The growth signal did not disappear. It was joined by a term-premium signal.
The result is not panic. It is tension. Credit says no systemic stress. Mega-cap leadership says capital still wants earnings visibility. Small caps say the rotation is not yet durable. The 10Y says the market still has to pay for time.
That combination favors humility over narrative certainty. The weight of observable systematic evidence favors treating the rally as leadership-driven, not macro-broad. That is a very different claim than saying risk is broken.
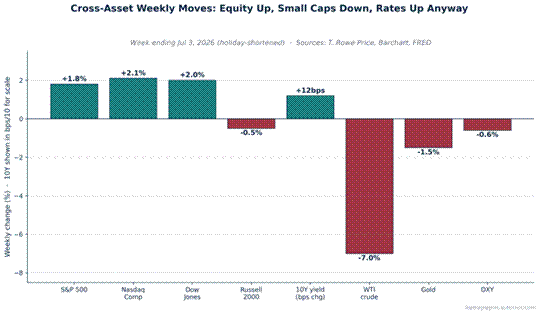
Figure 3: Cross-Asset Weekly Moves / Equities rose while long-end Treasuries sold off and WTI slumped, capturing the week’s split personality. / Source: Seattle Times weekly recap, T. Rowe Price weekly update, and Barchart Treasury Rates, July 2, 2026
The Week Ahead
Next week is less about the economic calendar and more about whether the Treasury market confirms the message it just sent. The three-year, ten-year, and thirty-year auction sequence will test whether this week’s yield rise was a holiday-week distortion or a real demand signal.5
If the auctions clear cleanly and the 10Y drifts back below 4.37%, the term-premium interpretation weakens. If yields hold above this week’s close after the supply test, then the long end is saying the payroll miss did not solve the bond market’s problem.5
The labor picture was not one-way. JOLTS openings stood at 7.594M and initial claims were 215K, which helps explain why credit did not treat the payroll miss as recession confirmation.6
For the equity tape, the first thing to watch is whether Russell can regain leadership from Nasdaq. If small caps lag again while mega-cap AI carries the index, the failed Run #32 watch item becomes a broader warning about breadth rather than a one-week reversal.2
For credit, the trigger is high yield OAS. If spreads remain near 275bps, the market is not confirming recession stress. If they push above 300bps while equities hold near highs, the divergence becomes harder to ignore.3
The watch item for next week: if the ten-year yield closes above 4.55% after the auction sequence, the term-premium thesis strengthens; if it closes below 4.37%, the dovish-growth interpretation regains control.5
So what: if you take nothing else from this week, the Fed’s labor argument cracked, but the long end refused to validate easy-money relief, and next week’s auction response decides whether that refusal was noise or signal.
Signals lead. Markets lag. The gap between them is where the opportunity lives.
SOURCES
1. BLS Employment Situation June 2026, July 2, 2026, https://www.bls.gov/news.release/pdf/empsit.pdf; CNBC June jobs report, July 2, 2026, https://www.cnbc.com/2026/07/02/jobs-report-june-2026-.html
2. Seattle Times weekly index recap, July 2, 2026, https://www.seattletimes.com/business/how-major-us-stock-indexes-fared-thursday-7-2-2026/; T. Rowe Price global markets weekly update, July 2, 2026, https://www.troweprice.com/personal-investing/resources/insights/global-markets-weekly-update.html; WSJ Small Stocks Biggest Run, July 4, 2026, https://www.wsj.com/finance/stocks/russell-2000-small-stocks-gains-83fade43
3. Lighthouse Live Macro (FRED), July 2, 2026, https://macrolighthouse.com/data/; FRED BB US HY OAS, July 3, 2026, https://fred.stlouisfed.org/series/BAMLH0A1HYBB
4. n-tv Oil July 3 close, July 3, 2026, https://www.n-tv.de/wirtschaft/der_boersen_tag/Der-Boersen-Tag-Freitag-3-Juli-2026-id31042544.html/; T. Rowe Price weekly update, July 2, 2026, https://www.troweprice.com/personal-investing/resources/insights/global-markets-weekly-update.html
5. Barchart Treasury Rates, June 29, 2026, https://www.barchart.com/economy/interest-rates; Lighthouse Live Macro (FRED), July 2, 2026, https://macrolighthouse.com/data/
6. T. Rowe Price weekly update, July 2, 2026, https://www.troweprice.com/personal-investing/resources/insights/global-markets-weekly-update.html; CNBC jobless claims / ISM, July 2, 2026, https://www.cnbc.com/2026/07/02/jobs-report-june-2026-.html
DISCLOSURE
The Lead-Lag Report is provided by Lead-Lag Publishing, LLC. All opinions and views mentioned in this report constitute our judgments as of the date of writing and are subject to change at any time. Information within this material is not intended to be used as a primary basis for investment decisions and should also not be construed as advice meeting the particular investment needs of any individual investor. Trading signals produced by the Lead-Lag Report are independent of other services provided by Lead-Lag Publishing, LLC, or its affiliates, and positioning of accounts under their management may differ. Please consult with your investment, tax, and legal professionals before considering any transactions or if you have any questions. Past performance is not indicative of future results.