
JOJO: For The First Time In Years, Risk Rotation Strategies May Be Set To Excel
There Are No Gurus, Only Cycles

The 1st quarter of 2025 was marked by the return of volatility. After a brief rally resulting from Donald Trump’s return to the White House, the market’s focus has shifted to DOGE’s aggressive aim to cut government spending and Trump’s intent to levy tariffs on many foreign imported goods. With the U.S. economy looking like it could print negative GDP growth in Q1, these uncertainties could end up accelerating the process and raise the risk of slipping into recession.
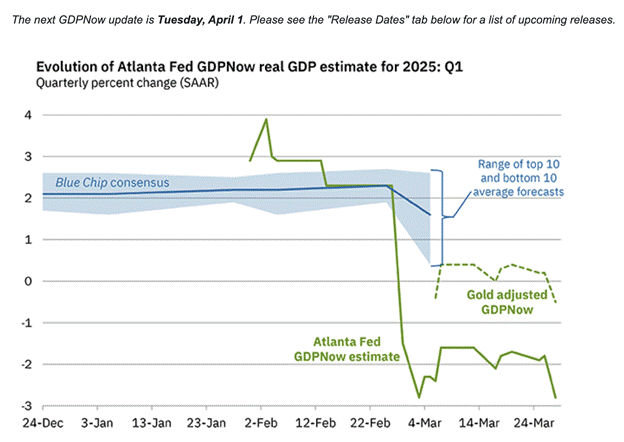
Source: atlantafed.org
For the first time in a while, that risk is beginning to show up in the credit market.
Especially over the past couple months, the VIX has spent a fair amount of time above the 20 level, which is where bad things start to happen. So far, it’s resulted in a 10% correction in large-cap growth & tech stocks, but also a widening of credit spreads.
Since mid-February, the high yield credit spread has expanded from around 2.6% to 3.3%. That may not sound like much, but it’s the largest expansion in spreads since the yen carry trade unwind last year and among the largest of the past couple years.
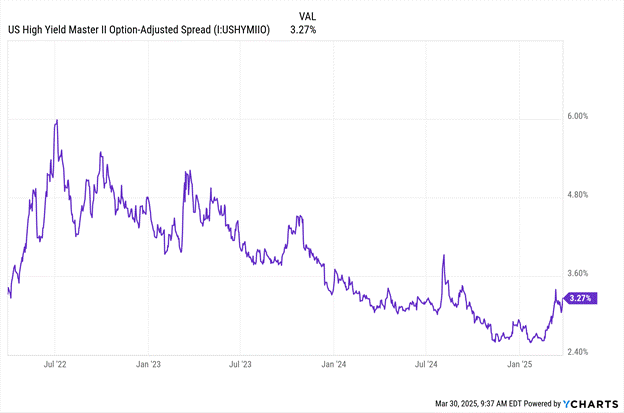
As you can see in the chart above, however, this kind of move has happened several times over the past 2-3 years. On each occasion, spreads had eventually begun to move lower again as risk-off sentiment dissipates.
So what’s the difference this time around that suggests high yield spreads are ready to blow up further? How do we know that this isn’t just another short-term blip that eventually rights itself?
The answer is the deterioration of U.S. and global economic conditions.
In recent years, the U.S. economy has largely been able to achieve the soft landing. GDP growth rates have remained relatively solid. The labor market has been pretty tight throughout. While it hasn’t approached the Fed’s target yet, inflation has come down and mostly been contained within the 2-3% range.
Any spike in spreads was related to more short-term events, such as the Fed indicating that it’s willing to stay restrictive on policy, geopolitics or last year’s yen carry trade reversal (which I still don’t believe is over yet). Always in the background was the idea that the economy was in good shape and would remain resilient. That brought comfort to investors and prevented them from shifting into a longer-term risk-off mood.
Today, that sentiment appears to be gone.
We’re already seeing evidence of a slowdown in the hard data, but it’s the damage done to sentiment that’s perhaps been most harmful.
● Surveys are showing that consumer confidence levels are getting worse and inflation expectations are rising.
● Government spending, which has long been a big driver of the economic growth engine is beginning to disappear thanks to DOGE.
● The escalating global trade war threatens to significantly raise the prices of many consumer goods and stifle economic growth.
Perhaps most telling that investors are turning risk-averse here is that traditional risk-off behavior has not only returned, but it’s sticking.
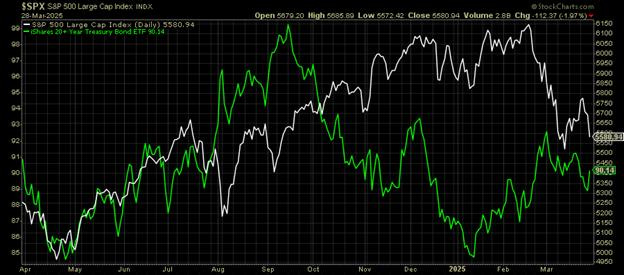
Source: stockcharts.com
This is the chart of the S&P 500 (white) vs. long-term Treasury prices (green).
From April to September, the correlation between the two was positive and both were rising in tandem. That was good for investors, since they were capturing positive returns no matter which one they were invested in, but bad for risk management and risk rotation strategies. Just like in 2022, there was no safety valve to take advantage of because stocks and bonds were doing the same thing.
But that changed in September. Stock/bond correlations turned negative. When stock prices fell, Treasury values rose and vice versa. For the first time since early 2024 (and really back to the COVID recovery in 2020 prior to that), traditional risk-off behavior has returned.
What’s more, it’s being confirmed by other asset classes, sectors and themes as well. Consumer staples, utilities, healthcare, value, low volatility and dividend stocks are outperforming the S&P 500. Gold continues to push higher. Even international stocks are experiencing a mini-renaissance.
In short, it’s the best and broadest example of risk-off behavior since 2020. And it’s being driven by the traditional risk-off triggers, such as recession risk and a softening labor market.
That’s why it could also be a great time for risk rotations to experience their own big return.
The ATAC Credit Rotation ETF (JOJO) pivots between junk bonds and Treasuries based on utilities relative to the broad stock market as a risk trigger. It’s a bond ETF that rotates offensively or defensively based on an historically proven leading indicator of volatility, with the goal of taking less risk at the right time.
Given how the representation of risk-on and risk-off behavior has gotten more decisive in recent months, it’s created an opportunity for JOJO to excel. Over the past year, it’s beaten the S&P 500, U.S. Treasuries and junk bonds. Just in year-to-date 2025, the outperformance has been even more impressive.
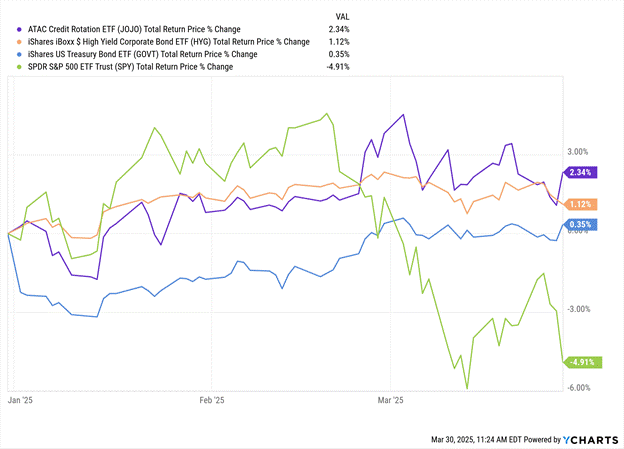
Risk rotation strategies just need an opportunity to work. When stocks and bonds are positively correlated, it limits the chances of success because the “flight to safety” option doesn’t really exist. When those correlations turn negative and true risk-on/risk-off behavior returns, as it has over the past six months, risk rotation strategies can excel, as we’ve seen with JOJO.
With U.S. economic growth slowing, investor fear levels growing and credit spreads widening, we believe the best set of conditions for risk rotation strategy leadership may have arrived. JOJO could be a great way to play that trend.
Junk debt, also known as high-yield bonds or speculative-grade debt, refers to fixed-income securities issued by companies or governments with lower credit ratings, offering higher interest rates to compensate investors for the elevated risk of default.
The VIX index, often called the "fear gauge" of Wall Street, is a real-time market index that measures the market's expectation of 30-day forward-looking volatility derived from S&P 500 index options prices, serving as a key barometer of investor sentiment and market risk.
The ICE BofA BB US High Yield Index Option-Adjusted Spread measures the yield differential between BB-rated corporate bonds and a spot Treasury curve, quantifying the risk premium for below-investment-grade debt with a BB rating in the US market.
As with all ETFs, Fund shares may be bought and sold in the secondary market at market prices. The market price normally should approximate the Fund’s net asset value per share (NAV), but the market price sometimes may be higher or lower than the NAV. The Fund is new with a limited operating history. There are a limited number of financial institutions authorized to buy and sell shares directly with the Fund, and there may be a limited number of other liquidity providers in the marketplace. There is no assurance that Fund shares will trade at any volume, or at all, on any stock exchange. Low trading activity may result in shares trading at a material discount to NAV.
Because the Fund invests in Underlying ETFs an investor will indirectly bear the principal risks of the Underlying ETFs, including but not limited to, risks associated with investments in ETFs, equity securities, growth stocks, large and small capitalization companies, non-diversification, fixed income investments, derivatives and leverage. The prices of fixed income securities may be affected by changes in interest rates, the creditworthiness and financial strength of the issuer and other factors. An increase in prevailing interest rates typically causes the value of existing fixed income securities to fall and often has a greater impact on longer duration and/or higher quality fixed income securities. The Fund will bear its share of the fees and expenses of the underlying funds. Shareholders will pay higher expenses than would be the case if making direct investments in the underlying funds.
Because the Fund expects to change its exposure as frequently as each week based on short-term price performance information, (i) the Fund’s exposure may be affected by significant market movements at or near the end of such short-term periods that are not predictive of such asset’s performance for subsequent periods and (ii) changes to the Fund’s exposure may lag a significant change in an asset’s direction (up or down) if such changes first take effect at or near a weekend. Such lags between an asset’s performance and changes to the Fund’s exposure may result in significant underperformance relative to the broader equity or fixed income market. Because the Adviser determines the exposure for the Fund based on the price movements of gold and lumber, the Fund is exposed to the risk that such assets or their relative price movements fail to accurately predict future performance.
Past performance is no guarantee of future results.
The Fund’s investment objectives, risks, charges, expenses and other information are described in the statutory or summary prospectus, which must be read and considered carefully before investing. You may download the statutory or summary prospectus or obtain a hard copy by calling 855-ATACFUND or visiting www.atacfunds.com. Please read the Prospectuses carefully before you invest.
Investing involves risk including the possible loss of principal.
JOJO is distributed by Foreside Fund Services, LLC.
Learn more about $JOJO at https://atacfunds.com/jojo/ Lead-Lag Publishing, LLC is not an affiliate of Tidal/Toroso or ACA/Foreside.