

Below is an assessment of the performance of some of the most important sectors and asset classes relative to each other with an interpretation of what underlying market dynamics may be signaling about the future direction of risk-taking by investors. The below charts are all price ratios which show the underlying trend of the numerator relative to the denominator. A rising price ratio means the numerator is outperforming (up more/down less) the denominator. A falling price ratio means underperformance.
LEADERS: SMALL CAPS & GOLD BECOME THE STORY
Consumer Discretionary (XLY) – Consumer Breakdown
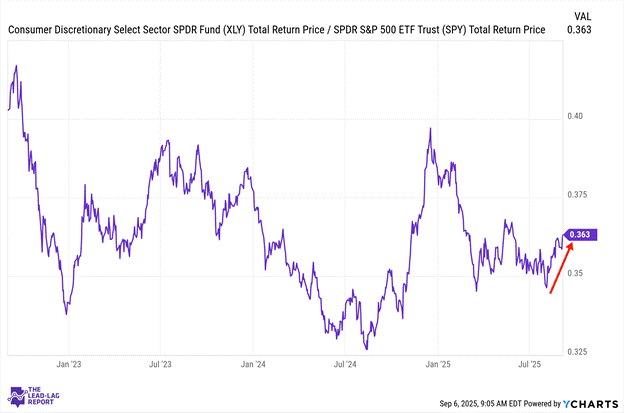
Discretionary stocks continue to lead here despite facing pressure from retailers, such as Lululemon, who warned of industry challenges and tariff risks. The sector reflects growing concern about consumer spending resilience amid deteriorating labor market conditions. Forward-looking indicators suggest retailers may face a challenging holiday season as employment gains stall and consumer confidence potentially wanes.
Communication Services (XLC) – Divergence Building
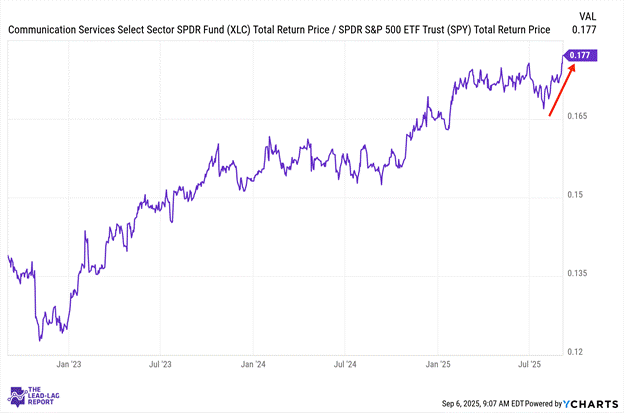
Communication services benefited from Alphabet’s legal victory that will allow it to maintain ownership of Chrome while merely prohibiting exclusive search deals going forward. The fine will be minor in the bigger picture and the street was pleased. The sector, however, shows increasing divergence between companies with strong AI narratives and those dependent on traditional advertising revenue streams in a potentially slowing economy.
Health Care (XLV) – A Bright Spot In A Weak Labor Market
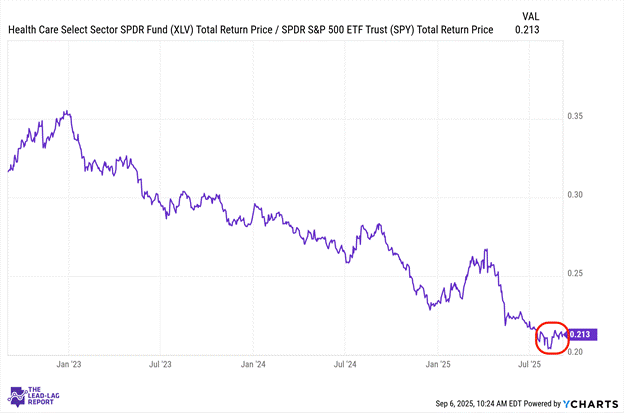
Healthcare remained one of the few bright spots in Friday’s jobs report, adding 31,000 positions though even this fell below the sector’s average monthly gain of 42,000 over the previous year. The sector’s defensive characteristics haven’t translated into significant outperformance this cycle despite persistent economic uncertainties. Healthcare companies continue navigating policy uncertainty while evaluating potential regulatory changes that could emerge from a second Trump term.
Small-Caps (VSMAX) – Best Stretch In Nearly A Year
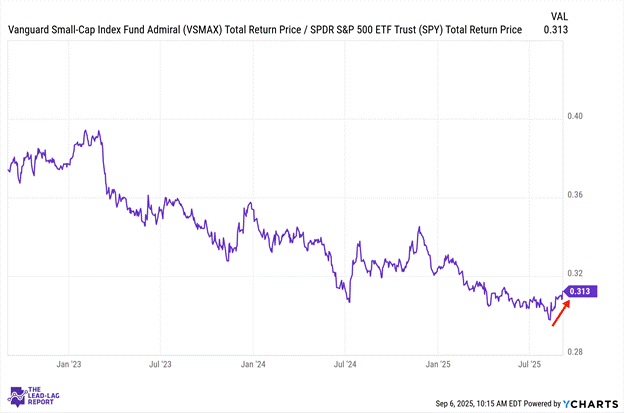
Small caps continued showing impressive relative strength with the Russell 2000 demonstrating its best stretch of outperformance versus the S&P 500 in nearly a year. The rotation got technical validation when the 50-day moving average crossed above the 200-day for the first time since December 2023. These companies potentially stand to benefit disproportionately from Fed rate cuts due to their typically higher debt loads and greater sensitivity to domestic economic conditions.
Long Bonds (VLGSX) – The Economy/Inflation Tug Of War Is Still Being Waged
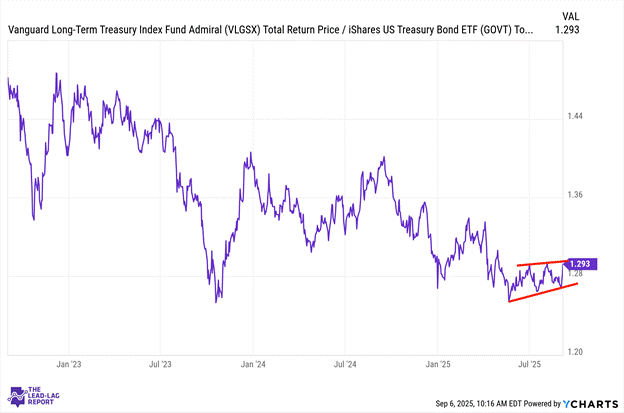
Long duration Treasuries surged as yields fell substantially following the dismal August jobs report that showed just 22,000 jobs added. The 10-year Treasury yield has now fallen approximately 16 basis points over the past month, yet remains higher than a year ago, highlighting the tension between immediate economic concerns and longer-term inflation expectations. Fixed income investors appear increasingly focused on economic slowing rather than sticky inflation as the primary market driver.
Treasury Inflation Protected Securities (SPIP) – Investors Still Maintaining Inflation Hedges
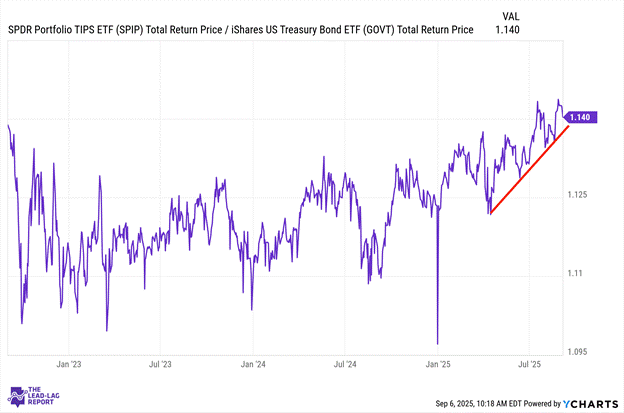
TIPS show continued outperformance against Treasuries as investors maintain some inflation hedges despite expectations for monetary easing. Core PCE inflation remains stubbornly above the Fed’s 2% target, suggesting price pressures haven’t fully abated despite labor market weakness. This persistent inflation creates a challenging backdrop for the Fed as it prepares to cut rates in response to deteriorating employment conditions.
