
Markets Price 70% Odds Of A Rate HIKE, Yet S&P Runs An Eighth Straight Up-Week
Fed Minutes Reveal Members Anticipate Hikes If Inflation Persists; Kevin Warsh Sworn In As Fed Chair Friday; S&P +0.9%, Russell 2000 +2.7% Leads, Tech +3.5% Reasserts; Brent Oil -4% On Iran Whipsaw

Special Announcement
Remember when “Buy low. Sell high.” was considered the key to investing success? Over the years, that 4-word obvious philosophy has become nonexistent in most portfolios. In a recent interview with Nasdaq, Seth Cogswell discusses how RUNN is a thoughtful, common sense, complementary way to bring “Buy Low. Sell High.” back to client portfolios.
Watch here:

Themes, Memes, and Dreams... Passive investing/index funds, thematic strategies, and trends now dominate portfolios.
Passive Investing/Index Funds: By construction, passive, cap-weighted portfolios invest more when a company becomes overvalued, BECAUSE the company is overvalued. Passive then invests even more as a company becomes even more overvalued. Passive invests less as a company becomes undervalued, BECAUSE the company is undervalued. It then invests even less as a company becomes even more undervalued. And passive never sells, unless a committee opts to exclude a company. Passive investing/index funds do the OPPOSITE of “buy low, sell high”.
Thematic Strategies: Themes - such as AI, Genomics, Whiskey, Pet Care, Millennials, Obesity, Underwear, 20x Tesla, etc. - can be an interesting way to complement “Buy High. Buy Higher. Never Sell.”, but valuations (Buy low. Sell high.) are rarely a consideration.
RUNN seeks to invest in companies that are attractively valued - Buy low.
RUNN’s rules-based process is disciplined and unemotional and is designed to sell companies that are unattractively valued - Sell high.
RUNN is intended to be a Core holding, the key/central part of an investor’s portfolio. At a time when “Buy High. Buy Higher. Never Sell.” has become the foundation of many clients’ portfolios, RUNN is an excellent complement and thoughtful return to “Buy low. Sell high.”
If you would like to know more, we would enjoy speaking with you. Feel free to set up a time here.
DISCLAIMER – PLEASE READ: This is sponsored advertising content for which Lead-Lag Publishing, LLC has been paid a fee. The information provided in the link is solely the creation of Running Oak Capital. Lead-Lag Publishing, LLC does not guarantee the accuracy or completeness of the information provided in the link or make any representation as to its quality. All statements and expressions provided in the link are the sole opinion of Running Oak Capital, and Lead-Lag Publishing, LLC expressly disclaims any responsibility for action taken in connection with the information provided in the link.
Below is an assessment of the performance of some of the most important sectors and asset classes relative to each other with an interpretation of what underlying market dynamics may be signaling about the future direction of risk-taking by investors. The below charts are all price ratios which show the underlying trend of the numerator relative to the denominator. A rising price ratio means the numerator is outperforming (up more/down less) the denominator. A falling price ratio means underperformance.
LEADERS: TECH AND SMALL CAPS REASSERT AS RATE-HIKE TRADE PRICES IN
Technology (XLK) – Tech Reasserts Despite The Rate Threat
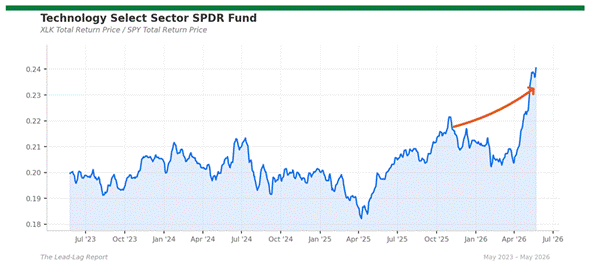
Technology came roaring back this week. XLK/SPY is +10.0% one-month, +17.9% three-month, +12.2% six-month, and +22.3% one-year. XLK closed Fri May 22 at $180.39, up 3.46% on the week — the strongest sector move at a time when the 10-year traded at 4.57% and the Fed minutes were hawkish. The mental model from May 12 (hot CPI breaks tech) did not survive the week. The duration math should have hurt AI capex multiples; instead, the cohort grabbed the bid because the alternative thesis — Iran war risk on, oil whipsaw, defensives bid — created a flight to mega-cap quality. NVDA pre-earnings positioning helped. The pattern is now clear: when macro headlines whipsaw, Mag 7 quality is the destination. Until either the AI capex narrative cracks or NVDA earnings disappoint next Wednesday, XLK stays leader.
Energy (XLE) – The Iran Whipsaw Cost A Week Of Gains
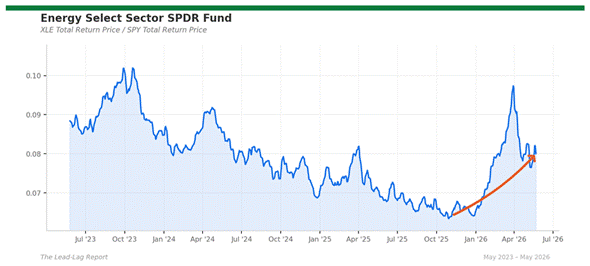
Energy gave back ground on Iran peace headlines. XLE/SPY is -0.8% one-month, -0.7% three-month, +22.0% six-month, and +16.2% one-year. XLE closed Fri May 22 at $59.49, down 1.80% on the week. Brent settled around $102-104 after rallying to $109 mid-week then giving back as US-Iran peace talks resurfaced. WTI ended near $97.55 — down more than 7% on the week. The Strait of Hormuz remains the wildcard: Iran’s Supreme Leader ordered enriched uranium stockpiles to stay in-country and rejected the Iran-Oman Hormuz toll proposal, but futures still faded into Friday’s settle on negotiation hopes. The six-month and one-year leads remain massive, but the one-month has turned slightly negative. Energy stays in the leader column because the structural setup (geopolitical premium, global food prices at three-year highs, sticky inflation prints) hasn’t changed — but the conviction has weakened relative to last week.
Russell 2000 / Small Caps (IWM) – Reasserts As The Best Performer
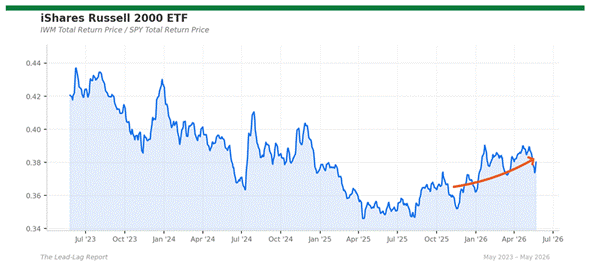
IWM/SPY: -1.7% one-month, -1.2% three-month, +7.2% six-month, +9.7% one-year. IWM closed Fri May 22 at $285.12, up 3.32% on the week — the best-performing major U.S. equity index. The signal flipped sharply: small caps led every major equity benchmark this week. The setup makes sense: if the Fed is going to hike rates anyway (70% priced by year-end), there is no further pain to discover. Small caps positioned for the rate-cut trade now get a relief move. Defensive positioning unwinds, money rotates back to floating-debt names that aren’t going to die from one more hike that’s already in the price. Until the macro framing changes again, small caps reassert leader status. The six-month and one-year leads are intact.
Emerging Markets (EEM) – Quietly Reasserts Leadership
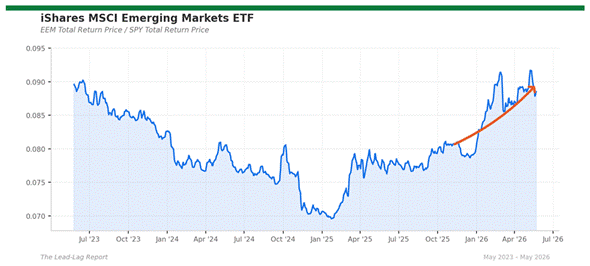
EEM/SPY is +0.4% one-month, -1.2% three-month, +9.6% six-month, and +13.3% one-year. EEM closed Fri May 22 at $65.88, up 1.40% on the week. The one-month flipped positive again as the dollar softened on Warsh confirmation drawing attention to the Fed’s Trump-aligned dovish bias — even as the Fed minutes themselves came in hawkish. The structural EM bid (commodity exporters, US-China trade deal flow, relative valuation) remains intact. China-related EM exposure also benefited from comments from Beijing about additional stimulus. If oil rebounds on Hormuz risk re-pricing, EM commodity exporters re-accelerate. The DXY is the variable to watch — below 100 would supercharge this ratio.
European Banks vs U.S. Banks (EUFN/XLF) – Transatlantic Lead Holds
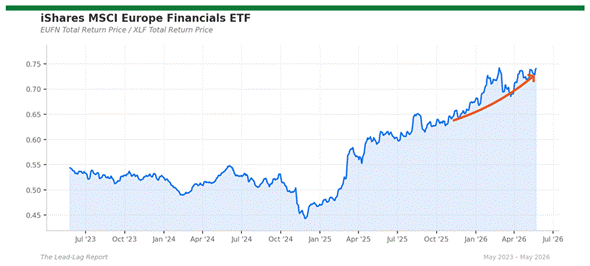
EUFN/XLF: +2.4% one-month, +2.3% three-month, +12.1% six-month, +19.2% one-year. The one-year reading remains the strongest durable cross-asset signal in this report for the sixth consecutive week. EUFN closed Fri May 22 at $38.16, up 1.03% on the week. European banks continue to outperform U.S. peers because the ECB is past its easing cycle while the Fed is being forced toward hikes — putting U.S. banks back in the curve-flat trap. The one-month has actually expanded the lead. Basel III endgame uncertainty has not gone away. As long as the 10-year stays bid and the ECB stays neutral, this ratio holds. Watch UniCredit, Deutsche Bank, ING, and BNP earnings into July — European bank profit re-rating is now visible in cap-weighted ratios.
High-Yield Credit vs Treasuries (JNK/GOVT) – Credit Still Beats Duration
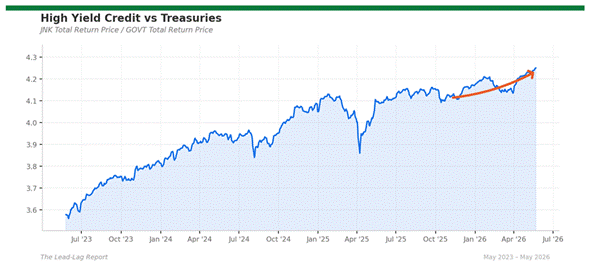
JNK/GOVT is +0.8% one-month, +2.0% three-month, +3.1% six-month, and +3.9% one-year. JNK closed Fri May 22 at $96.25; GOVT at $22.65. The signal: even as the 10-year stays elevated at 4.57% and the 30-year hit 5.08%, high yield credit continues to outperform Treasuries. Credit spreads have not blown out — the HY OAS remains in tight quartile territory despite the duration carnage. The setup is fragile: if economic data cracks (jobless claims, ISM) in a way that makes HY default risk re-price, this ratio reverses fast. But until then, the carry continues to win against bleeding principal in duration.
Lumber / Gold – Pro-Growth Signal Builds
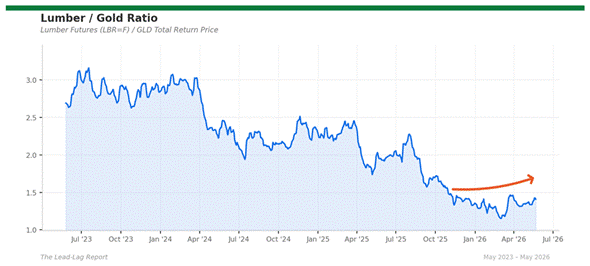
Lumber/Gold extended its leader move. The ratio is +4.5% one-month, +14.5% three-month, +7.3% six-month — a clean accelerating upside reversal. Lumber futures (LBR=F) closed Fri May 22 at $585.50; GLD closed at $413.82, down 1.1% on the week. The pro-growth, anti-defensive signal is intensifying. The one-year is still -28.1% — the structural gap remains massive, meaning this is a counter-trend tactical signal. The historic message: rising lumber + falling gold has preceded growth re-acceleration phases. The catch: in 2026’s environment, the same pattern could also reflect housing-material inflation combined with hawkish Fed pressure compressing the gold premium. Watch closely — if NVDA earnings disappoint, gold reasserts immediately.
LAGGARDS: BONDS BLEED, GOLD SLIPS, DEFENSIVES STILL STRUCTURALLY CAPPED
Gold (GLD) – Still Bleeding As Rate-Hike Trade Builds
