

Below is an assessment of the performance of some of the most important sectors and asset classes relative to each other with an interpretation of what underlying market dynamics may be signaling about the future direction of risk-taking by investors. The below charts are all price ratios which show the underlying trend of the numerator relative to the denominator. A rising price ratio means the numerator is outperforming (up more/down less) the denominator. A falling price ratio means underperformance.
LEADERS: ONCE AGAIN, IT’S LARGE CAP GROWTH AND NOTHING ELSE
Technology (XLK) – AI Spending Dominates
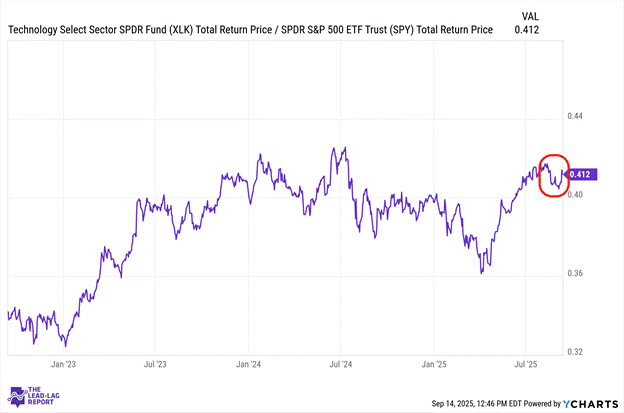
Technology stocks continue providing crucial support for the broader market as AI drives unprecedented infrastructure investment. Oracle’s partnership with Microsoft and OpenAI highlighted the sector’s momentum with the latter pair committing $300 billion in AI related spending over the next several years. The sector remains resilient despite mixed economic signals, with investors focusing on long-term AI potential rather than near-term economic concerns.
Consumer Discretionary (XLY) – Not What’s Expected
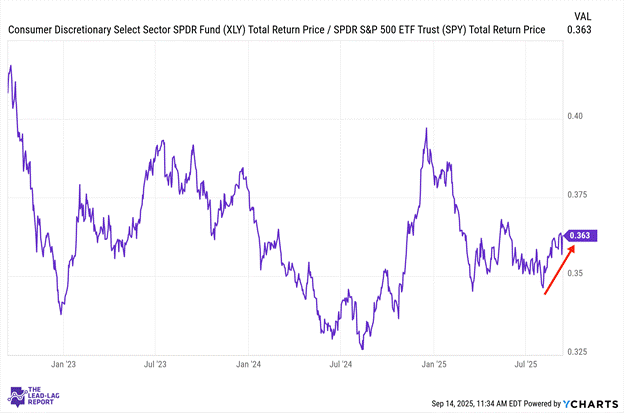
Consumer discretionary stocks face conflicting signals as retail spending data remains mixed against the backdrop of weakening employment figures. The sector hasn’t seen some of the outperformance one might expect in a risk-on environment, reflecting persistent concerns about consumer health despite anticipated Fed rate cuts. Tariff uncertainty continues weighing on sentiment, potentially impacting margins for companies heavily reliant on global supply chains.
Communication Services (XLC) – Tech Outdoing Telecom
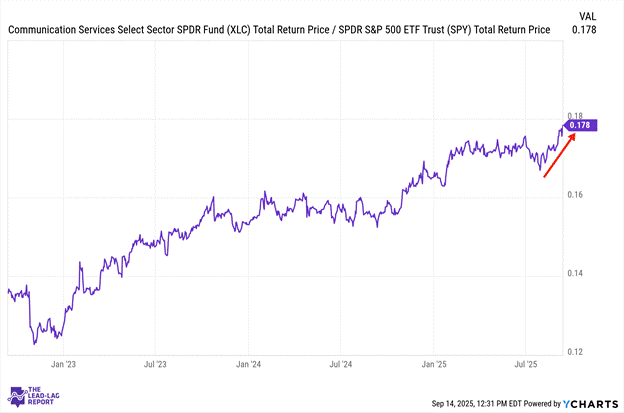
Communication services has experienced a sudden uptick in volatility after six relatively steady months, although that volatility has come with outperformance lately. The sector’s performance reflects the curious dichotomy in markets where mega-cap AI players drive headlines while traditional media and telecom components face growth challenges. Despite containing significant AI exposure through its largest components, the sector hasn’t fully captured the enthusiasm seen in pure technology names.
Small-Caps (VSMAX) – Technical Momentum
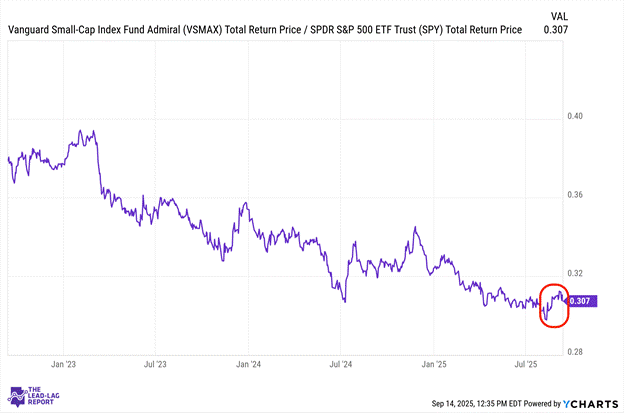
Small-cap stocks have shown improving momentum despite remaining approximately 8% below their all-time highs while large caps continue setting records. The Russell 2000’s technical picture appears increasingly constructive, approaching its first “golden cross” in 18 months. Smaller companies might benefit disproportionately from Fed easing, though their greater sensitivity to domestic economic conditions creates vulnerabilities if labor market weakness intensifies.
Long Bonds (VLGSX) – Flight To Safety Developing
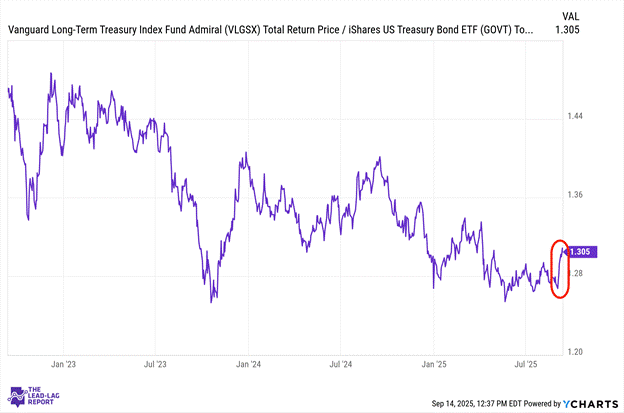
Long-duration Treasuries have gained momentum as the market increasingly prices in an extended Fed cutting cycle in response to labor market weakness. The 10-year Treasury yield has fallen for four consecutive weeks, reflecting growing economic concerns despite inflation remaining above target. Flight-to-safety dynamics appear to be developing despite record equity prices, creating an unusual market dichotomy.
Treasury Inflation Protected Securities (SPIP) – Competing Forces, But The Trend Is Up
