
Oil Is Inflationary. Until It Becomes Deflationary.
The speed of the move in crude determines whether it feeds inflation expectations or destroys demand. History is unambiguous about which one precedes recession.

Key Highlights
• Whether oil is inflationary or deflationary depends on the speed and persistence of the price move, not the direction alone.
• Gradual, sticky oil price increases tend to embed themselves in inflation expectations, pushing CPI higher without immediately killing demand.
• Sharp, parabolic spikes in crude have preceded nearly every U.S. recession since the 1970s, functioning as a consumption tax that destroys demand faster than it lifts prices.
• The macro signal is not whether oil is rising. It is how fast.
The Wrong Question
Is oil inflationary or deflationary? The question itself is incomplete. It assumes that the direction of crude prices carries a single, static macro signal. It does not. The signal depends almost entirely on the velocity of the move. A slow grind higher in oil prices behaves like a tax that the economy absorbs, one that seeps into input costs, transportation, and eventually wages. A violent spike behaves like a shock that the economy cannot absorb, one that breaks consumption, craters confidence, and invites recession.
This distinction is not theoretical. It is observable in every major oil cycle of the past fifty years. And it is the distinction that most macro commentary ignores.
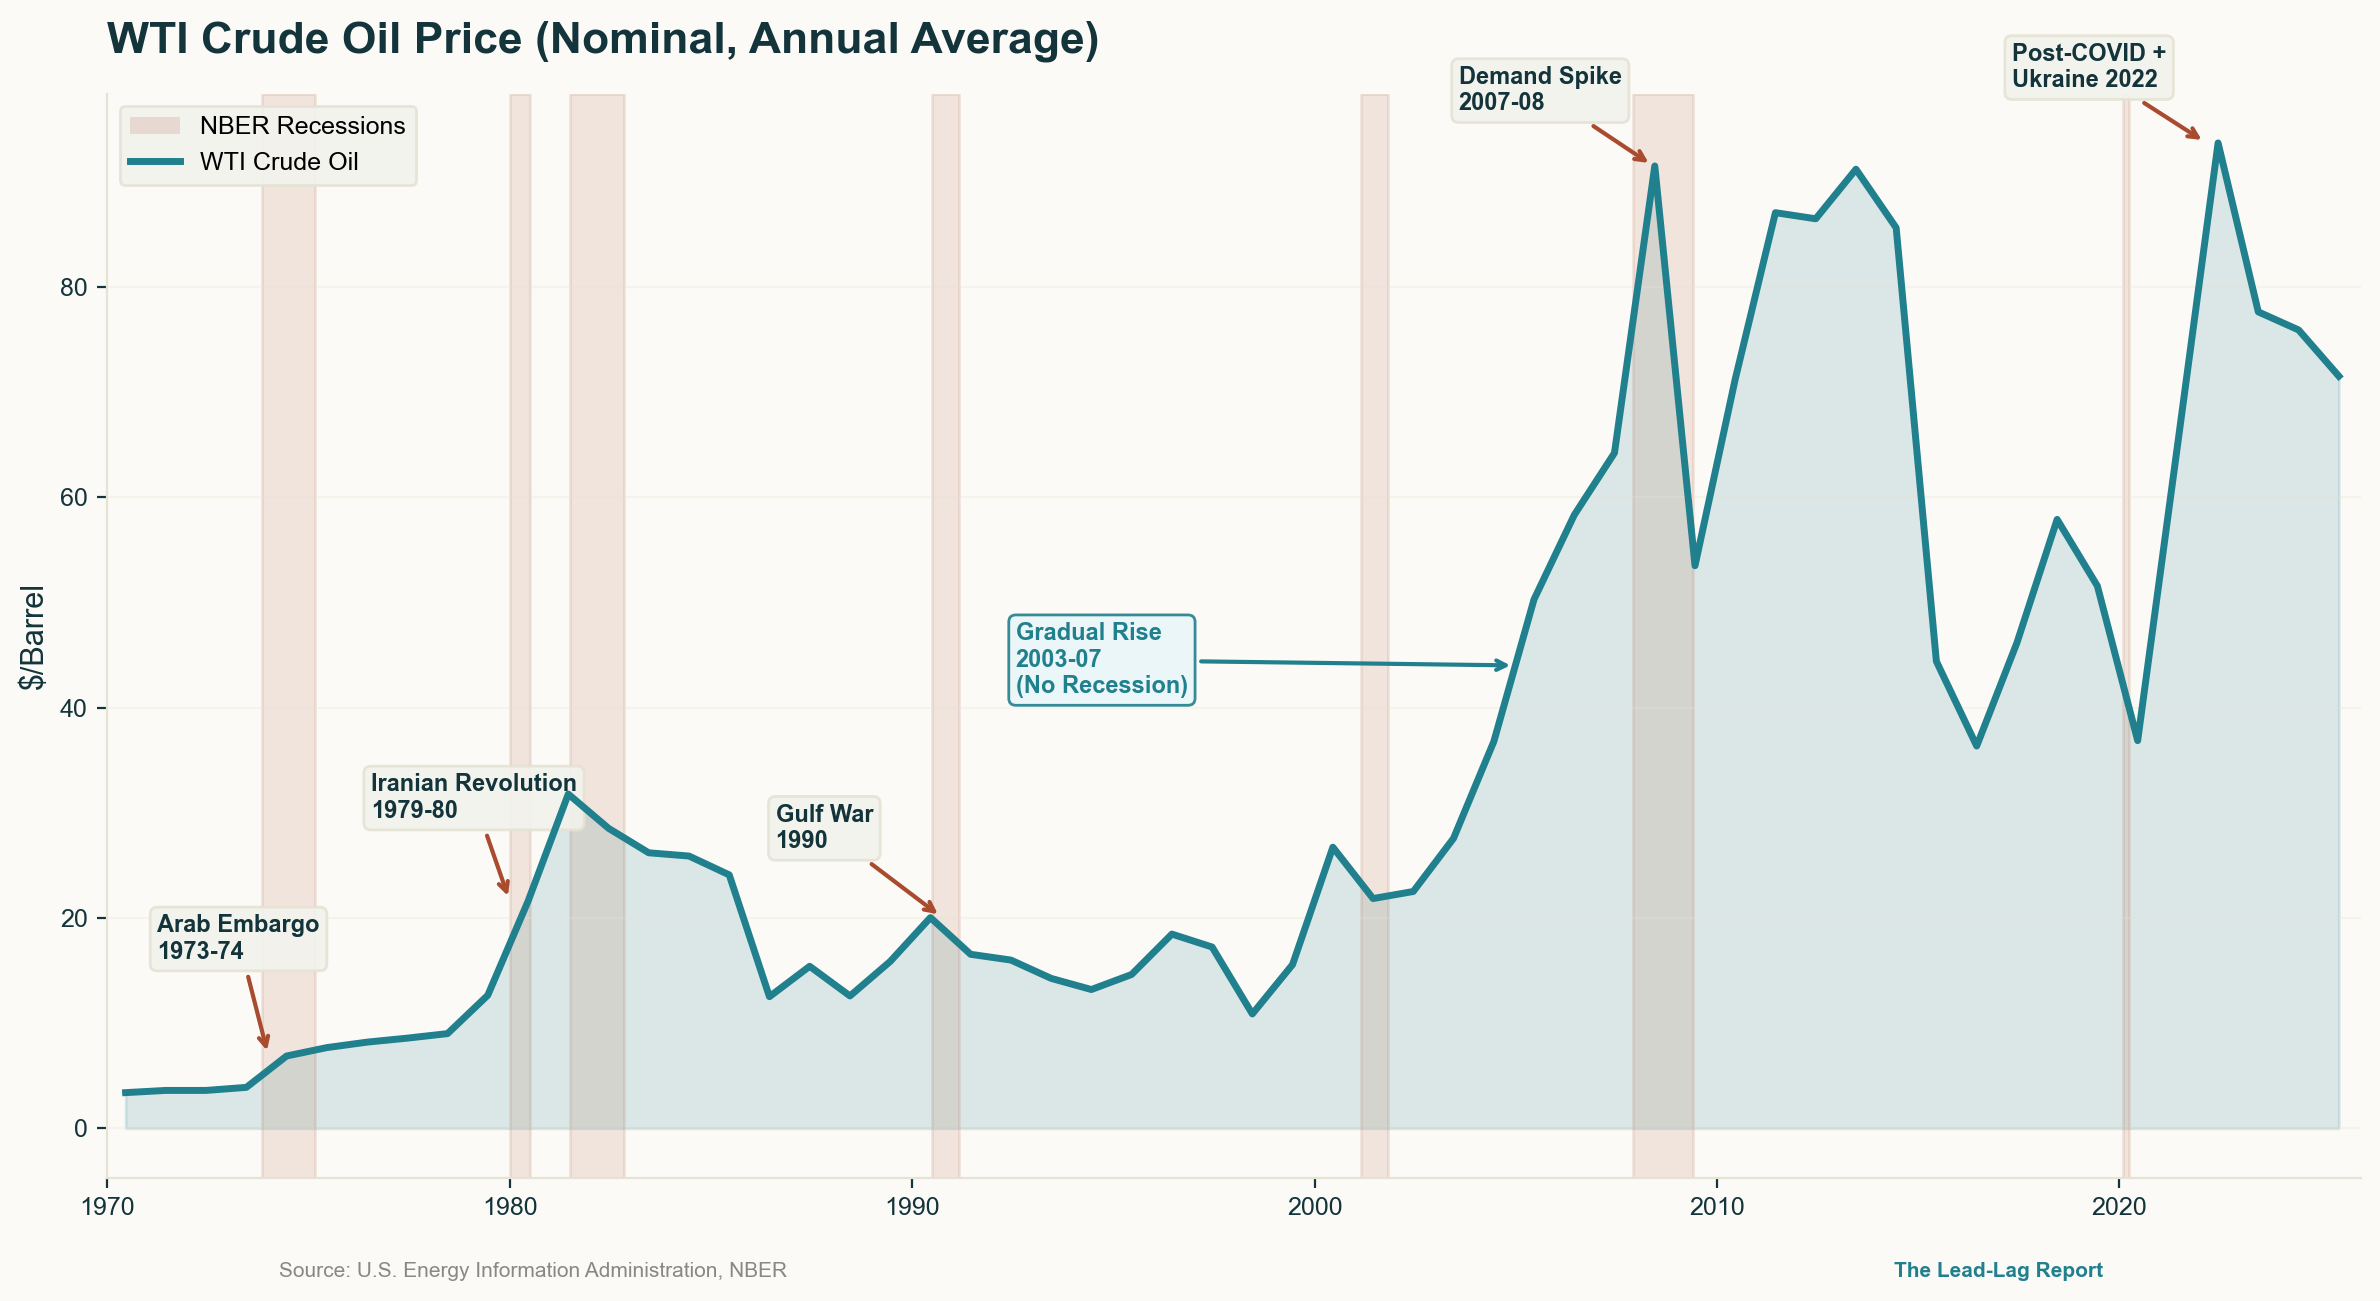
Source: U.S. Energy Information Administration, NBER. Shaded areas indicate U.S. recessions.
James Hamilton, whose seminal 1983 study established the statistical link between oil price increases and U.S. recessions, demonstrated that all but one post-World War II recession had been preceded by a dramatic increase in the price of crude petroleum.1 The relationship was systematic: oil price increases were followed by declines in output three to four quarters later. The exception was the recession of 1960.2
But Hamilton’s own work revealed something subtler that gets lost in the headline finding. Not all oil price increases are created equal. The macroeconomic damage was concentrated in episodes where prices surged rapidly to new highs. Gradual increases, even large ones in cumulative terms, did not carry the same recessionary signal. Hamilton’s later refinement, the “net oil price increase” variable developed in 1996, specifically isolated moves that breached the prior three-year peak, distinguishing between the type of oil increase that merely raises the cost of doing business and the type that breaks the business cycle entirely.3
The Slow Burn: When Oil Feeds Inflation
Consider the period from 2003 to mid-2007. Oil rose from roughly $26 per barrel to $72, a cumulative increase of approximately 175 percent over four and a half years.4 That is an enormous move. But it unfolded gradually, driven largely by demand from China and other emerging economies pulling on a finite supply base. U.S. GDP grew every year during that stretch.5 CPI inflation drifted higher, from 1.6 percent in 2002 to above 4 percent by mid-2006, but the economy did not buckle.
Why? Because the speed of the move allowed the economy to adjust. Businesses passed through higher energy costs incrementally. Consumers modified behavior at the margin. Inflation expectations edged upward but remained anchored. The Federal Reserve, credibly committed to price stability under Greenspan and then Bernanke, tightened policy gradually alongside the oil move, keeping long-term expectations in check.
That is the inflationary oil regime. Oil rises persistently, embeds itself in input costs and services inflation, and the CPI grinds higher. It is uncomfortable but not fatal. Businesses adjust pricing. Wages eventually follow. The inflation is sticky because the underlying energy cost is sticky. As the St. Louis Fed documented, the economy’s capacity to absorb oil shocks depends heavily on the starting position of inflation expectations.6 When they are low and stable, a gradual oil rise pushes them up slowly. The economy bends but does not break.
The same dynamic played out in 2021–2022 when oil rose from pandemic lows to above $120 per barrel over approximately two years.4 The move was large, but initially gradual enough that it fed into headline CPI without immediately destroying demand. The NBER working paper by Gagliardone and Gertler found that the combination of oil price shocks and easy monetary policy mainly accounted for the size and persistence of the 2021–2023 inflation surge.7 Oil did not cause a recession. It fueled inflation.
The Spike: When Oil Kills Growth
Now consider the episodes where oil moved violently. The pattern is different and the outcomes are unambiguous.
Source: EIA, NBER, Author calculations. Speed (% per month) shown in parentheses. Color indicates macro outcome.
In 1973–1974, the Arab oil embargo nearly quadrupled the price of crude, from roughly $3 per barrel to nearly $12 within months.8 The U.S. economy entered recession by November 1973, and GDP contracted across multiple quarters through early 1975.9 CPI initially spiked, but the dominant macro outcome was stagflation and then contraction. Oil rose too fast for wages and prices to adjust. Instead of feeding a gradual inflation process, it crushed consumer purchasing power in real time.
In 1979–1980, the Iranian Revolution triggered another near-doubling of oil prices. Crude surged from roughly $15 to $40 per barrel over approximately twelve months.10 The economy tipped into recession by January 1980.9 Volcker’s Fed, determined not to repeat the accommodation of the prior decade, raised the federal funds rate above 20 percent.11 The combination of an oil shock and aggressive monetary tightening produced the deepest contraction since the Great Depression.
In 1990, Iraq’s invasion of Kuwait sent crude from $18 per barrel to above $36 between July and October, a roughly 95 percent spike in three months.4 Intraday prices briefly touched $41. Recession arrived by the following quarter.9 The precautionary demand for oil storage spiked, pricing reflected fear rather than fundamentals, and the shock reversed almost as quickly as it arrived once the conflict ended.
In 2007–2008, oil surged from roughly $50 to $145 per barrel.12 Hamilton himself argued that absent the oil shock, the U.S. economy would have been “growing slowly but not in a recession.”12 As Datatrek Research’s Nicolas Colas documented, a 90 percent or greater rise in oil prices over a ten-to-twelve-month span had preceded every U.S. recession in the modern era.13 The threshold was not a particular price level. It was the speed.
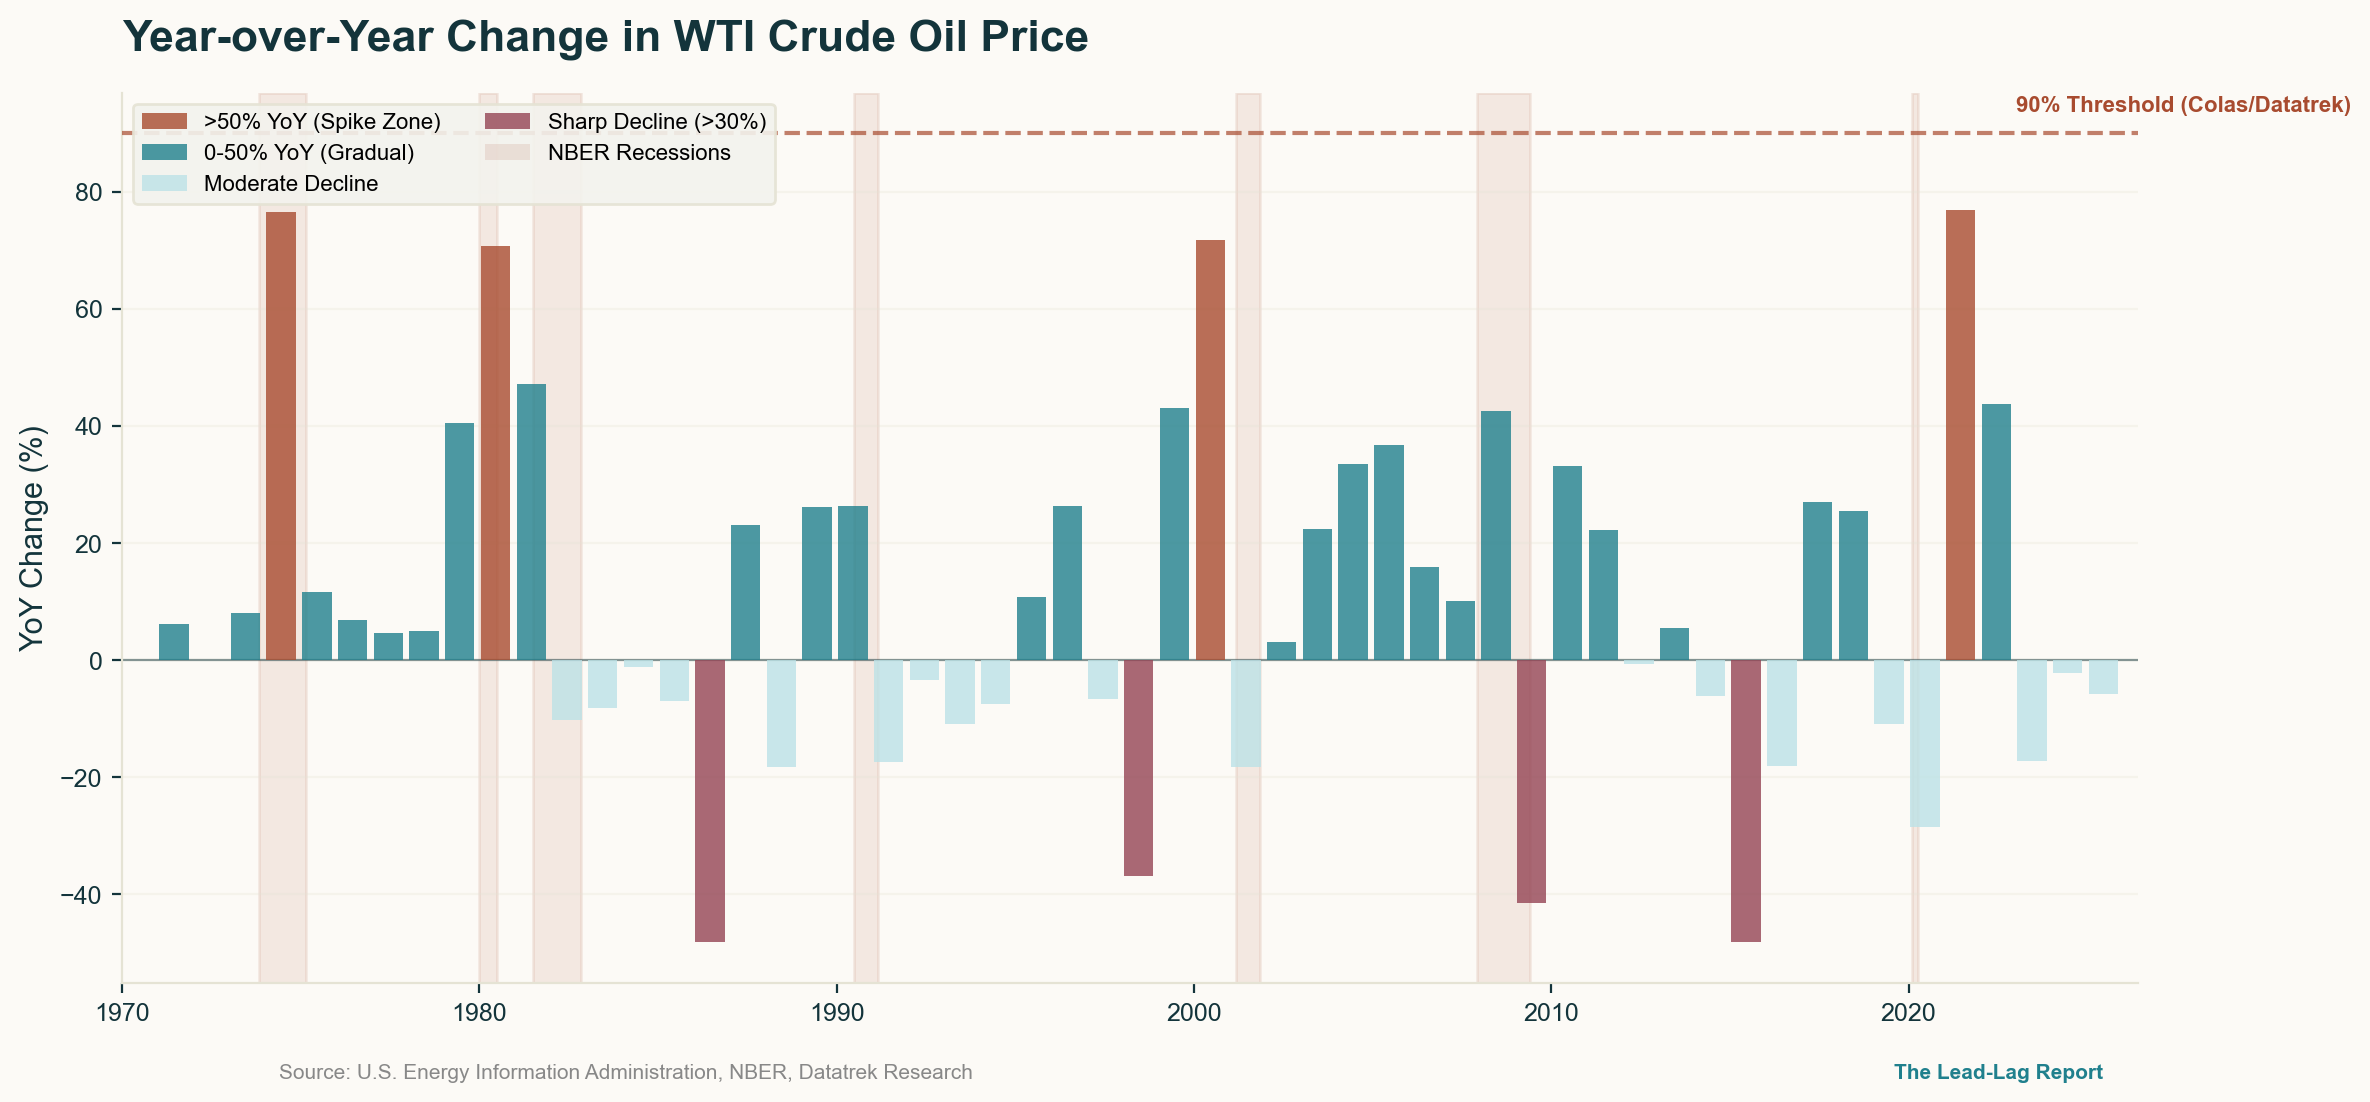
Source: EIA, NBER, Datatrek Research. Bars exceeding the 90% threshold (dashed line) have historically preceded recession.
The deflationary mechanism is intuitive once you see it. A rapid oil spike functions as a consumption tax imposed overnight. Households cannot adjust spending patterns quickly enough. Gasoline, heating, and transportation costs absorb discretionary income before wages have any chance to respond. Businesses face margin compression and defer investment. The uncertainty itself delays capital allocation. Bernanke, Gertler, and Watson estimated that two-thirds to three-fourths of the output decline after an oil shock could be attributed to the Fed’s endogenous monetary response, meaning the inflation from the spike forced tighter policy, which compounded the demand destruction already underway.14
The paradox crystallizes: oil that rises gradually is inflationary because the economy absorbs it. Oil that spikes is deflationary because it destroys demand before inflation can take hold.
The Lead-Lag of Speed
This framing maps neatly onto the lead-lag framework. In a gradual oil regime, energy costs are the lead indicator and CPI is the lagging confirmation. Businesses adjust pricing with a delay. Wages follow with a further delay. Inflation expectations shift slowly. The process is orderly enough for central banks to manage without blunt-force tightening.
In a spike regime, the sequence inverts. Oil is the lead, but the lagging indicator is not CPI. It is GDP. The demand destruction arrives before the inflation can fully transmit. Consumer spending collapses. Business investment freezes. Credit conditions tighten. The recession arrives not because oil made everything more expensive, but because oil made the future more uncertain, faster than any agent in the economy could price.
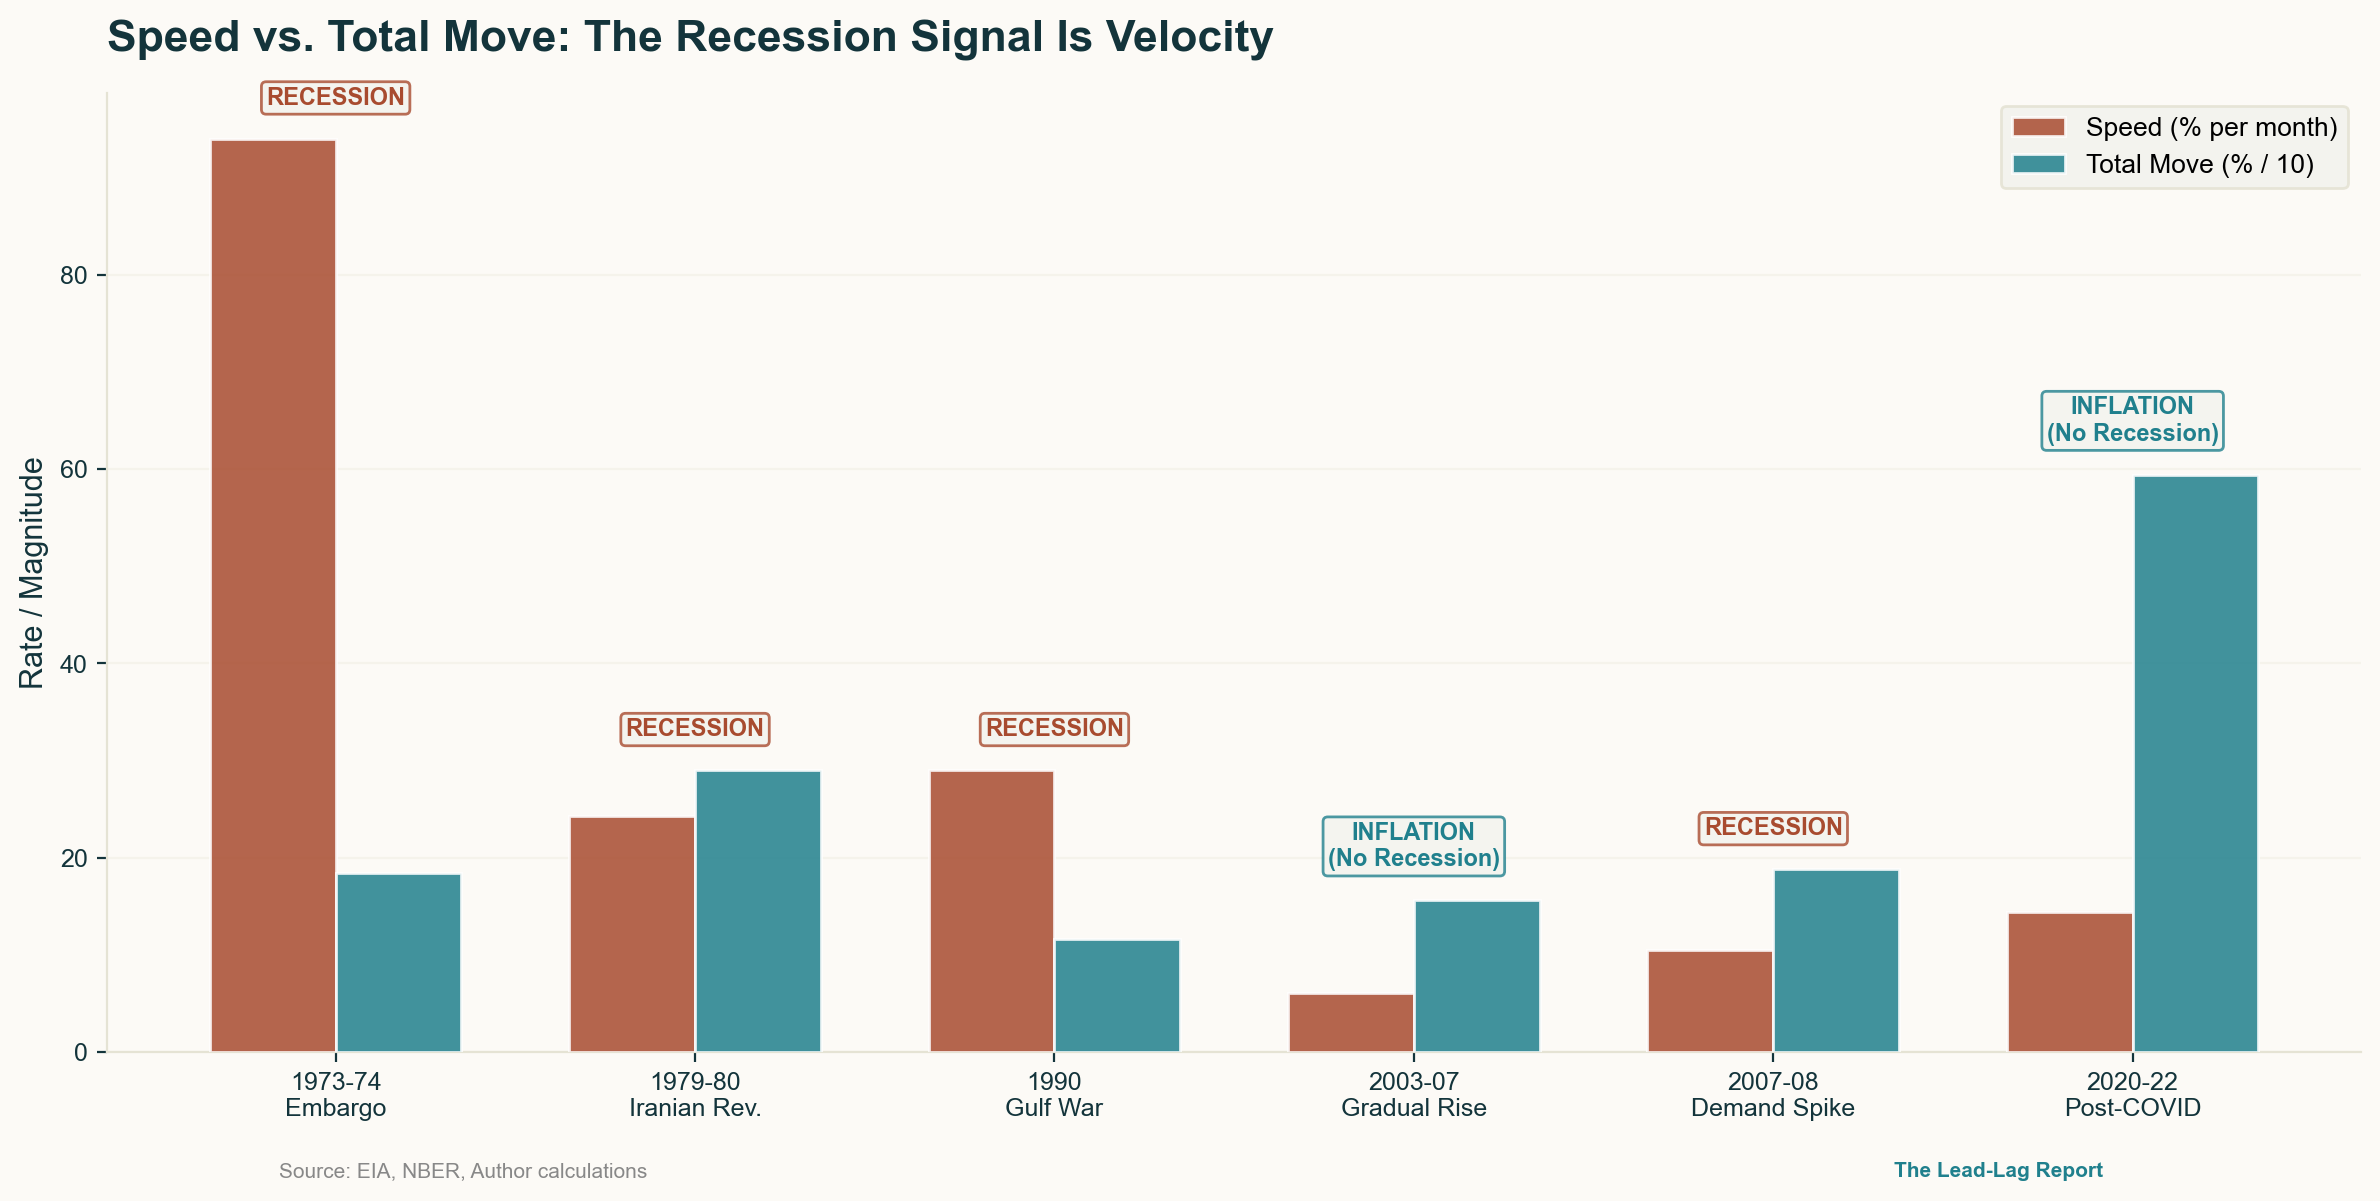
Source: EIA, NBER, Author calculations. Speed (% per month) distinguishes episodes that preceded recession from those that fueled inflation.
The research confirms the asymmetry. Gagliardone and Gertler found that an oil price shock generating a 6 percent increase in the real price of oil reduces GDP by roughly 20 to 30 basis points and increases the core price level by about 20 basis points.7 But the effect on core inflation is modest and delayed, while the drag on output is front-loaded. The Federal Reserve’s DSGE model of the global economy corroborates the dynamic, finding that a 10 percent foreign oil supply shock reduces GDP by approximately 8 basis points while raising headline inflation by 15 basis points.15 The IMF’s work on oil demand versus supply shocks adds further nuance: demand-driven oil price increases, the gradual kind driven by global growth, tend to produce inflationary pressure alongside transitory output gains. Supply-driven shocks produce falling output alongside rising costs.16
Blanchard and Galí found that the effects of oil price shocks on inflation and activity were dramatically larger in the pre-1984 period, when the 1970s spikes occurred, than after.17 The reasons included improved monetary credibility, a reduced share of oil in production, more flexible labor markets, and the absence of concurrent adverse shocks. The economy learned to handle gradual oil moves. It never learned to handle spikes.
Conclusion: Watch the Speedometer, Not the Price
The question investors should ask about oil is not whether it is going up. It is how fast. A gradual, demand-driven grind higher in crude is a macro headwind that feeds into inflation prints, pressures margins, and keeps the Fed on alert. It is manageable. It is tradeable. It extends cycles even as it makes them more uncomfortable.
A spike is different. A 50 percent or greater move in crude over a compressed time frame has historically marked the transition from late-cycle inflation to early-cycle contraction. It is the accelerant that tips an already-fragile economy. The St. Louis Fed’s data show that the average real energy price increase prior to the 1973–1975, 1980, 1981–1982, and 1990–1991 recessions was 17.5 percent relative to the aggregate price level, and each involved a rapid, concentrated surge rather than a drawn-out grind.18
Today, investors watching oil should monitor the rate of change as closely as the level. A crude market that moves from $70 to $90 over twelve months tells a different story than one that moves from $70 to $120 in three. The first is inflationary. The second is recessionary. The asset allocation implications are nearly opposite: the first favors energy producers, TIPS, and inflation-sensitive assets. The second favors duration, defensives, and cash.
Oil is always a macro variable. But whether it leads to higher prices or lower growth depends on something markets too often overlook. The time frame determines the outcome. The speed determines the signal.
Notes
1. James D. Hamilton, “Oil and the Macroeconomy since World War II,” Journal of Political Economy 91, no. 2 (April 1983): 228–248. https://eclass.aueb.gr/modules/document/file.php/DEOS422/Hamilton-OilMacroeconomysince-1983.pdf
2. “Do Increases in Oil Prices Precede U.S. Recessions?” Michigan Technological University, 2013. https://digitalcommons.mtu.edu/etdr/632/
3. James D. Hamilton, “Oil and the Macroeconomy,” in The New Palgrave Dictionary of Economics, 2nd ed., 2005. https://econweb.ucsd.edu/~jhamilto/JDH_palgrave_oil.pdf
4. U.S. Energy Information Administration, WTI Cushing Spot Price (Monthly), Petroleum & Other Liquids. https://www.eia.gov/dnav/pet/hist/rwtcm.htm
5. U.S. Bureau of Economic Analysis, GDP Growth by Year, National Income and Product Accounts. https://www.bea.gov/data/gdp/gross-domestic-product
6. Federal Reserve Bank of St. Louis, “Rising Oil Prices and Economic Turmoil: Must They Always Go Hand in Hand?” Regional Economist, January 2001. https://www.stlouisfed.org/publications/regional-economist/january-2001/rising-oil-prices-and-economic-turmoil-must-they-always-go-hand-in-hand
7. Luca Gagliardone and Mark Gertler, “Oil Prices, Monetary Policy and Inflation Surges,” NBER Working Paper 31263, May 2023. https://www.nber.org/papers/w31263
8. Federal Reserve History, “Oil Shock of 1973–74,” Federal Reserve Bank of Richmond. https://www.federalreservehistory.org/essays/oil-shock-of-1973-74
9. NBER, “U.S. Business Cycle Expansions and Contractions,” National Bureau of Economic Research. https://www.nber.org/research/data/us-business-cycle-expansions-and-contractions
10. Federal Reserve History, “Oil Shock of 1978–79,” Federal Reserve Bank of Richmond. https://www.federalreservehistory.org/essays/oil-shock-of-1978-79
11. Federal Reserve History, “Recession of 1981–82,” Federal Reserve Bank of Richmond. https://www.federalreservehistory.org/essays/recession-of-1981-82
12. James D. Hamilton, “Causes and Consequences of the Oil Shock of 2007–08,” Brookings Papers on Economic Activity, Spring 2009. https://www.brookings.edu/wp-content/uploads/2016/07/2009a_bpea_hamilton-1.pdf
13. CNBC / DataTrek Research, “Spiking Oil Prices Have Led to Recessions in the Past,” January 3, 2020. https://datatrekresearch.com/cnbc-spiking-oil-prices-have-led-to-recessions-in-the-past-and-thats-why-the-stock-market-is-on-edge/
14. Ben S. Bernanke, Mark Gertler, and Mark Watson, “Systematic Monetary Policy and the Effects of Oil Price Shocks,” Brookings Papers on Economic Activity, 1997, pp. 91–157. https://www.brookings.edu/wp-content/uploads/1997/01/1997a_bpea_bernanke_gertler_watson_sims_friedman.pdf
15. Ciro Presno and Andrea Prestipino, “Oil Price Shocks and Inflation in a DSGE Model of the Global Economy,” FEDS Notes, August 2, 2024. https://www.federalreserve.gov/econres/notes/feds-notes/oil-price-shocks-and-inflation-in-a-dsge-model-of-the-global-economy-20240802.html
16. Paul Cashin et al., “The Differential Effects of Oil Demand and Supply Shocks on the Global Economy,” IMF Working Paper WP/12/253, 2012. https://www.imf.org/external/pubs/ft/wp/2012/wp12253.pdf
17. Olivier Blanchard and Jordi Galí, “The Macroeconomic Effects of Oil Price Shocks: Why Are the 2000s So Different from the 1970s?” MIT CEEPR Working Paper 2007-011, August 2007. https://ceepr.mit.edu/wp-content/uploads/2023/02/2007-011.pdf
18. Kevin Kliesen, “Rising Oil Prices and Economic Turmoil: Must They Always Go Hand in Hand?” Federal Reserve Bank of St. Louis Regional Economist, January 2001. https://www.stlouisfed.org/publications/regional-economist/january-2001/rising-oil-prices-and-economic-turmoil-must-they-always-go-hand-in-hand
The Lead-Lag Report is provided by Lead-Lag Publishing, LLC. All opinions and views mentioned in this report constitute our judgments as of the date of writing and are subject to change at any time. Information within this material is not intended to be used as a primary basis for investment decisions and should also not be construed as advice meeting the particular investment needs of any individual investor. Trading signals produced by the Lead-Lag Report are independent of other services provided by Lead-Lag Publishing, LLC or its affiliates, and positioning of accounts under their management may differ. Please remember that investing involves risk, including loss of principal, and past performance may not be indicative of future results. Lead-Lag Publishing, LLC, its members, officers, directors and employees expressly disclaim all liability in respect to actions taken based on any or all of the information on this writing.