
Ray Dalio’s Stage 6 and the New Macro Map: Five Stocks for a Fracturing World Order
Applying Dalio’s power-cycle thesis to defense backlogs, energy security, reshoring capex, and central bank gold buying.

Key Highlights
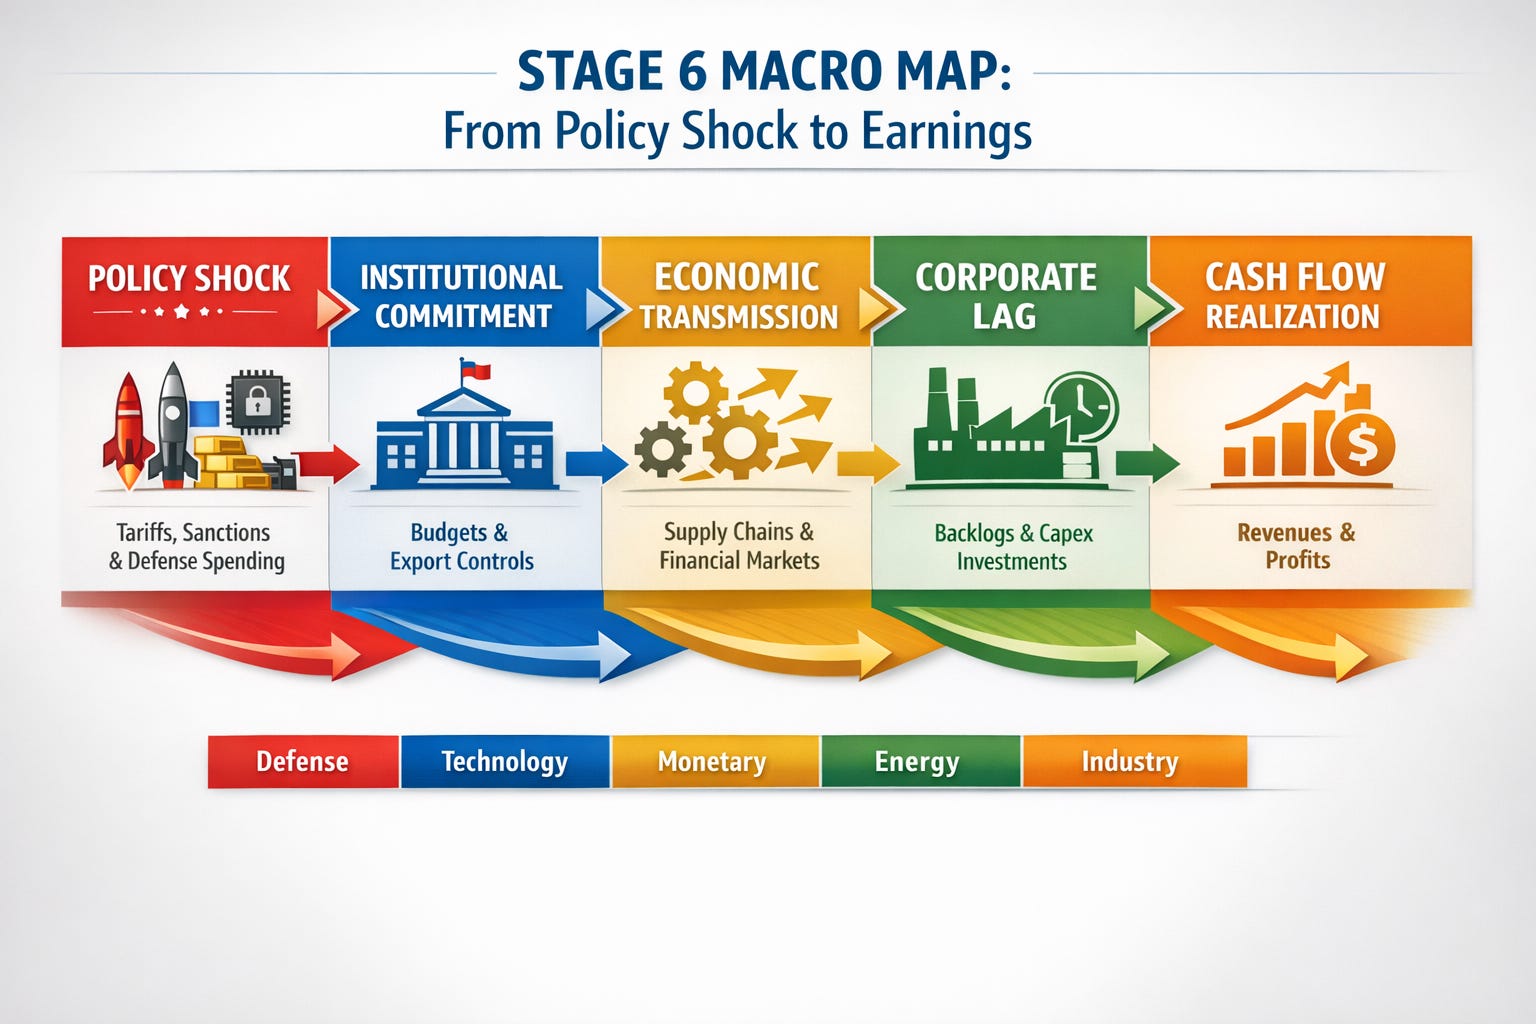
“Stage 6” geopolitics signals a shift from rules-based globalization toward power-driven policy, where trade, technology, capital, energy, and military tensions reinforce one another.¹
Lead indicators in this regime are policy decisions: tariffs, export controls, sanctions, defense budgets, and industrial planning.
Lag indicators are financial: backlog conversion, revenue recognition, margins, and free cash flow.
Five stocks align with distinct Stage 6 channels: Lockheed Martin (LMT), Palantir (PLTR), Exxon Mobil (XOM), Newmont (NEM), and Caterpillar (CAT).
The opportunity lies in respecting the timing gap between policy shocks and earnings realization.
From Rules to Power: Mapping Stage Six to Macro Regimes
Ray Dalio’s “Stage 6” framing describes a period in which the post-1945 order gives way to great-power politics and overlapping conflicts across trade, technology, capital flows, energy, and military domains.¹ In portfolio terms, this suggests an environment where national security priorities override efficiency, sanctions and export controls become routine tools, rearmament accelerates, energy security regains strategic importance, and monetary stress rises alongside fiscal demands.
Trade fragmentation is no longer theoretical. The Office of the United States Trade Representative formalized Section 301 tariff modifications across strategic categories, including electric vehicles, semiconductors, steel, aluminum, and critical minerals.² Tariffs become both signal and substance. They raise costs immediately while incentivizing domestic buildout over time.
Technology controls are similarly institutionalized. The Bureau of Industry and Security updated export restrictions on advanced computing and semiconductor manufacturing equipment, explicitly describing the framework as iterative and adaptive.³ In practical terms, policy leads; corporate adaptation lags.
Capital wars add another layer. The International Monetary Fund notes that sanctions and capital controls can fragment financial markets and amplify systemic risk.⁴ Reserve managers respond accordingly. Central banks added more than 1,000 tonnes of gold in both 2023 and 2024 and remained historically elevated in 2025.⁵ That sustained demand signals a structural hedge against financial fragmentation.
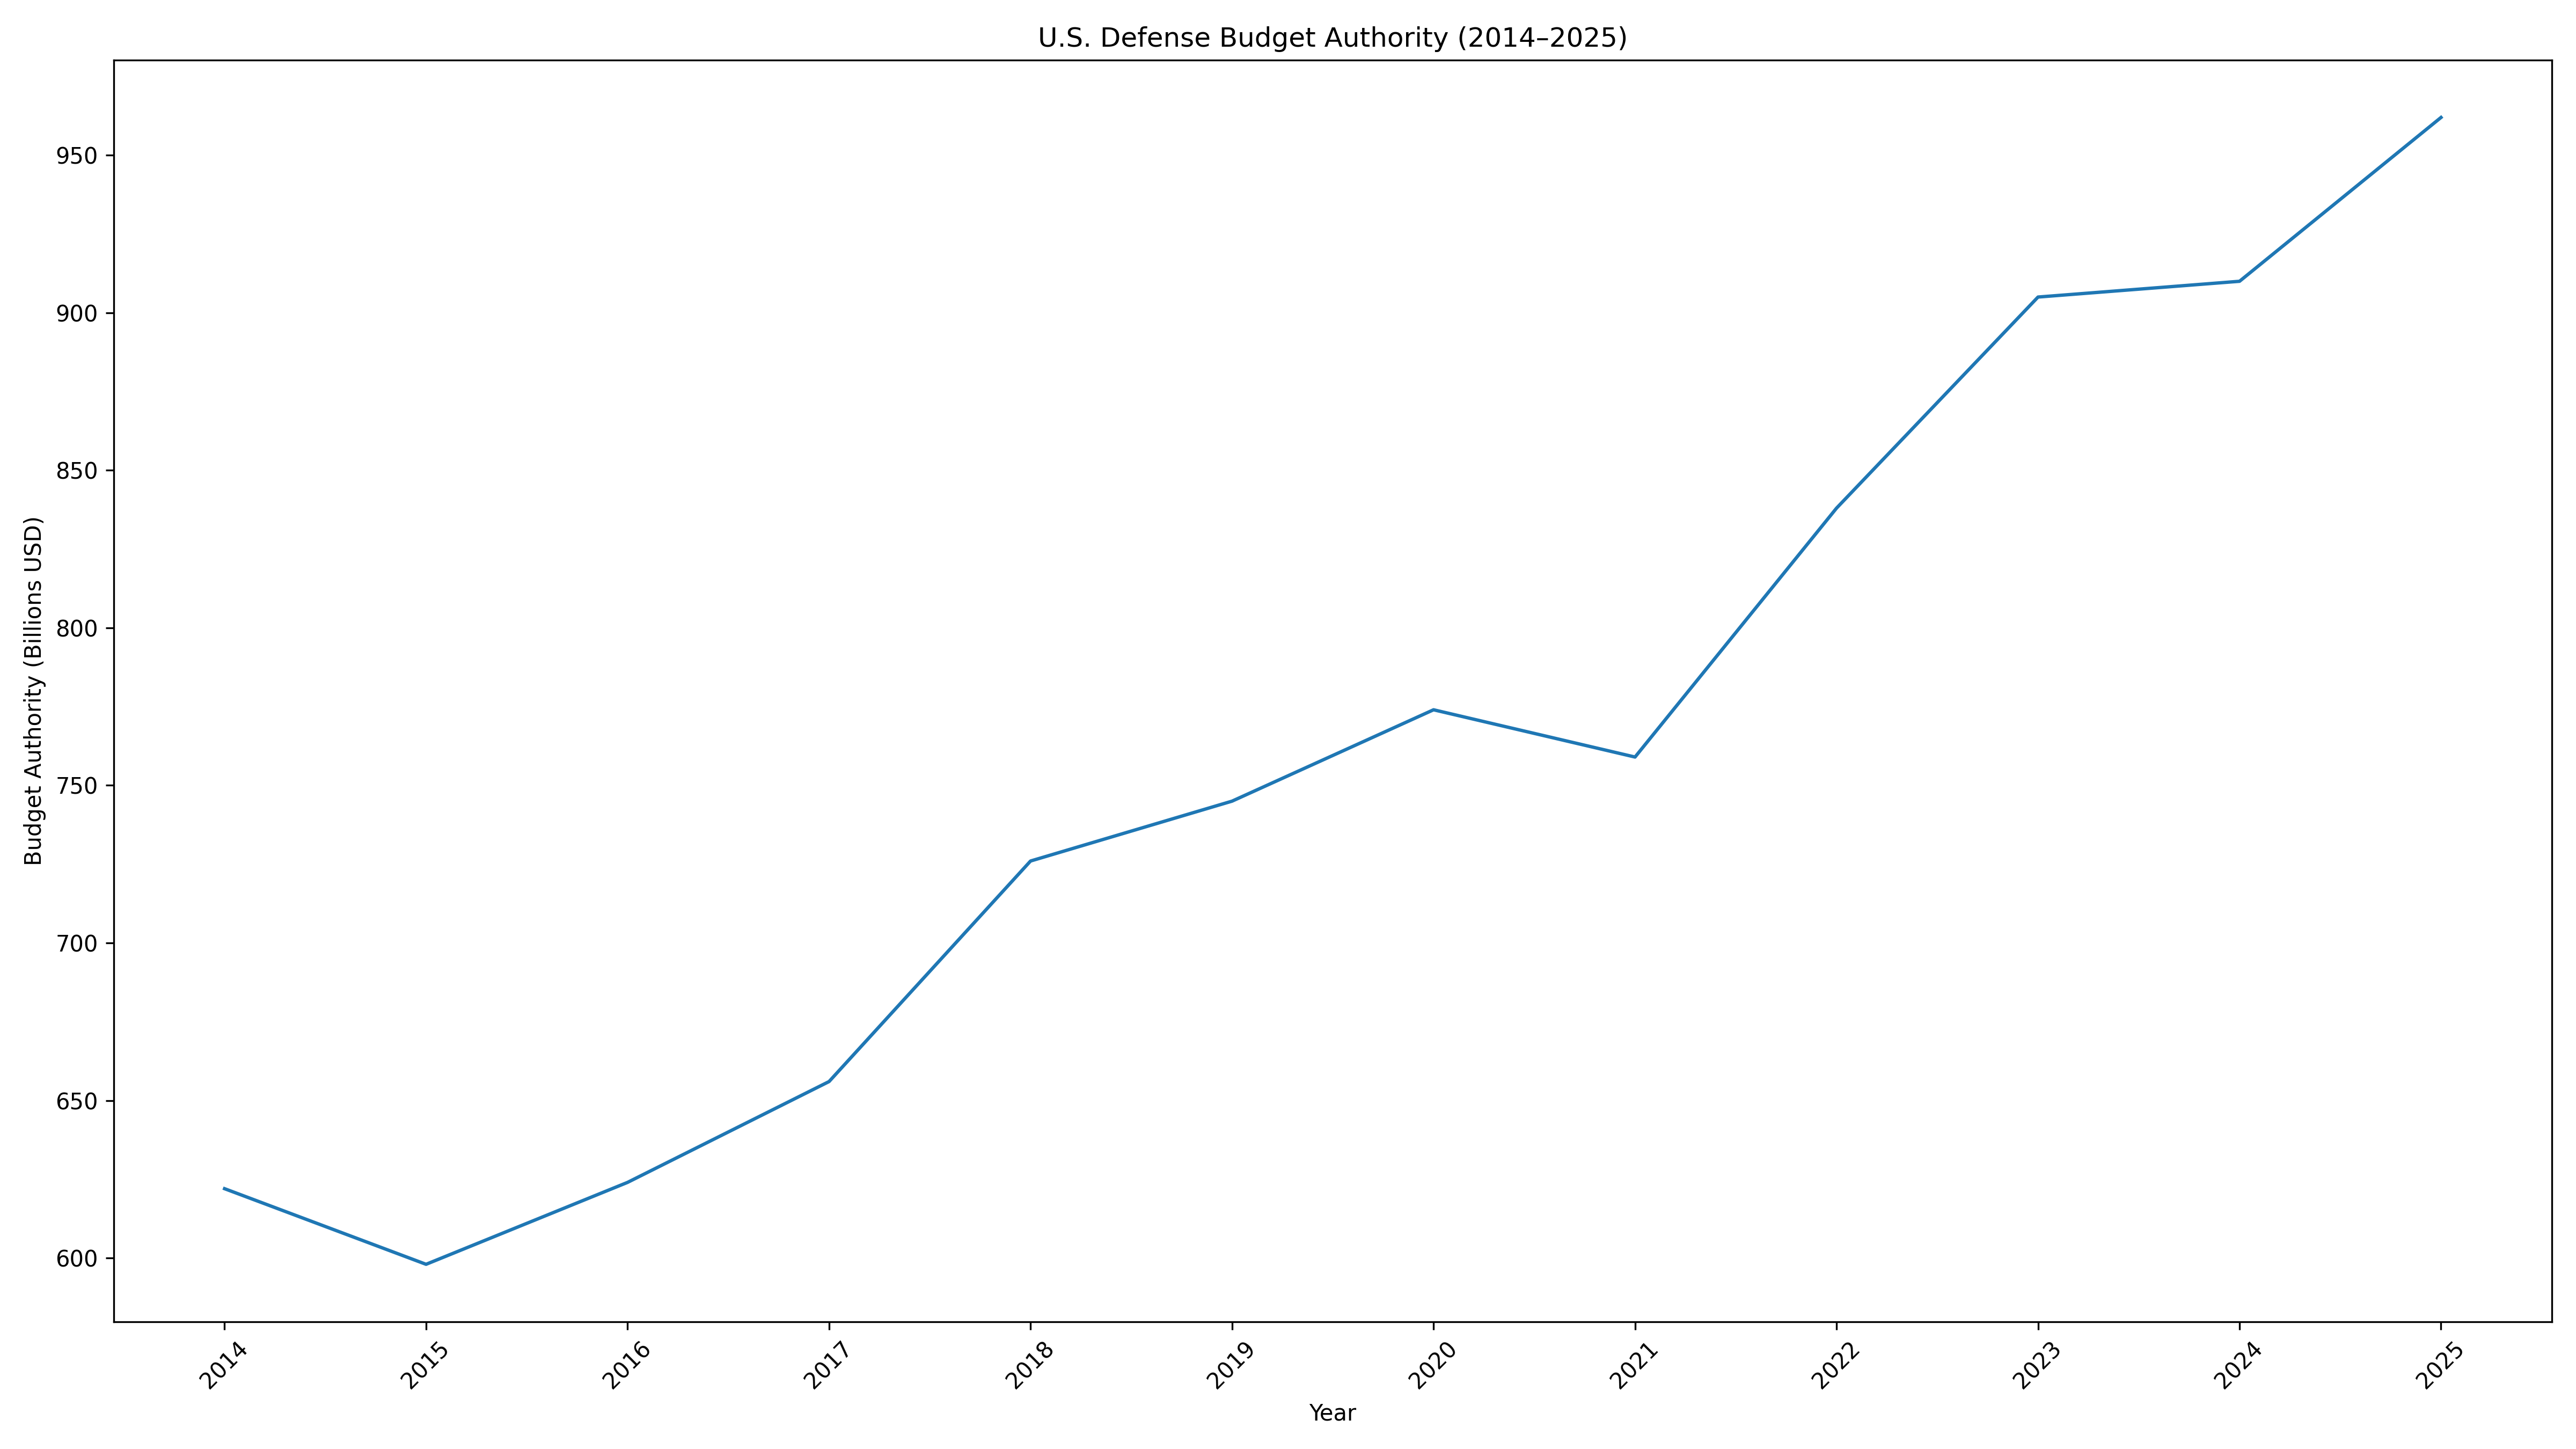
Rearmament is visible in budgets. The U.S. FY2026 discretionary request proposes a significant increase in defense outlays.⁶ NATO data show European and Canadian defense spending rising sharply into 2025 estimates.⁷ These are not abstract narratives. They are budgetary commitments that translate into multi-year procurement cycles.
Energy and shipping fragility reinforce the picture. UNCTAD documents prolonged Red Sea and Suez disruptions and an increase in average voyage distances from 2018 to 2024.⁸ The same trade moves farther. Insurance costs and risk premia rise before volumes shift.
The pattern is consistent: policy impulses lead; economic outcomes follow with delay.
The Lead–Lag Framework in Practice
Stage 6 investing demands discipline around timing. Policy and institutional commitments move first. Earnings, margins, and cash flows respond later.
Defense illustrates the pattern clearly. Lockheed Martin disclosed backlog of $193.6 billion at year-end 2025, with roughly 37 percent expected to convert to revenue within twelve months and 60 percent within twenty-four.⁹ That disclosure effectively sets a conversion clock. Budget approvals today imply revenue visibility tomorrow.
Palantir operates on a similar clock but through contract value metrics. Its fourth-quarter 2025 earnings release highlighted substantial total contract value and remaining deal value, both of which precede reported revenue.¹⁰ In a technology-war regime, contract momentum often anticipates income statement expansion by several quarters.
Energy follows a hybrid lead–lag pattern. Shipping disruption or sanctions can reprice oil quickly. The International Energy Agency has noted unusual inventory dynamics and sanction-driven uncertainty in recent oil market reports.¹¹ Yet upstream investment cycles and infrastructure decisions unfold over longer windows. Exxon Mobil’s 2025 results underscore the importance of durable cash flow generation through cycles rather than reliance on a single price spike.¹²
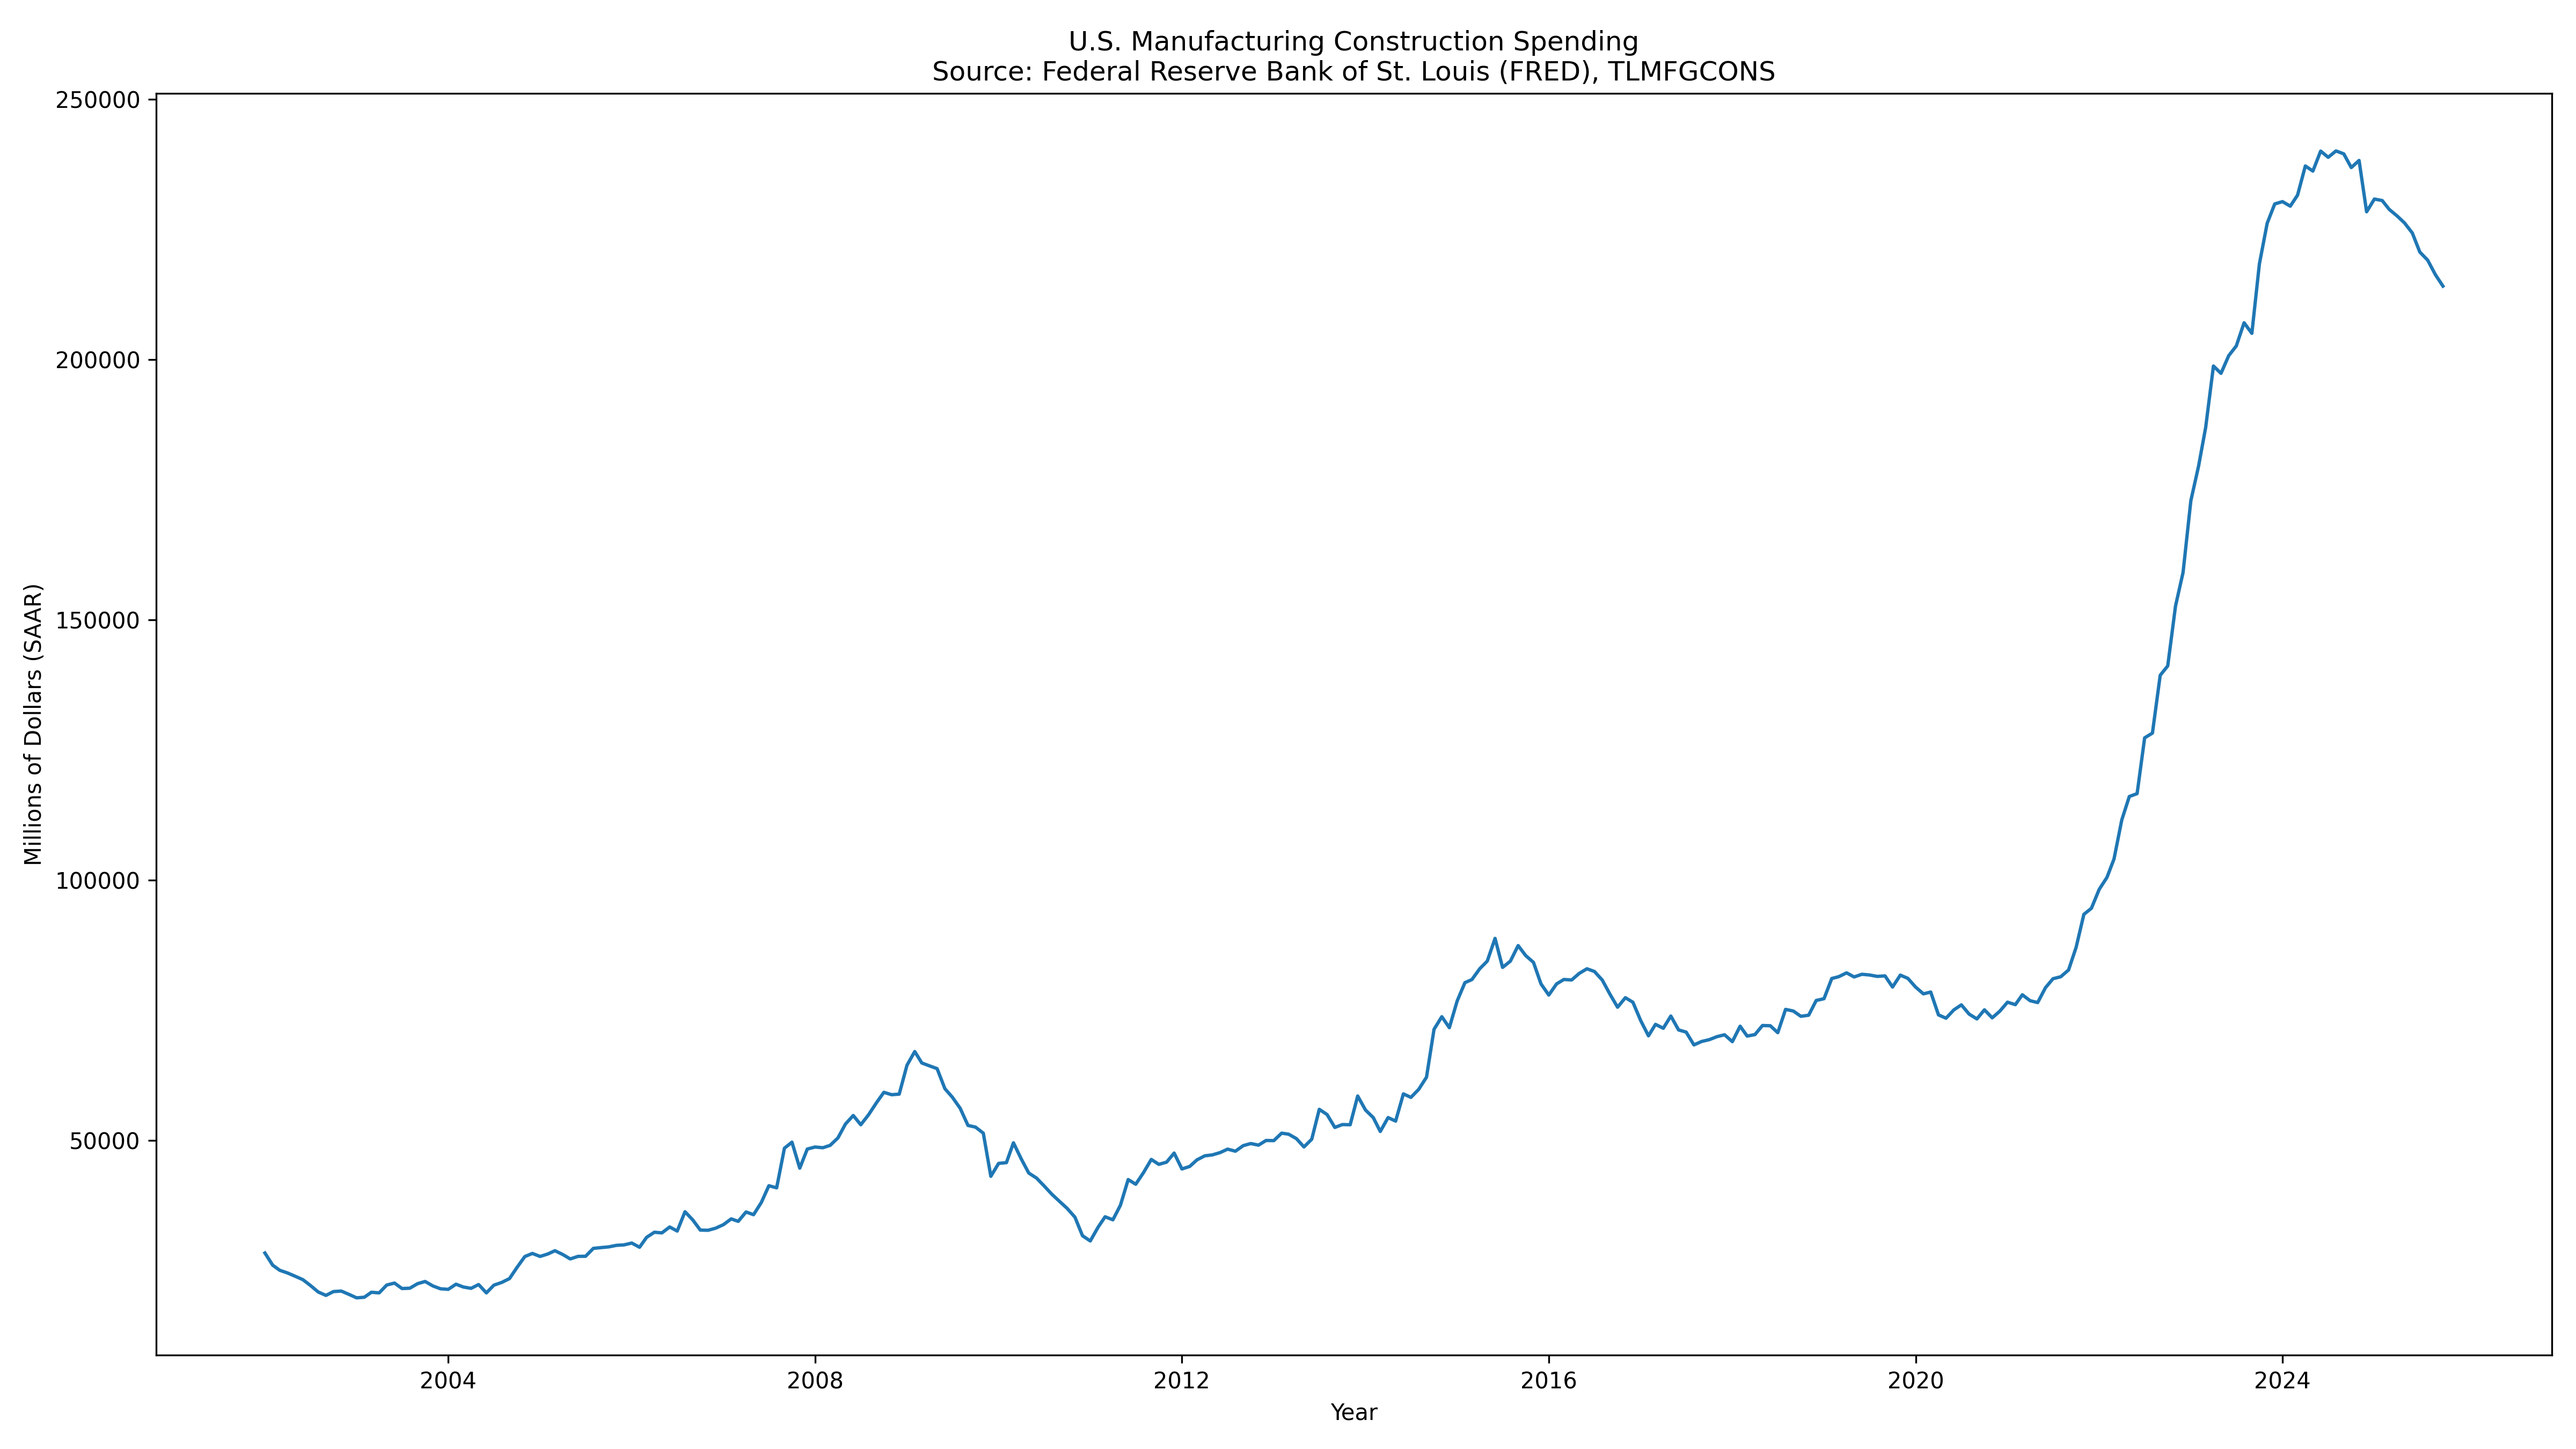
Industrial reshoring demonstrates another timing gap. U.S. manufacturing construction spending surged from early 2023 levels and remained elevated into 2025.¹³ That is the policy and capex lead. Caterpillar’s shipments, dealer inventories, and margins respond afterward. The company also noted that higher tariffs can pressure manufacturing costs before pricing fully adjusts.¹⁴
Gold represents perhaps the clearest policy-to-price channel. Central bank buying at historically high levels provides structural demand support.¹⁵ Miners such as Newmont, however, remain sensitive to cost structures and production discipline. The gold price can move in months. Earnings normalization may take longer.
The essential lesson is straightforward: budgets, controls, sanctions, and reserve shifts are forward signals. Income statements confirm the regime with delay.
Five Stocks, Five Channels
Each of the following names maps directly onto a Stage 6 channel.
