

The signals all remain risk-on for another week, but I’m actually growing more convinced that a risk-off event is coming in March. Treasuries are starting to level off a bit here. Utilities had a good week to week and a half run relative to the S&P 500 prior to NVIDIA’s earnings report. Lumber/gold is still moving sideways. The financial media will keep pointing out that the S&P 500 and Nasdaq 100 are hitting new highs. I see several signals indicating that conditions are much more neutral than risk-on. Given some of the recent trending, it could be just another week or two before multiple signals indicate risk-off, which would put us squarely in early March, the time frame that I’ve been pointing to for a while.
How To Interpret the Signals: Within each strategy, there is a risk-on and risk-off investment recommendation, with the risk-off option being the more conservative of the two. When a particular signal indicates that investors should be risk-off, for example, subscribers should consider investing in the risk-off option and avoiding the risk-on option. The opposite, therefore, would be true when the signal flips to risk-on. In each strategy, you’d always be invested in one option or the other.
Here’s how to read the scorecard for each strategy:

Some of the strategies will be more aggressive than others. The “Leverage For The Long Run” strategy, for example, uses the S&P 500 and 2x-leveraged S&P 500. The more conservative “Lumber/Gold Bond” strategy, however, uses intermediate-term Treasuries and the S&P 500. In every case, a risk-off signal indicates that you should be invested in the more conservative of the two options, while a risk-on signal indicates you should be invested in the more aggressive one.
For a full user's guide on how to interpret each of the signals and how to put them to work in your portfolio, please click HERE.
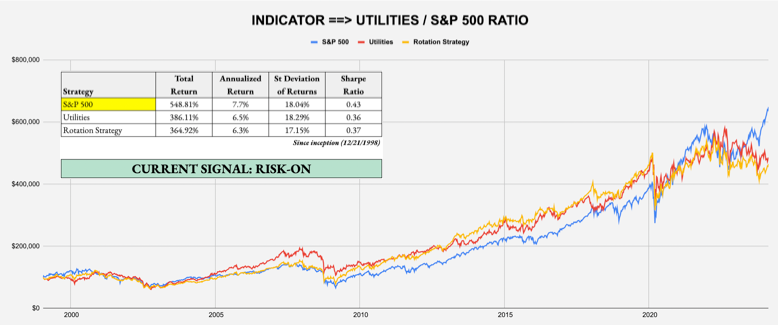
SHORT-TERM SIGNAL: UTILITIES/S&P 500 RATIO
Target Investor: Short-term traders with a higher risk tolerance interested in using an equity momentum strategy to anticipate changes in market risk tolerance.
Current Indicator: Risk-On
Strategy: Beta Rotation - Example: Invest in S&P 500 (SPY) over Utilities (XLU)
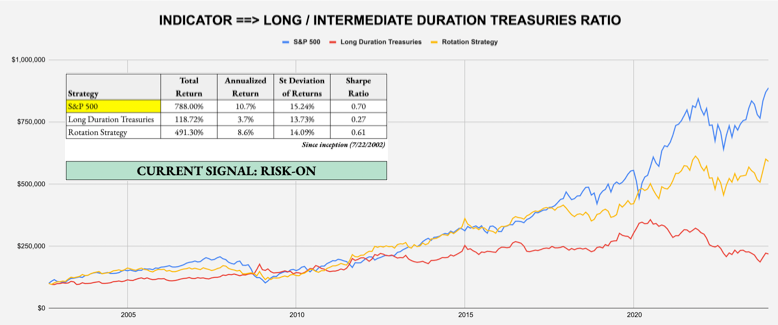
SHORT-TERM SIGNAL: LONG DURATION/INTERMEDIATE DURATION TREASURIES RATIO
Target Investor: Short-term traders with a higher risk tolerance who want to use the activity in the U.S. Treasury market to judge overall risk levels.
Current Indicator: Risk-On
Strategy: Tactical Risk Rotation - Example: Invest in S&P 500 (SPY) over Long-Duration Treasuries (VLGSX)
INTERMEDIATE-TERM SIGNAL: LUMBER/GOLD RATIO
Target Investor: Short- and long-term investors willing to trade more frequently using the classic cyclical vs. defensive asset comparison.
