
Solar’s Two-Speed Rally: Utility-Scale Strength Masks Residential Fragility
Early-2026 leadership in solar equities reflects record utility-scale build plans and policy-driven timing incentives, even as residential demand remains constrained by financing costs and tariff fric

Key Highlights
The Invesco Solar ETF (TAN) is up more than 23% year-to-date through February 24, 2026, versus less than 1% for the S&P 500 proxy SPY.¹
The U.S. Energy Information Administration expects a record 86 GW of new utility-scale capacity in 2026, with solar representing 51% of additions.²
Forward S&P 500 valuation sits at 21.5x earnings, while TAN’s portfolio shows low trailing multiples but uneven profitability.³ ⁴
IRS construction timing rules and new compliance guidance are actively shaping project acceleration and vendor selection.⁵ ⁶
Residential and inverter names carry elevated short interest, signaling persistent skepticism despite ETF-level strength.⁷
Relative Leadership Built on Policy Timing and Capex Cycles
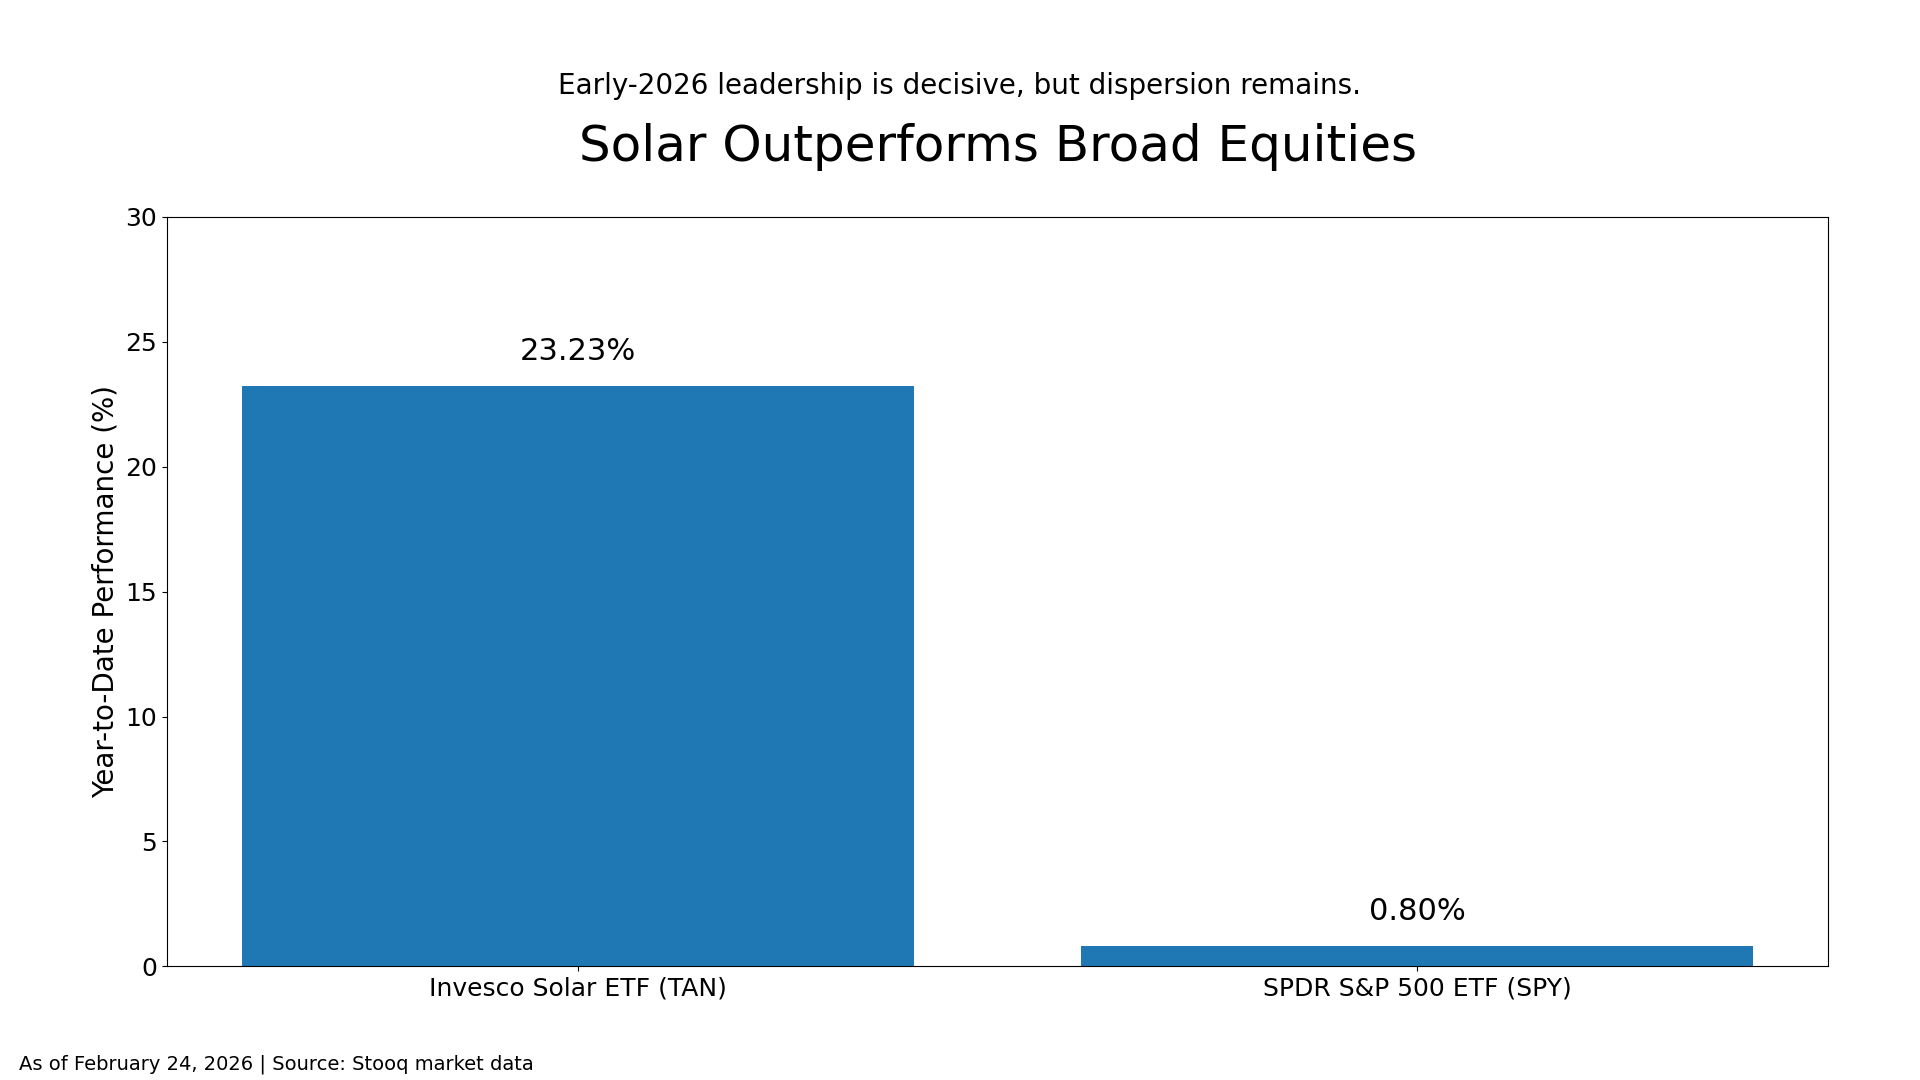
Solar has emerged as one of the early leaders of 2026. The Invesco Solar ETF (TAN) has gained approximately 23.23% year-to-date through February 24, while SPDR S&P 500 ETF (SPY) has advanced just 0.80% over the same period.¹ The outperformance is clear and investable.
Yet the narrative underpinning the move is more nuanced than “solar demand is booming.” The sector is rebounding from a prolonged stretch of policy uncertainty, rate volatility, and inventory dislocations. Investors are selectively re-engaging the utility-scale segment, while remaining cautious on residential exposure.
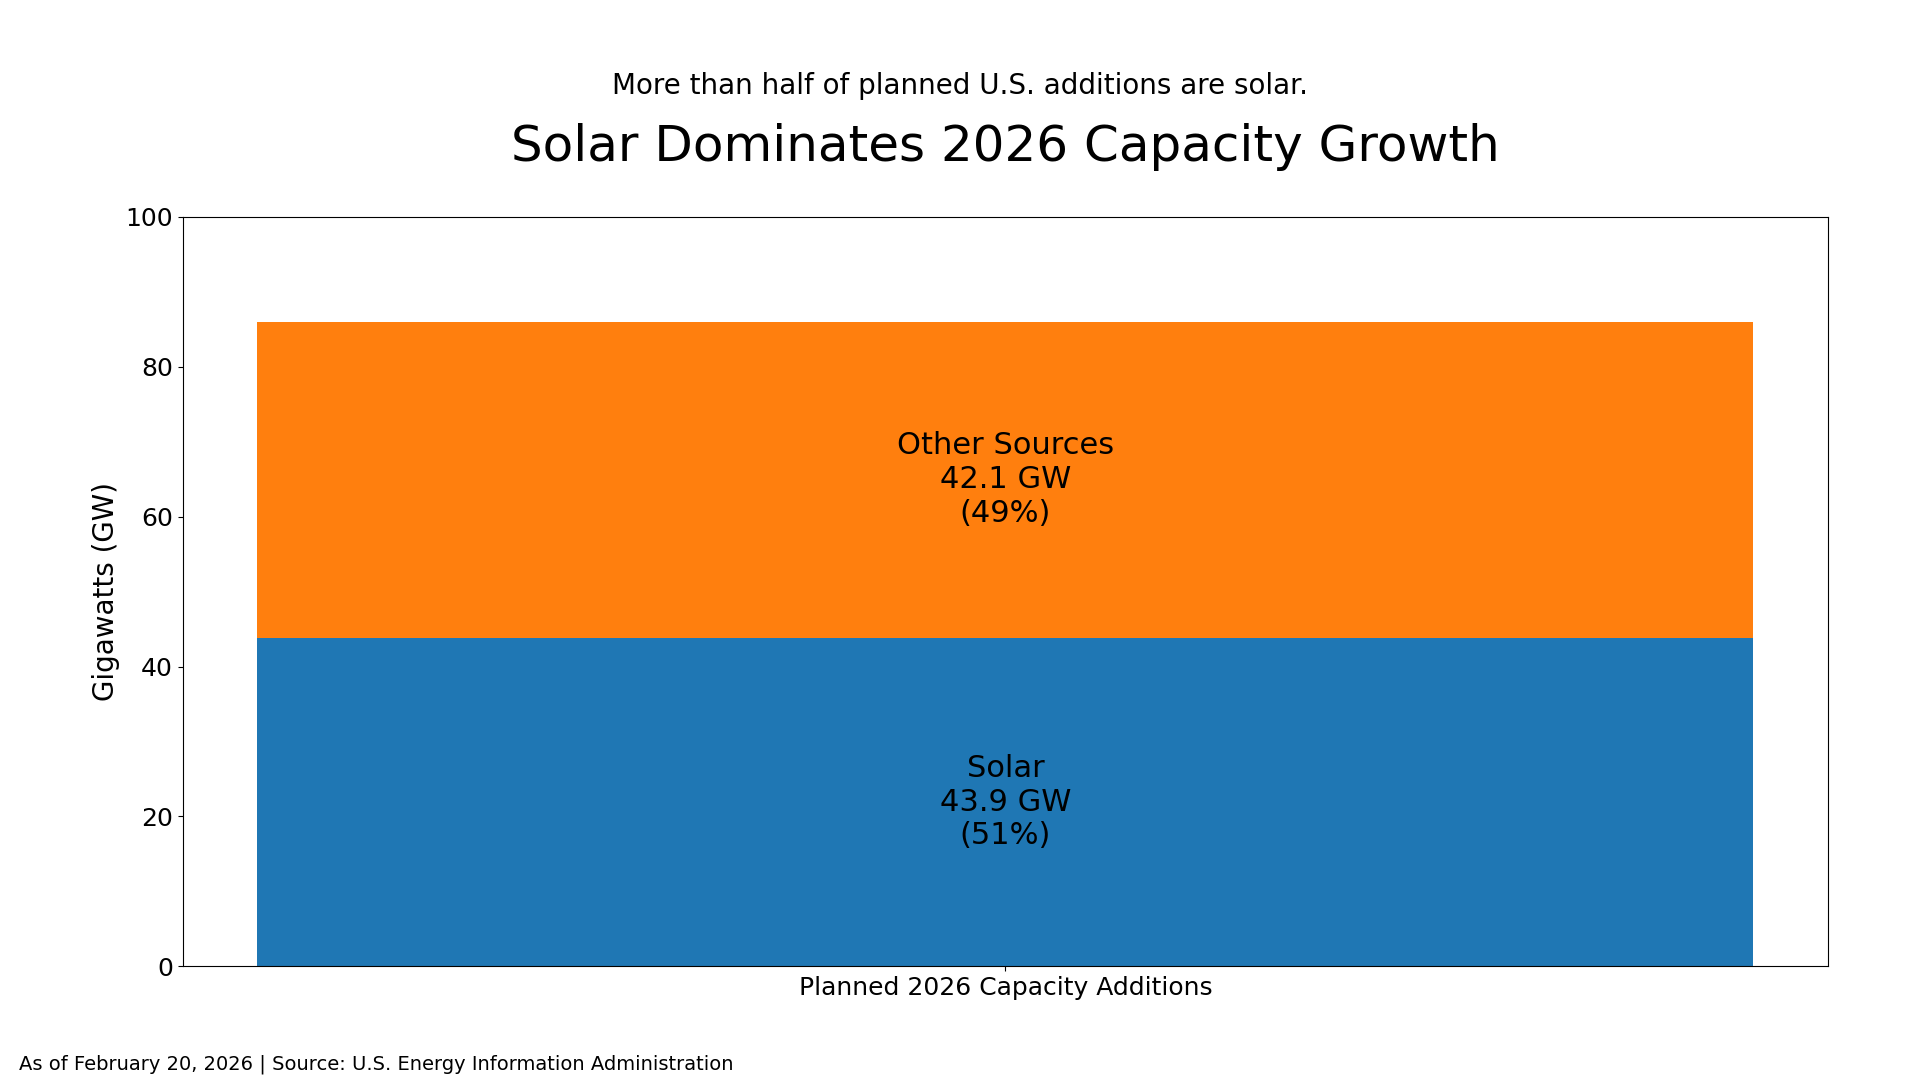
The structural driver is visible in federal data. The U.S. Energy Information Administration projects that developers plan to add a record 86 gigawatts of utility-scale generating capacity in 2026, with solar accounting for 51% of that total.² In its latest Short-Term Energy Outlook, the EIA expects solar generation to increase 17% in 2026 and 23% in 2027.⁸ Solar is no longer marginal capacity; it is central to incremental supply.
Timing mechanics matter. IRS Notice 2025-42 specifies that full clean electricity credit eligibility depends on projects beginning construction before July 5, 2026 under defined continuity standards.⁵ Recent Treasury and IRS guidance regarding “prohibited foreign entities” and “material assistance” adds compliance complexity that affects procurement and supply chains.⁶ Developers and manufacturers are reacting accordingly, accelerating activity where possible and adjusting sourcing decisions. Policy is not background noise. It is actively shaping order flow.
This explains the two-speed tape. Companies tied to utility-scale infrastructure and domestic manufacturing are benefiting from capex visibility and policy leverage. Residential installers and inverter suppliers remain more exposed to financing conditions and tariff variability.
Valuation, Rates, and the Economics of Financing
Solar equities remain high-beta and rate-sensitive. Financing costs influence customer economics, tax equity availability, and project internal rates of return.
As of late February, the 10-year Treasury yield stands near 4.08%, the 2-year around 3.48%, and the average 30-year fixed mortgage rate approximately 6.01%.⁹ These levels are not prohibitive, but they are restrictive relative to the ultra-low-rate era that fueled residential solar adoption. Household economics remain financing-driven.
At the index level, FactSet reports the S&P 500 trading at 21.5x forward 12-month earnings, above both its 5-year and 10-year averages.³ Multiple compression since year-end has been modest. Against that backdrop, TAN’s December 31, 2025 fact sheet shows a trailing P/E of 10.41x and price-to-book of 2.38x, alongside a negative weighted return on equity.⁴
The temptation is to label solar “cheap.” That framing is incomplete. Profitability dispersion within the sector is significant. Some companies generate substantial cash flow and operate with contract visibility; others remain loss-making or margin-constrained. Traditional P/E comparisons can obscure cyclicality and policy exposure.
Trade friction compounds the complexity. Enphase Energy disclosed that reciprocal tariffs reduced non-GAAP gross margin by 5.1 percentage points in Q4 2025.¹⁰ That magnitude directly connects macro policy to reported profitability. On the input side, copper prices averaged roughly $12,987 per metric ton in January 2026, according to IMF data via FRED.¹¹ For balance-of-system suppliers, commodity exposure can materially affect gross margins where contracts lack pass-through mechanisms.
Positioning data reinforces the divergence. Short interest as of the January 30, 2026 settlement date shows Sunrun with approximately 56.76 million shares sold short, near one quarter of float. SolarEdge and Enphase also carry elevated short percentages. First Solar’s short interest is materially lower by comparison.⁷ Investors are distinguishing between durable earnings profiles and recovery or financing-dependent models.
Company Dispersion Defines the Opportunity Set
First Solar illustrates the utility-scale anchor of the sector. The company reported 2025 net sales of $5.2 billion and net income per diluted share of $14.21, with a year-end gross cash balance of $2.9 billion. It guided 2026 net sales of $4.9 to $5.2 billion and adjusted EBITDA of $2.6 to $2.8 billion.¹² The stock reacted sharply to guidance, underscoring how even fundamentally profitable names remain sensitive to cadence assumptions and policy framing.¹³
