
Stagflation With $39 Trillion in Debt Isn’t the 1970s. It’s a Depression.
There Is No Volcker Option When the Government Owes More Than the Economy Produces

KEY HIGHLIGHTS
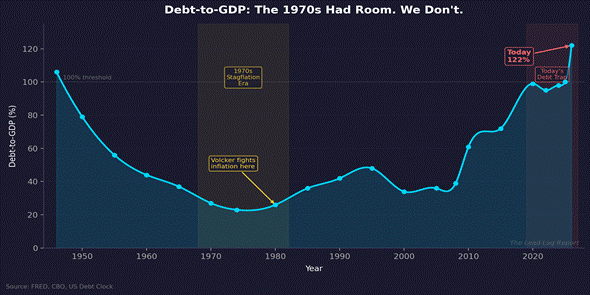
• U.S. national debt has crossed $39 trillion — a 43x increase from the $908 billion Volcker had to work with in 1980. Debt-to-GDP sits at 122%, nearly five times the ~26% level during the last stagflation.
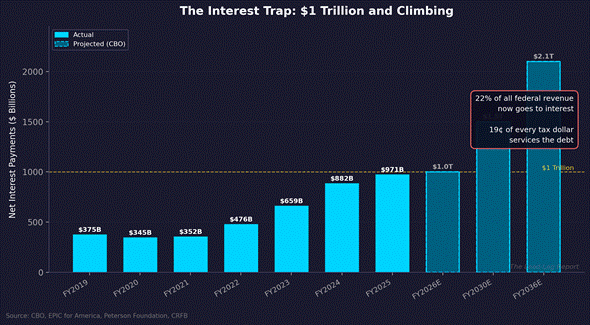
• Net interest on the federal debt will exceed $1 trillion in FY2026 — nearly triple the $375 billion paid in FY2019. Every additional 1% in rates adds roughly $390 billion in annual interest expense.
• GDP growth collapsed to 0.7% annualized in Q4 2025, nonfarm payrolls turned negative (-92,000 in February), and consumer sentiment sits at 53.3 — near historic lows.
• The Fed cannot raise rates to fight inflation without detonating the deficit via interest costs. It cannot hold rates without letting inflation erode real income. Both paths lead to the same place.
• This is not the 1970s. Stagflation at 26% debt-to-GDP was painful but survivable. Stagflation at 122% debt-to-GDP is a depression in slow motion.
Everyone keeps saying we’re heading for a 1970s-style stagflation. I think they’re being too optimistic.
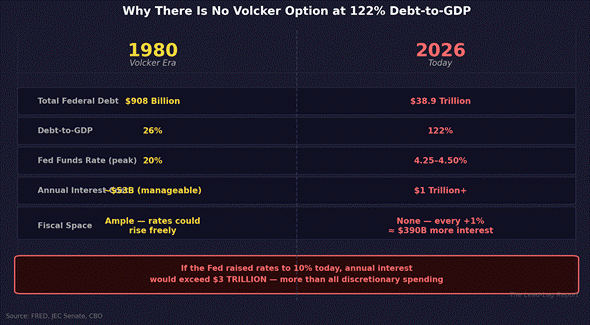
The 1970s stagflation was brutal — double-digit inflation, unemployment near 11%, gas lines, and two deep recessions. But here is the part nobody wants to confront: the United States government owed $908 billion in 1980.[1] Debt-to-GDP was roughly 26%.[2] That number matters more than anything else in this discussion. Because when Paul Volcker raised the federal funds rate to 20% to kill inflation, the government could absorb the pain. Interest costs were manageable. The fiscal structure held.
Today the national debt stands at $38.9 trillion and counting.[3] Debt-to-GDP has hit 122%.[4] Net interest payments will exceed $1 trillion this fiscal year alone.[5] And inflation, while lower than the 1970s peak, is proving stubbornly sticky in a slowing economy with a weakening labor market. If you think this ends like the 1970s, I have bad news. The 1970s ended because Volcker had room to fight. We don’t.
The Math That Changes Everything
Start with the basic arithmetic. In 1980, the entire federal debt was $908 billion. Volcker pushed the fed funds rate to 20%, and interest costs spiked — but on a debt load that was a fraction of the economy. Even at punishing rates, the government could service the debt, run deficits, and eventually grow out of the hole as inflation collapsed and the economy recovered.
Now run that same experiment today. The federal government owes $38.9 trillion — 43 times the 1980 figure. The CBO projects net interest payments of $1 trillion in fiscal 2026, nearly triple the $375 billion paid in FY2019.[5][6] In just the first quarter of FY2026, the government spent $270 billion on interest — more than the entire annual interest bill in FY2017.[7] Twenty-two cents of every dollar of federal revenue now goes to servicing debt. That is not a rounding error. That is a structural constraint.
Here is the critical point: every 1% increase in interest rates adds roughly $390 billion in annual interest expense on $39 trillion of debt. If the Fed raised rates to just 6% — still well below Volcker’s 20% — the annual interest bill would approach $2.3 trillion, consuming nearly every dollar of individual income tax revenue.[8] If it raised to 10%, interest payments would exceed $3 trillion — more than all discretionary spending combined. There is no Volcker option at 122% debt-to-GDP.
The Fiscal Dominance Trap
This is what economists call fiscal dominance — the condition where the size of the government’s debt constrains the central bank’s ability to fight inflation. It is the monetary policy equivalent of fighting a war with one hand tied behind your back. MSCI research published in January warned bluntly that “U.S. debt-to-GDP ratios were around 30% during the early-1980s stagflation” and that “the currently much higher debt levels leave much less margin for error.”[9] The Yale Budget Lab has documented how elevated federal debt increases inflationary pressure through multiple channels — crowding out private investment, amplifying inflation expectations, and constraining monetary policy flexibility. Their models show that a permanent 1% increase in the primary deficit — roughly the cost of extending the individual TCJA provisions — erodes household purchasing power by $300 to $1,250 per household over five years.[10]
Think about what this means in practice. The Fed cannot raise rates aggressively without blowing out the deficit. But it cannot hold rates steady while inflation erodes real incomes and consumer purchasing power collapses. The 1970s presented a binary choice: tolerate inflation or tolerate recession. That choice was painful but solvable. Today there is a third variable — the debt — and it makes both options lead to the same place.
Raise rates? Interest costs explode, the deficit balloons, the government has to borrow more at higher rates to pay the interest on existing debt, and you get a debt spiral that feeds on itself. Hold rates? Inflation stays elevated, real wages decline, consumer spending contracts, tax revenues fall, and the deficit grows anyway. The CBO already projects interest costs doubling to $2.1 trillion by FY2036 under its baseline assumptions — and those assumptions do not include a stagflationary scenario.[6]
Both paths converge on the same destination: a grinding, slow-motion depression where the government’s debt load becomes the dominant variable in every economic outcome. The 1970s gave policymakers bad options. Today’s fiscal structure gives them no options.
The Data Is Already Turning
This is not a theoretical exercise. The data is deteriorating in real time. Q4 2025 GDP was revised down to 0.7% annualized — the weakest quarter in a year.[11] Nonfarm payrolls turned negative in February, with the economy shedding 92,000 jobs.[12] Unemployment ticked up to 4.4%. Federal government employment has declined by 330,000 since its October 2024 peak — an 11% reduction.[13]
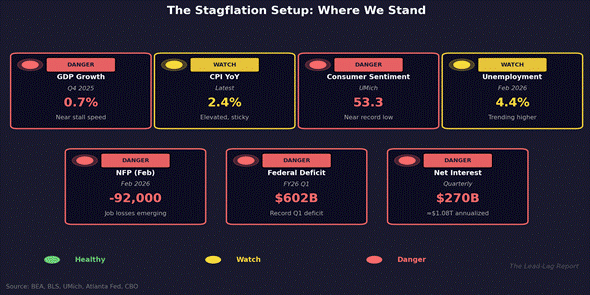
Consumer sentiment plunged to 53.3 in March, near record lows, with middle and upper-income consumers — the ones with stock wealth and sensitivity to gas prices — showing the sharpest declines.[14] Short-run economic expectations cratered 14% in a single month. Year-ahead personal finance expectations sank 10%. These are not numbers that suggest a garden-variety slowdown. These are numbers that suggest something is breaking.
The Conference Board’s Leading Economic Index has declined for three consecutive months through January.[15] Inflation, while moderating on headline at 2.4%, is set to re-accelerate as tariff passthrough and elevated energy costs work through the supply chain.[16] Core CPI at 2.5% is the lowest since March 2021, but consumer inflation expectations are anchored at 3.0% on both the three-year and five-year horizon. Markets now price an 8.3% probability of a rate hike and near-zero probability of cuts. The Fed has lost optionality in both directions.
This is the stagflation setup. Slowing growth, rising unemployment, sticky inflation, and a consumer that is already on its knees. But unlike the 1970s, there is no cavalry coming. The Fed is frozen by the debt. The government is running a $1.8 trillion annual deficit — 5.8% of GDP — and just in Q1 of FY2026, the deficit was already $602 billion. Nineteen cents of every tax dollar is already spoken for before a single road is paved or a single soldier is paid.[8]
The Lead-Lag Dynamic: Debt Is the Lead
I have written for years about the lead-lag relationship between different parts of the economy — how one variable’s movement today telegraphs another variable’s movement tomorrow. In every prior stagflationary episode, inflation was the lead and everything else was the lag. The playbook was straightforward: crush inflation with rates, accept the recession, and rebuild.
This time is structurally different. Debt is the lead. The $39 trillion anchor reshapes every policy response, constrains every tool, and guarantees that any attempt to fight inflation amplifies the fiscal crisis, while any attempt to manage the fiscal crisis lets inflation run. The lag is everything — consumer spending, corporate earnings, employment, housing, and the dollar itself.
In the 1970s, the economy could absorb a Volcker shock because the balance sheet was clean. Today the balance sheet is the problem. The government is the largest borrower in the world, competing with the private sector for capital, and every incremental rate increase makes the borrowing more expensive, the deficit larger, and the eventual reckoning more severe.
People keep looking for a historical analog. They point to the 1970s. But the 1970s ended with a rescue. The rescue was possible because the debt was small. There is no rescue available when the patient is $39 trillion in the hole and adding $8 billion a day.[17] CBO projections show debt held by the public growing another $26 trillion over the next decade, with the average interest rate on that debt climbing another 50 basis points. Those are baseline assumptions — no recession, no oil shock, no financial crisis baked in. The actual trajectory is almost certainly worse.[6]
This is not stagflation. This is the early stage of something we do not have a modern template for — a developed-world debt depression, playing out in slow motion, masked by nominal GDP growth and government transfer payments that themselves add to the debt. The 1970s analogy makes people feel comfortable because that story had an ending. This one might not.
Few understand this.
— — —
Notes
[1] MoneyLion/US Debt Clock, “U.S. National Debt Growth by Year.” Total federal debt in 1980: $907.7 billion.
[2] FRED/CBO data via MoneyLion. Debt-to-GDP in 1980: approximately 26%. Debt-to-GDP in 1974: approximately 23%, the lowest point since World War II.
[3] Joint Economic Committee, U.S. Senate, “Debt Dashboard,” March 4, 2026. Total gross national debt: $38.86 trillion.
[4] FRED, “Total Public Debt as Percent of Gross Domestic Product,” Q4 2025: 122.49%.
[5] American Action Forum, “Interest Payments on the National Debt,” March 24, 2026. CBO projects $1.0 trillion in net interest for FY2026.
[6] Committee for a Responsible Federal Budget, “Net Interest Costs Will Double, Again, Over the Next Decade,” February 24, 2026. Interest nearly tripled from $375B in FY2019 to $971B in FY2025.
[7] EPIC for America, “Interest Spending Tracker: Q1 of FY 2026,” January 21, 2026. Q1 FY2026 net interest: $270.3B; 22.1% of revenues; 14.8% of outlays.
[8] American Action Forum (March 24, 2026): “For every dollar of taxes and fees the government collects, 19 cents will go to pay interest on the national debt” in FY2026.
[9] MSCI Research, “Fiscal Dominance Lurks Behind Uncertain Central-Bank Policies,” January 15, 2026.
[10] Yale Budget Lab, “The Inflationary Risks of Rising Federal Deficits and Debt,” March 12, 2025.
[11] Bureau of Economic Analysis, “GDP (Second Estimate), 4th Quarter and Year 2025,” March 13, 2026. Q4 2025 GDP: 0.7% annualized.
[12] Bureau of Labor Statistics, “Employment Situation Summary,” March 6, 2026. NFP: -92,000 in February 2026; unemployment: 4.4%.
[13] Ibid. Federal government employment has declined by 330,000 (11.0%) since October 2024 peak.
[14] University of Michigan, “Surveys of Consumers,” March 2026. Consumer Sentiment Index: 53.3.
[15] Conference Board, “Leading Economic Index,” March 19, 2026. LEI declined 0.1% in January 2026 to 97.5.
[16] Bureau of Labor Statistics, “Consumer Price Index Summary,” March 11, 2026. CPI: 2.4% YoY in February 2026; core CPI: 2.5%.
[17] Fortune, “The national debt just crossed $39 trillion,” March 18, 2026. JEC: debt increasing approximately $8.03 billion per day.
The Lead-Lag Report is provided by Lead-Lag Publishing, LLC. All opinions and views mentioned in this report constitute our judgments as of the date of writing and are subject to change at any time. Information within this material is not intended to be used as a primary basis for investment decisions and should also not be construed as advice meeting the particular investment needs of any individual investor. Trading signals produced by the Lead-Lag Report are independent of other services provided by Lead-Lag Publishing, LLC or its affiliates, and positioning of accounts under their management may differ. Please remember that investing involves risk, including loss of principal, and past performance may not be indicative of future results. Lead-Lag Publishing, LLC, its members, officers, directors and employees expressly disclaim all liability in respect to actions taken based on any or all of the information on this writing.