

Below is an assessment of the performance of some of the most important sectors and asset classes relative to each other with an interpretation of what underlying market dynamics may be signaling about the future direction of risk-taking by investors. The below charts are all price ratios which show the underlying trend of the numerator relative to the denominator. A rising price ratio means the numerator is outperforming (up more/down less) the denominator. A falling price ratio means underperformance.
LEADERS: WHILE THE ECONOMY LOOKS HEALTHY, UTILITIES CONTINUE TO LEAD
Utilities (XLU) – A Normal Breather, But Risk-Off Still Looms
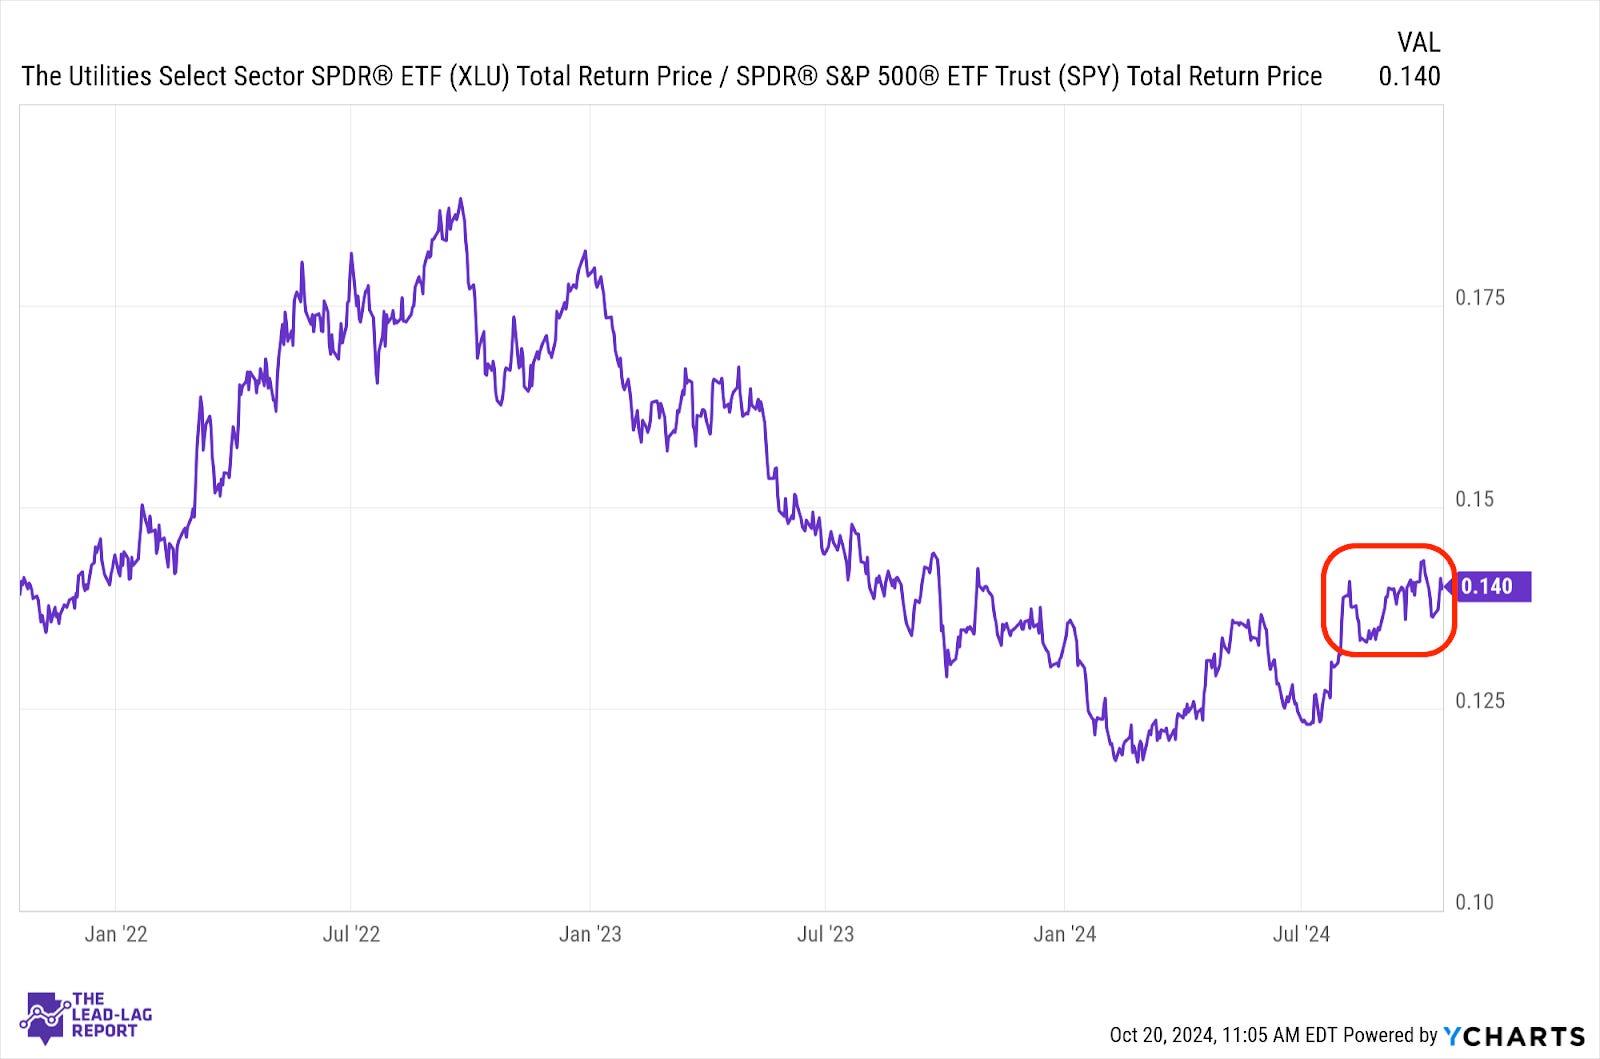
Utilities are no longer outperforming with the strength they did in July, but I don’t think it’s an accident that this is still the best performing sector year-to-date. A bit of a breather here is normal given the positive nature of the latest data, but the fact that it’s still keeping pace is rather impressive. When utilities lead, it’s usually for risk-off reasons. Those reasons may not be playing out right now, but they’re clearly looming in investors’ eyes.
Technology (XLK) – Earnings Are Up Next
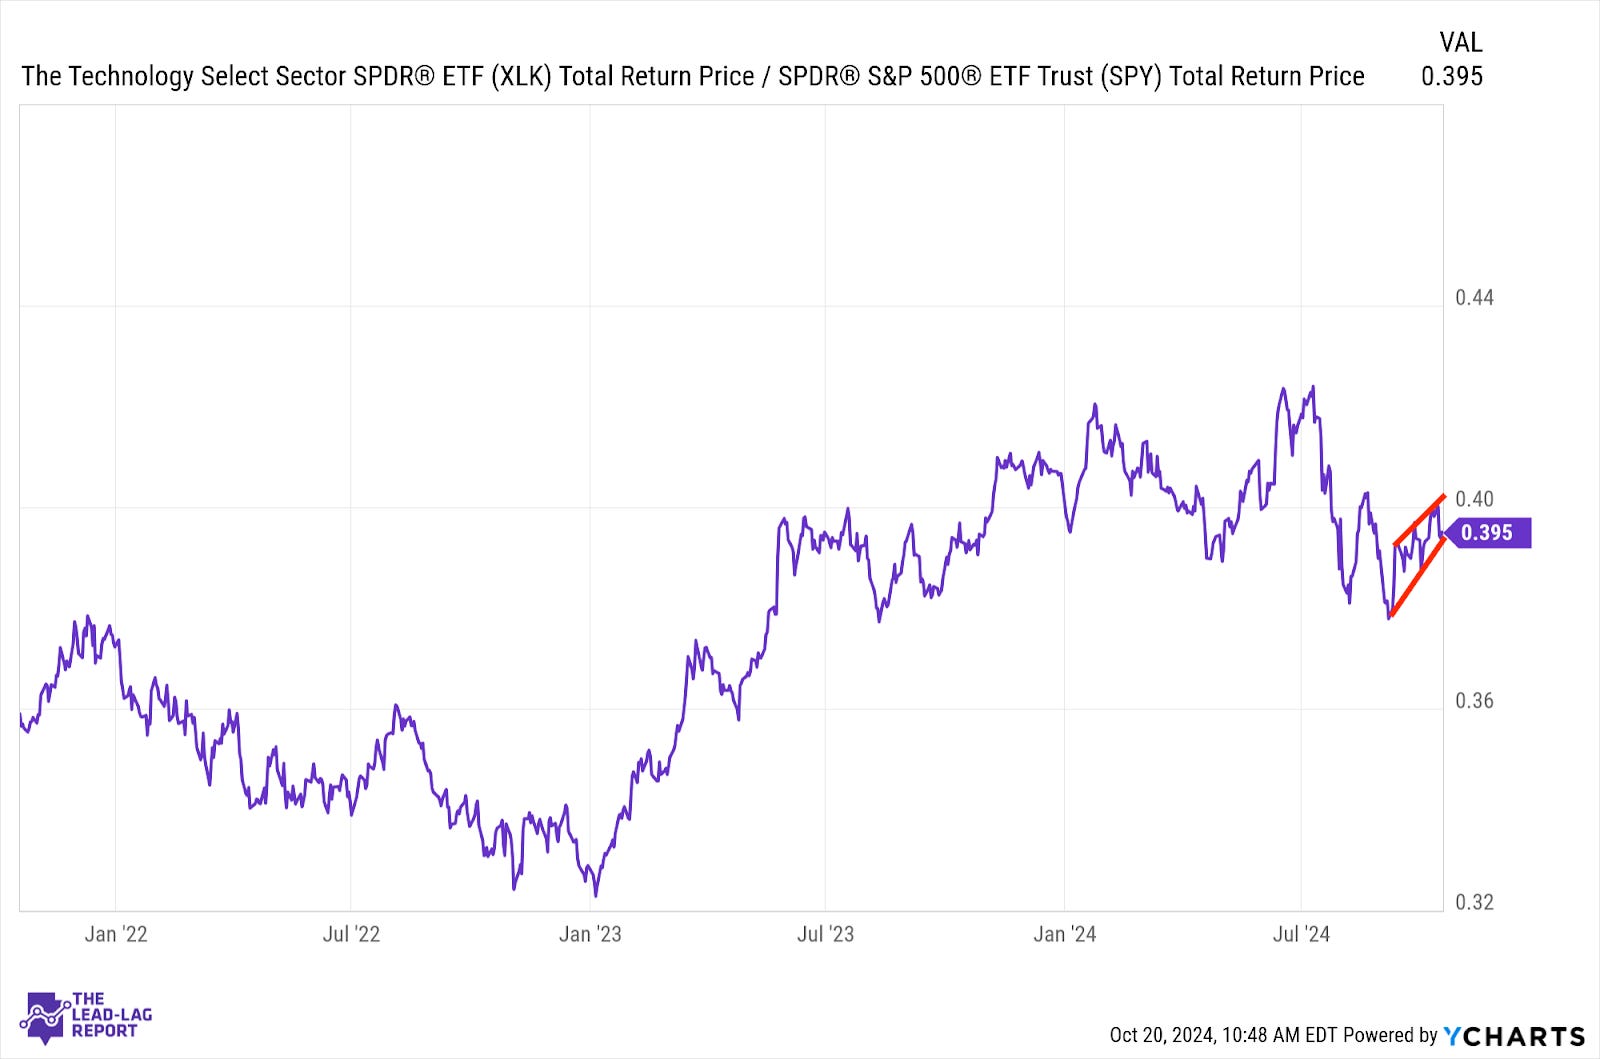
The uptrend in tech is still intact, although it’s experienced a lot of bounces over the past two months. The higher highs, higher lows trend in this ratio is encouraging, but the lack of sustainable outperformance demonstrates that tech is no longer the behemoth that it used to be. Earnings will be the next big obstacle to overcome and the markets will likely be paying close attention to the growth rates of the big AI players.
Industrials (XLI) – The Steadiest Outperformer
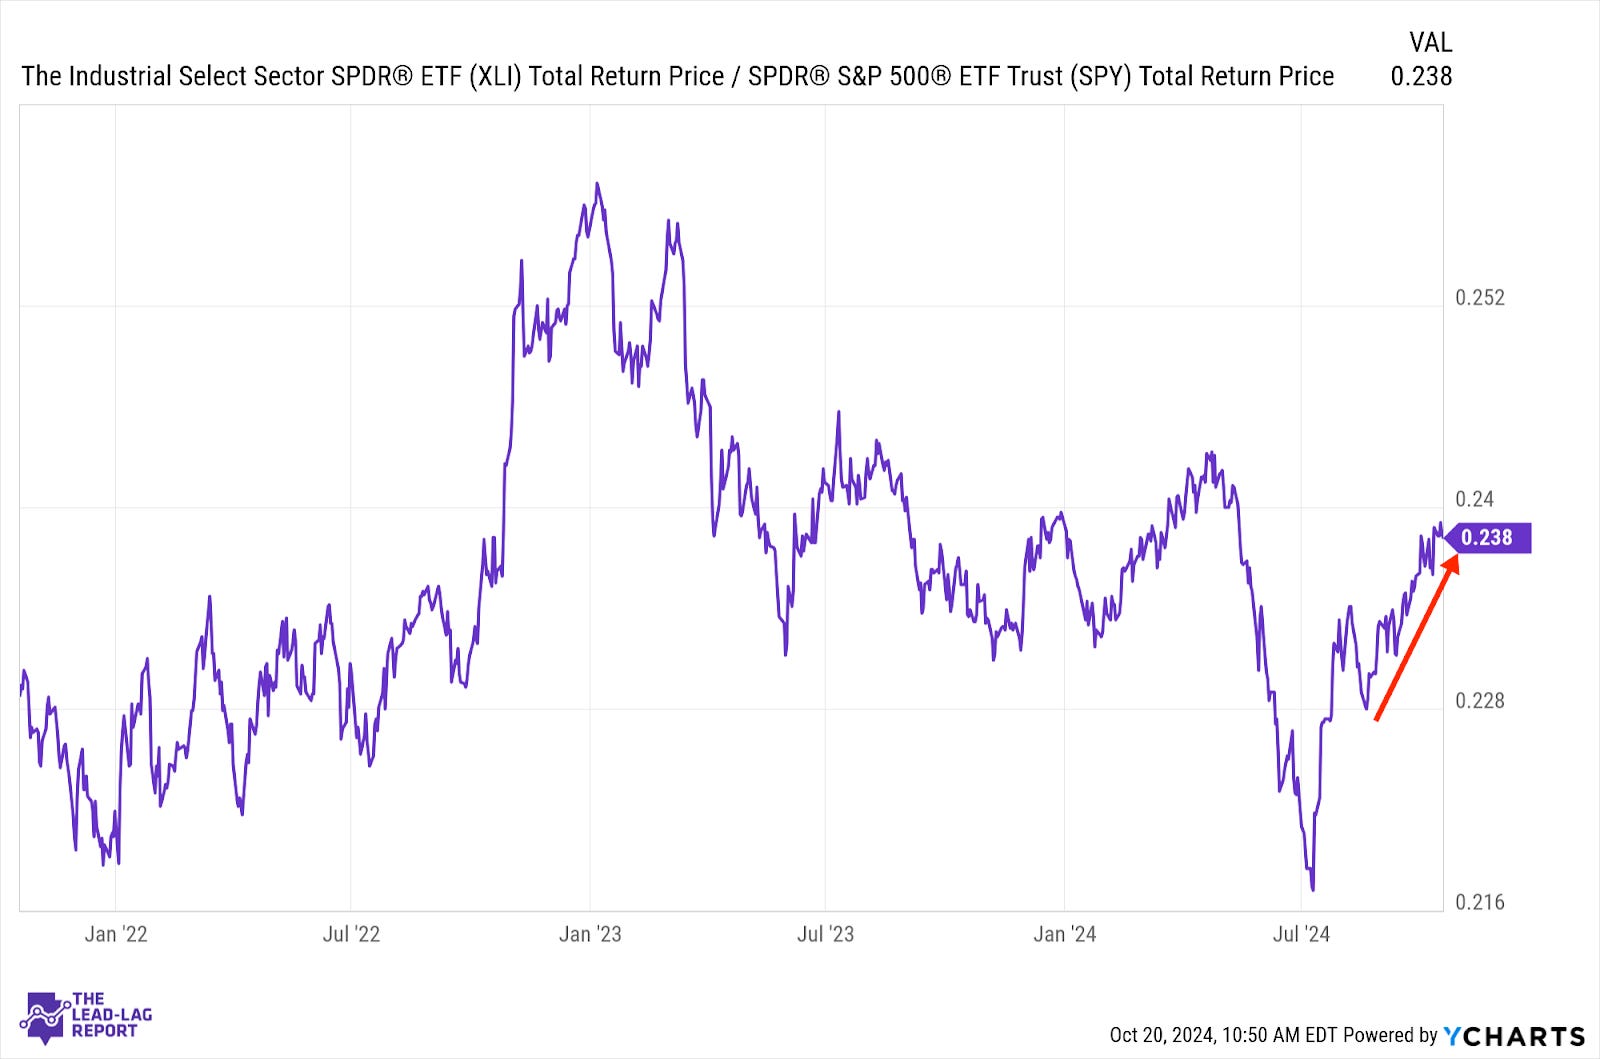
Industrials have been and remain the most consistent market outperformer since the start of the 3rd quarter. This is reflective of the steady growth, low unemployment, moderating inflation environment we’re in the midst of that traditionally benefits cyclical sectors. The lack of participation from other sectors within this group shows there’s some disconnects in what’s working right now, but leadership from this sector is a good sign.
Financials (XLF) – Positive Signs From The Big Banks
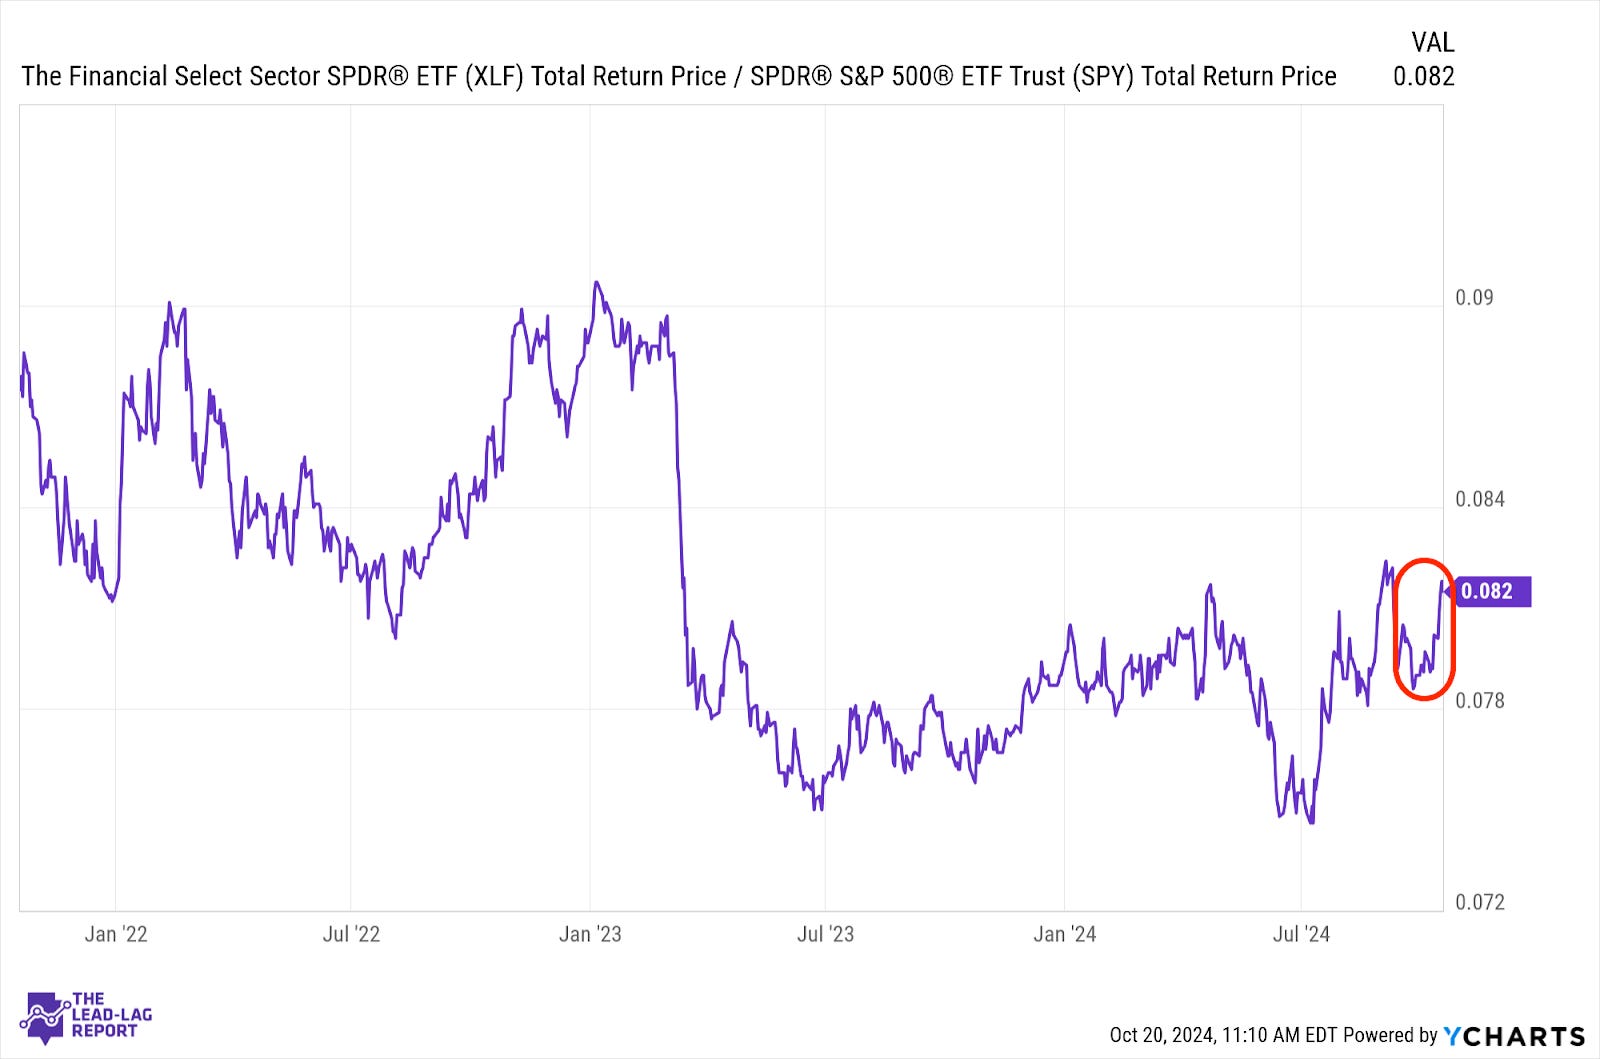
Rate sensitive issues have picked up some ground over the past couple weeks, but this is clearly the result of a solid start to the Q3 earnings season. Most notable is the fact that several big banks reported a big improvement in investment banking activity. That’s a sign that they feel much better about the overall economic outlook and M&A activity is beginning to return.
Materials (XLB) – Weakness Overseas Caps Upside Right Now
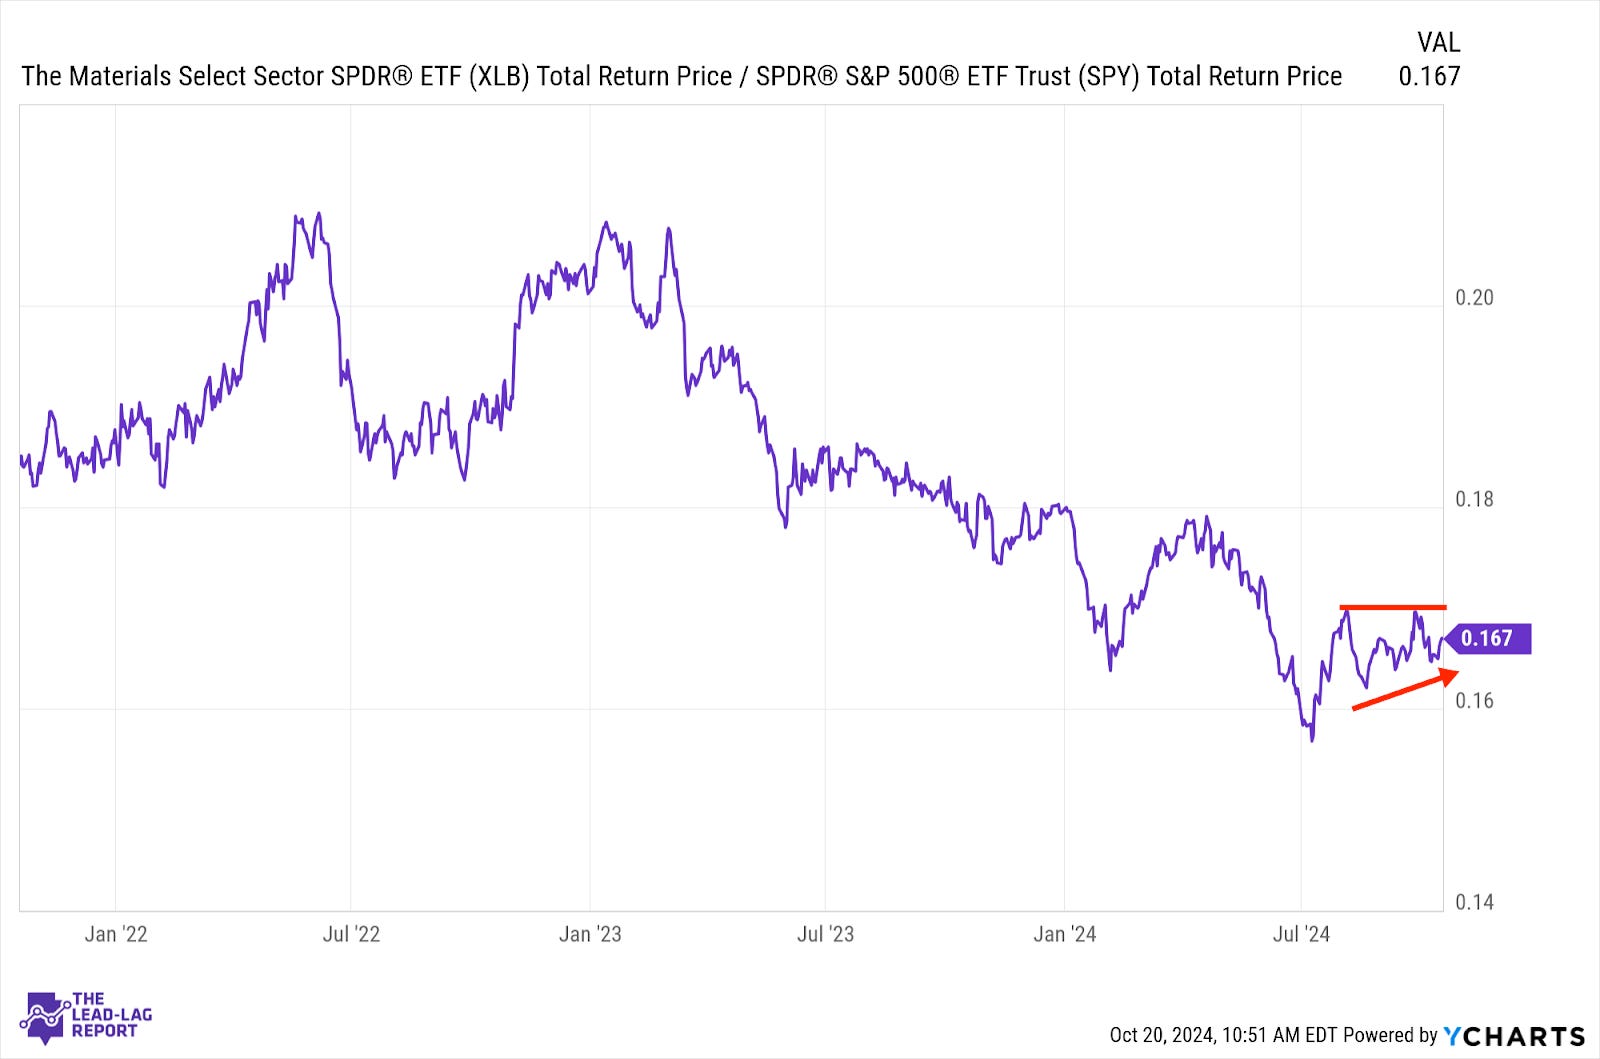
Materials stocks continue to fight through a choppy period where the demand for commodities broadly looks stronger, but it’s standing on unsteady ground. The struggles with lumber prices exemplify this and the lack of demand for energy is a big concern. Even though the U.S. appears to still be in good shape, the struggles globally from China and parts of Europe are capping upside.
Treasury Inflation Protected Securities (SPIP) – The TIPS/Gold Combination Signals That Risk Is Still High
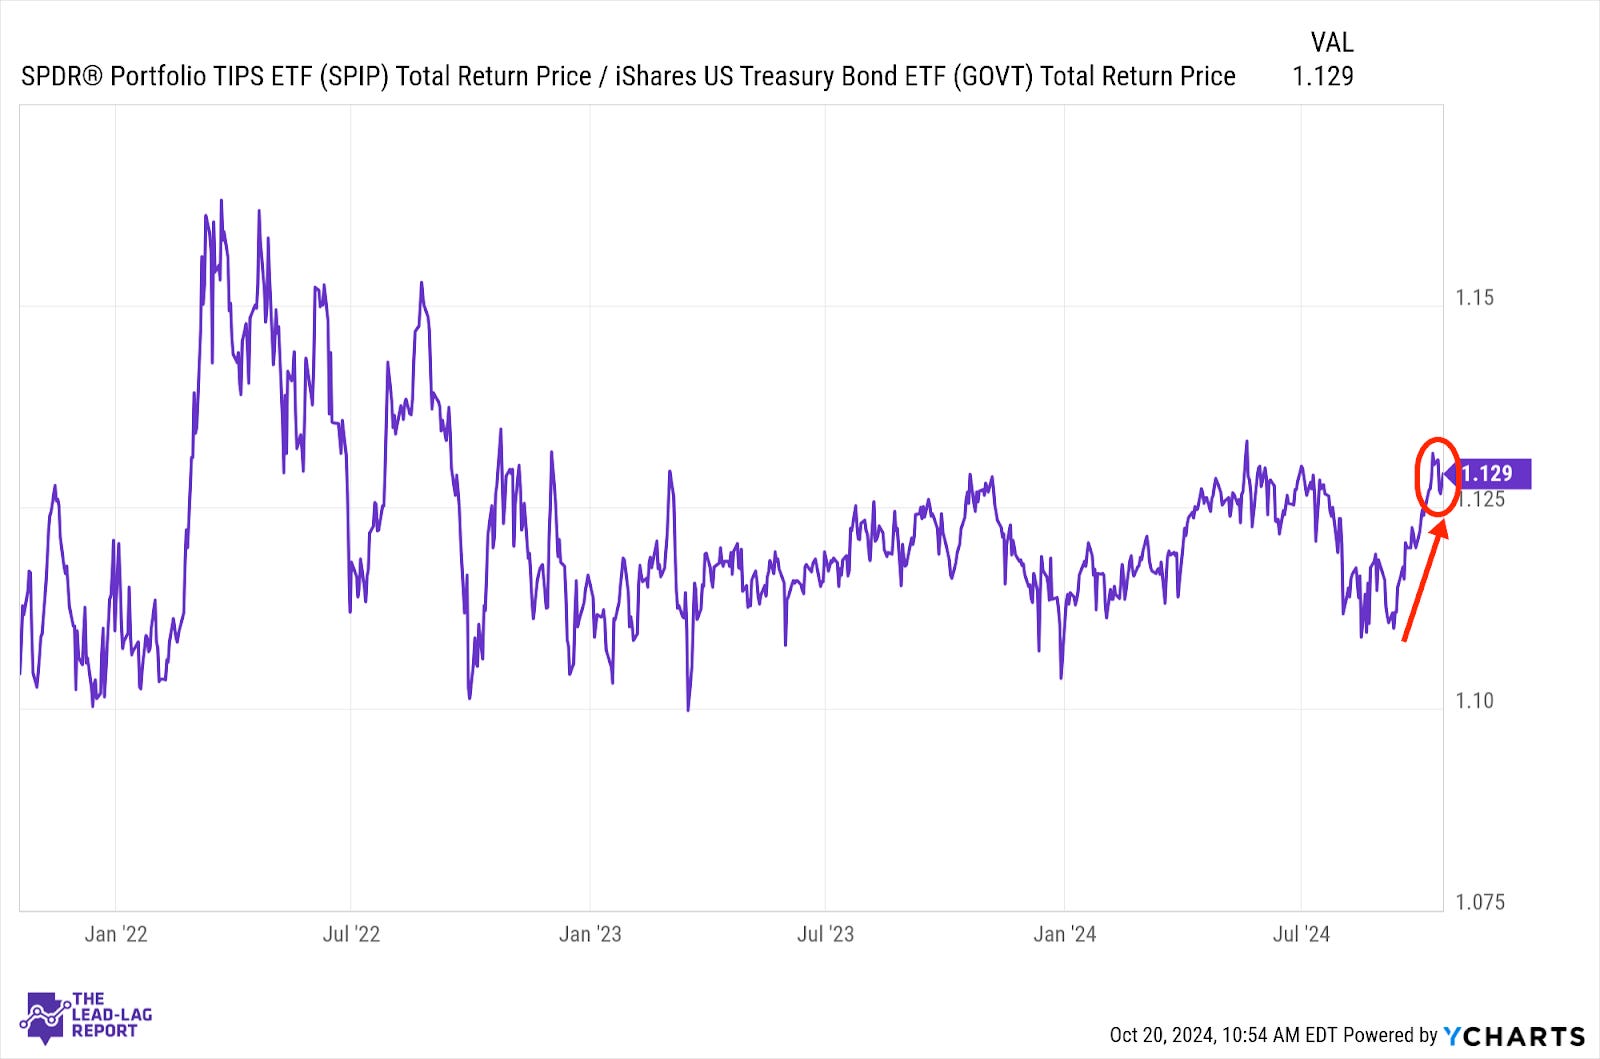
TIPS took a bit of a break last week, but not enough to reverse the current uptrend in inflation protection. As long as this group is outperforming Treasuries and gold is setting new all-time highs, I think we need to acknowledge that inflation is still a risk, even though annualized rates are getting back to the 2% range worldwide. Stimulus efforts and higher global liquidity will almost certainly be the catalysts for this.
Junk Debt (JNK) – Still The Play
