

Below is an assessment of the performance of some of the most important sectors and asset classes relative to each other with an interpretation of what underlying market dynamics may be signaling about the future direction of risk-taking by investors. The below charts are all price ratios which show the underlying trend of the numerator relative to the denominator. A rising price ratio means the numerator is outperforming (up more/down less) the denominator. A falling price ratio means underperformance.
LEADERS: SUCKING THE BULLS IN ONE MORE TIME
Technology (XLK) – Tariff Risk Remains
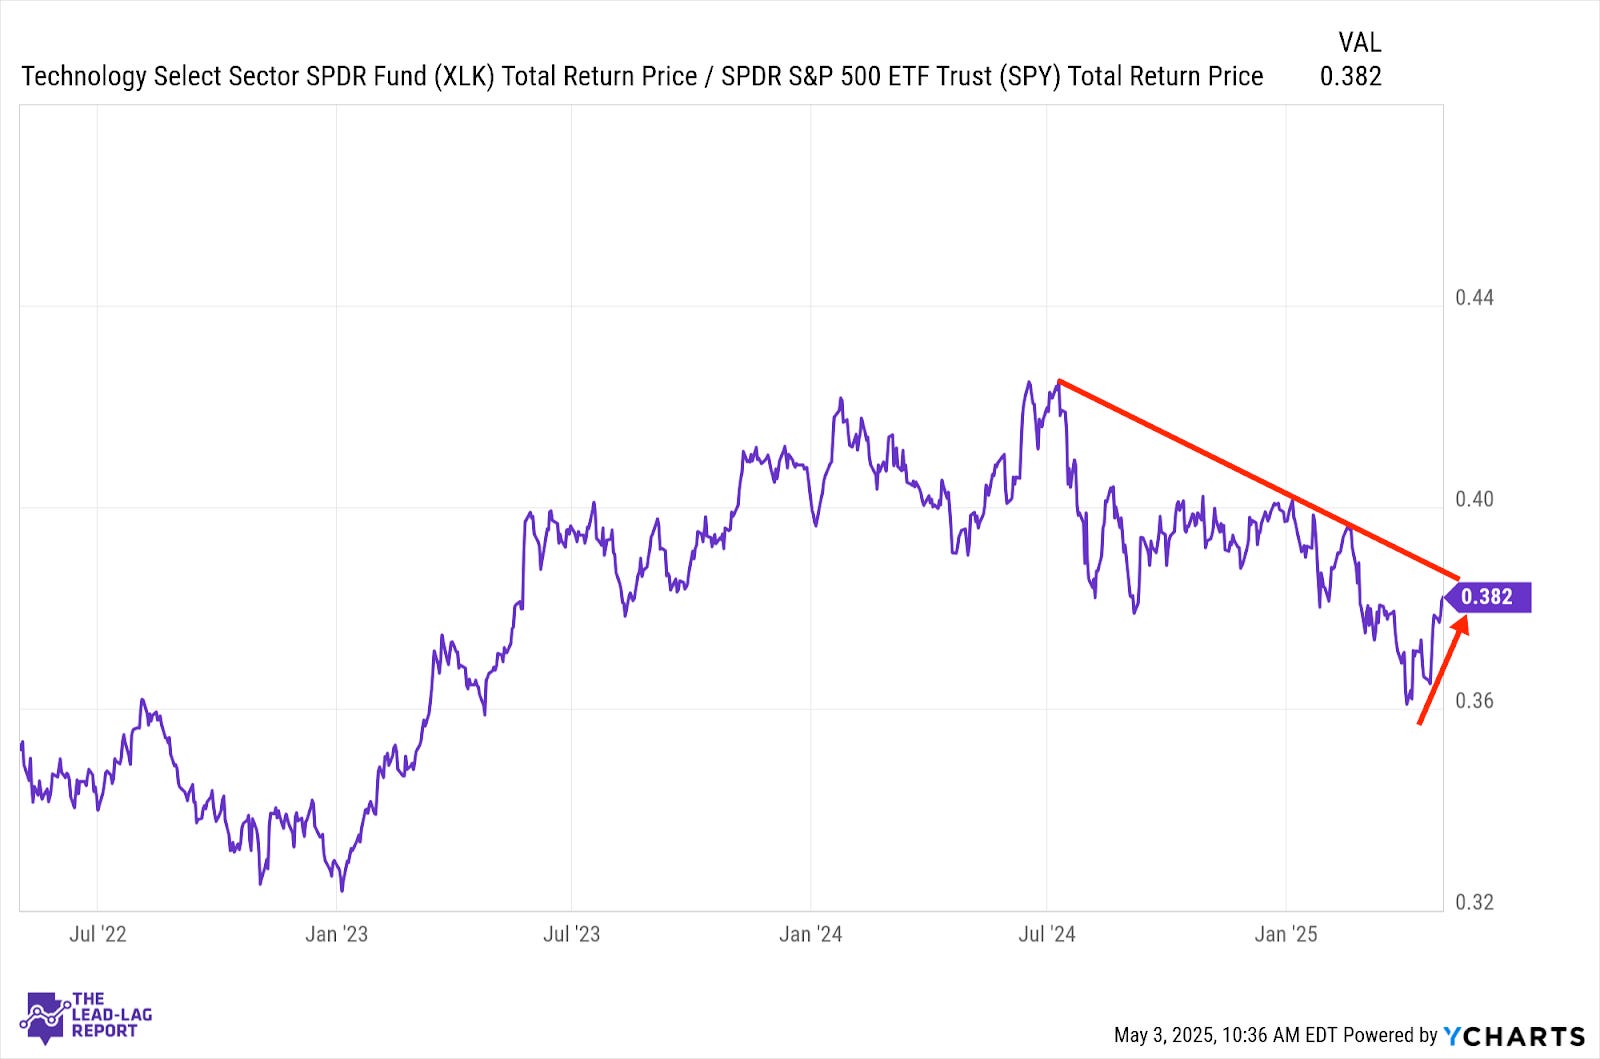
Tech is finally coming back to life as the potential for de-escalation in the trade war is improving sentiment. It’s tough to say if the rally is fully justified. The magnificent 7 components of this sector are still facing big tariff risks given their global footprints. I can see a scenario where Trump decides to give the big tech companies a break, so their impact doesn’t overtly damage the economy, but NVIDIA’s $5 billion charge recently demonstrates that there’s a lot of risk still outstanding.
Industrials (XLI) – Up Or Down Trend?
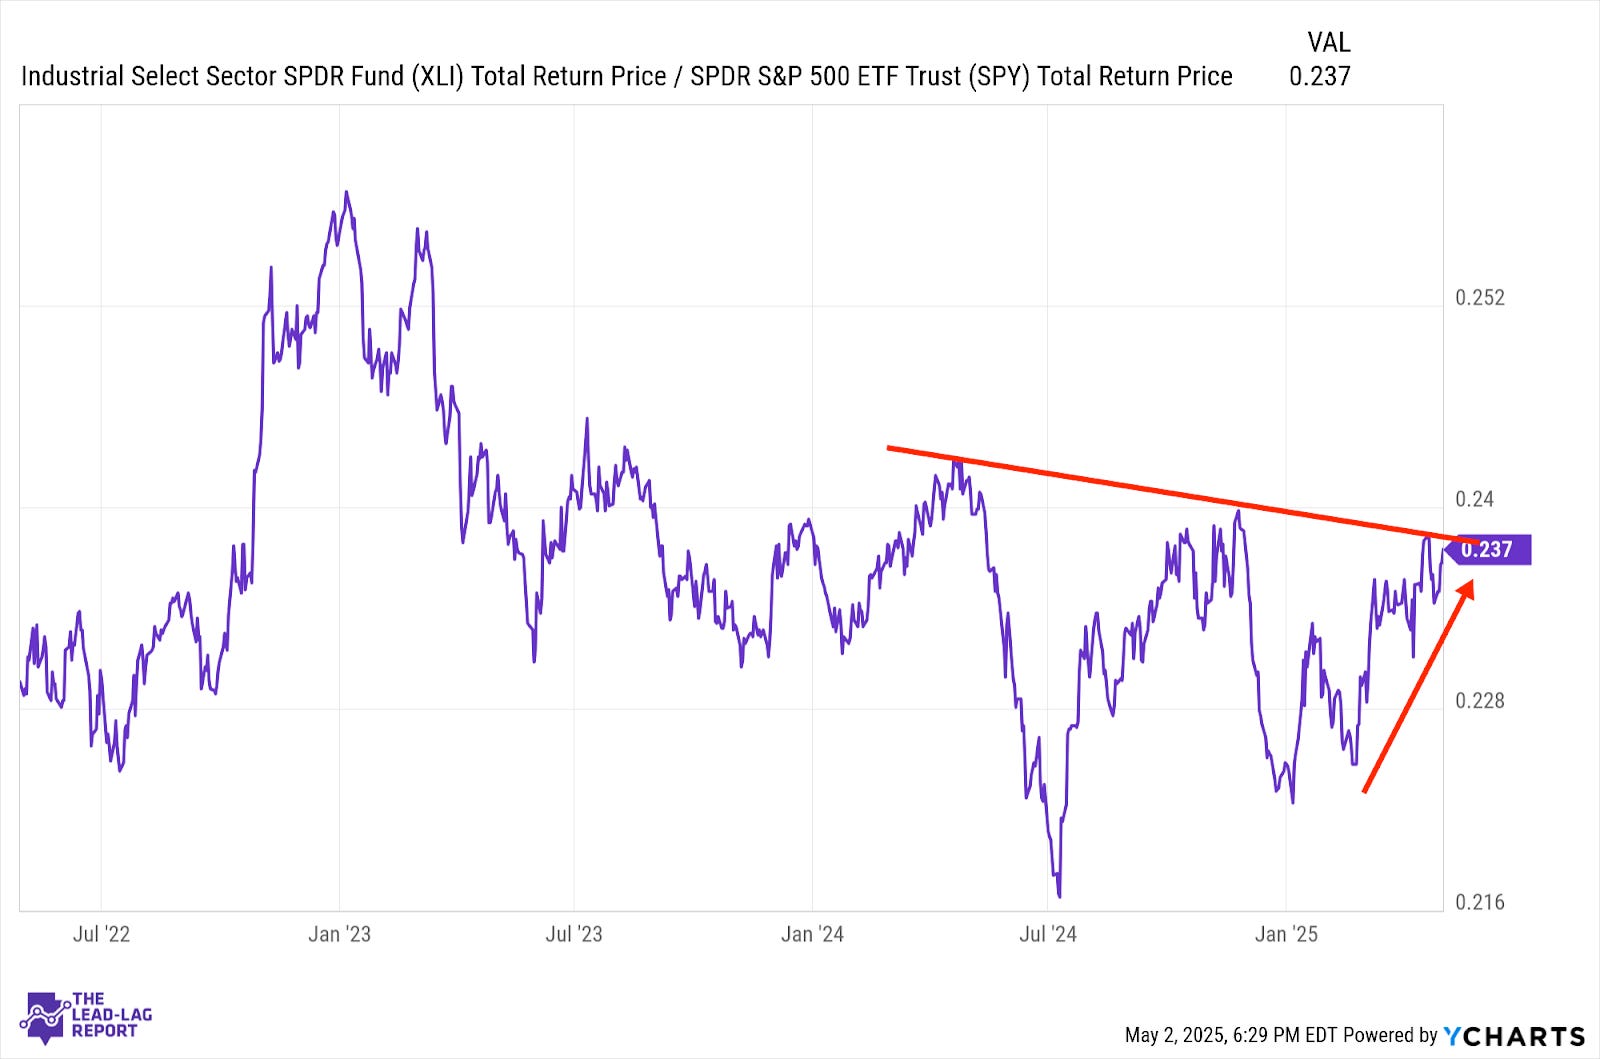
Short-term, industrials appear to be in a strong uptrend relative to the broader market. Longer-term, the downtrend might still be intact. Economic conditions would seem to support the latter. Q1’s GDP report should emphasize that slowing growth is a real problem both in the U.S. and globally. As long as there is the pressure of tariffs, there will be pressure on the cyclical demand for goods and services.
Financials (XLF) – Leadership Due To Multiple Factors
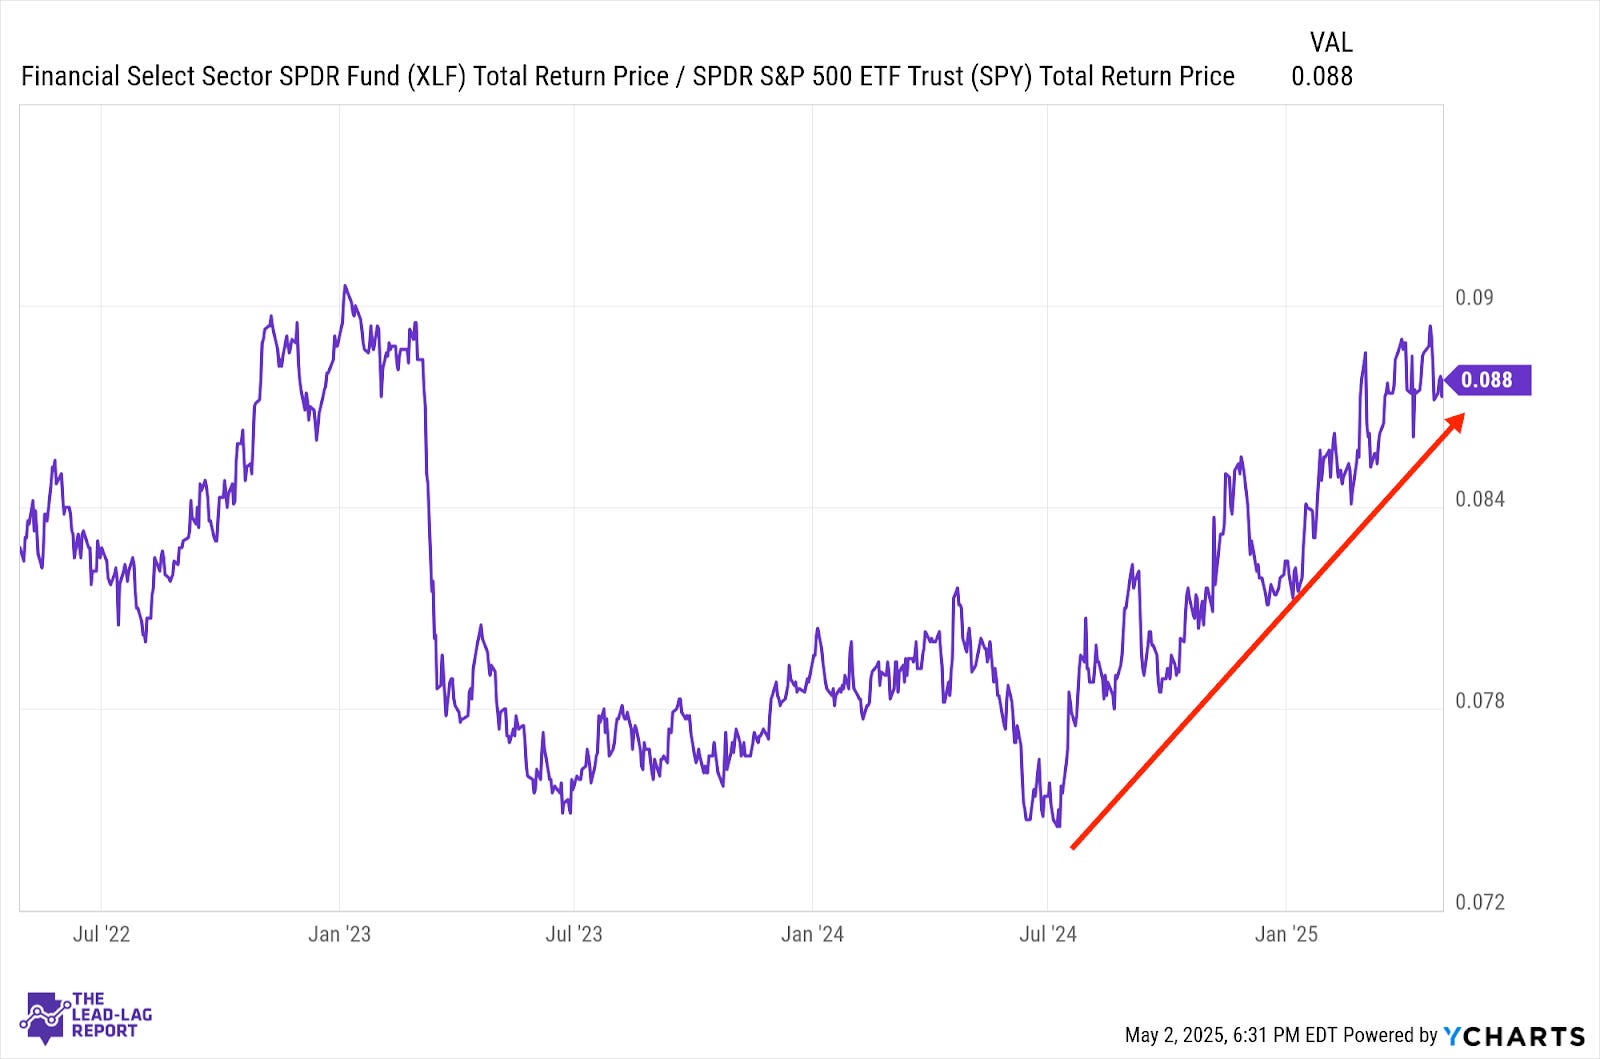
Financials remain one of the year’s best performing sectors for a few reasons. Higher interest rates have helped margins, while an improved M&A environment has added another tailwind. The possibility of deregulation later this year could also open up banking activity. The market’s pivot towards value over more expensive growth & tech stocks has also helped.
Materials (XLB) – Resilience
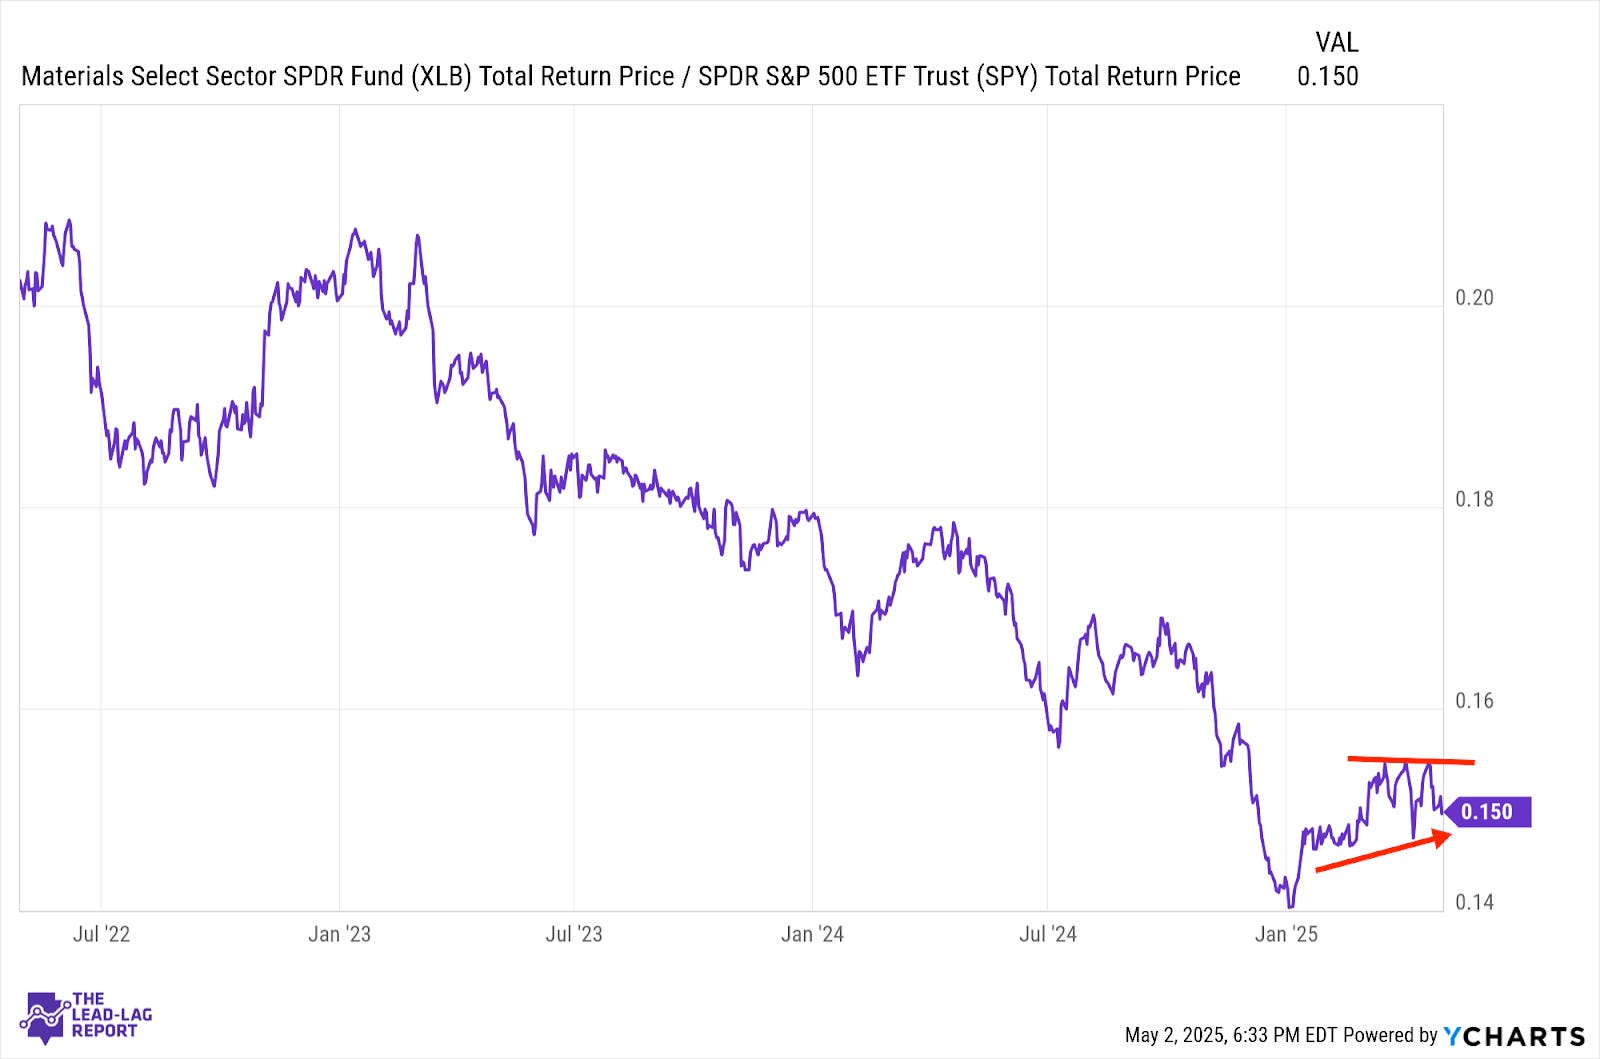
Commodities did what they often do and provided diversification benefits during the recent stock market drawdown. Materials stocks have been more mixed. While GDP growth turned negative in Q1, there’s still some evidence of resilience that has yet to break the labor market or consumer spending. A slowing manufacturing sector doesn’t help, but we may still not be to the point of imminent recession.
Utilities (XLU) – Signaling Another Downturn?
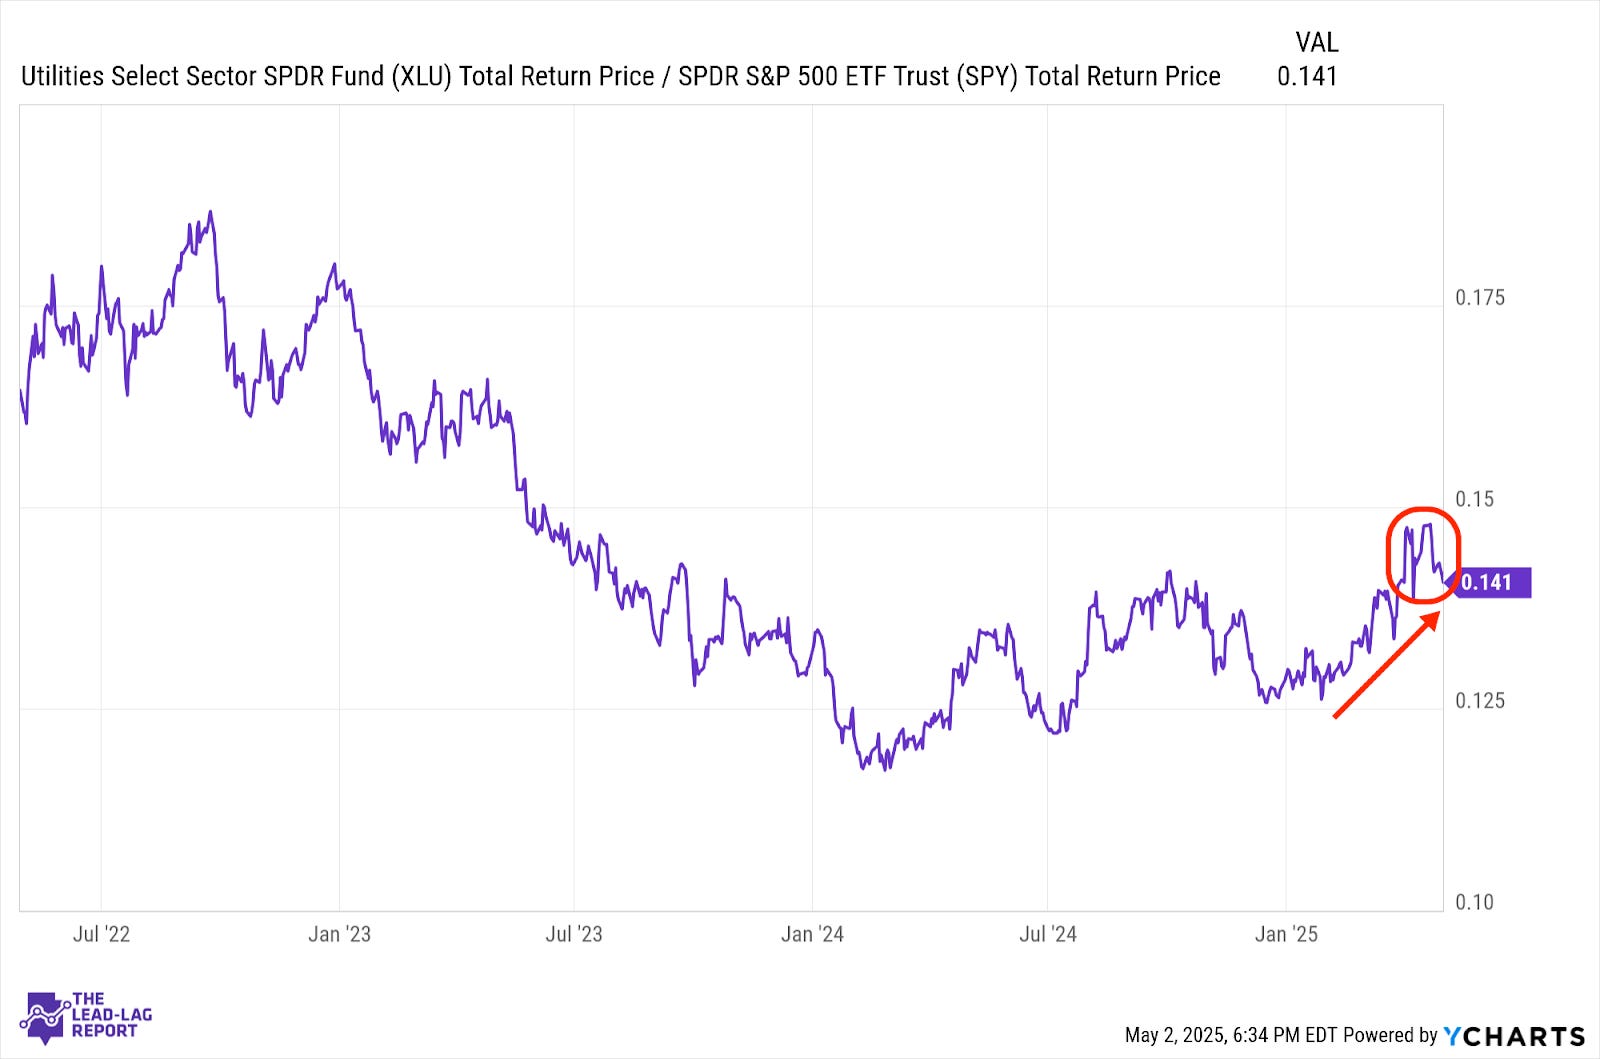
Utilities had been demonstrating steady leadership throughout 2025, but this ratio has quickly turned more volatile. Short-term sentiment has pivoted back towards risk-on, but the whipsaws suggest that we’re in more of a neutral, uncertain period than a pure risk-on one. Given how well this sector has acted as an indicator over the past couple years, utilities could be telling us that investors are getting sucked back in before another leg lower.
Real Estate (XLRE) – Tied To Treasury Yields
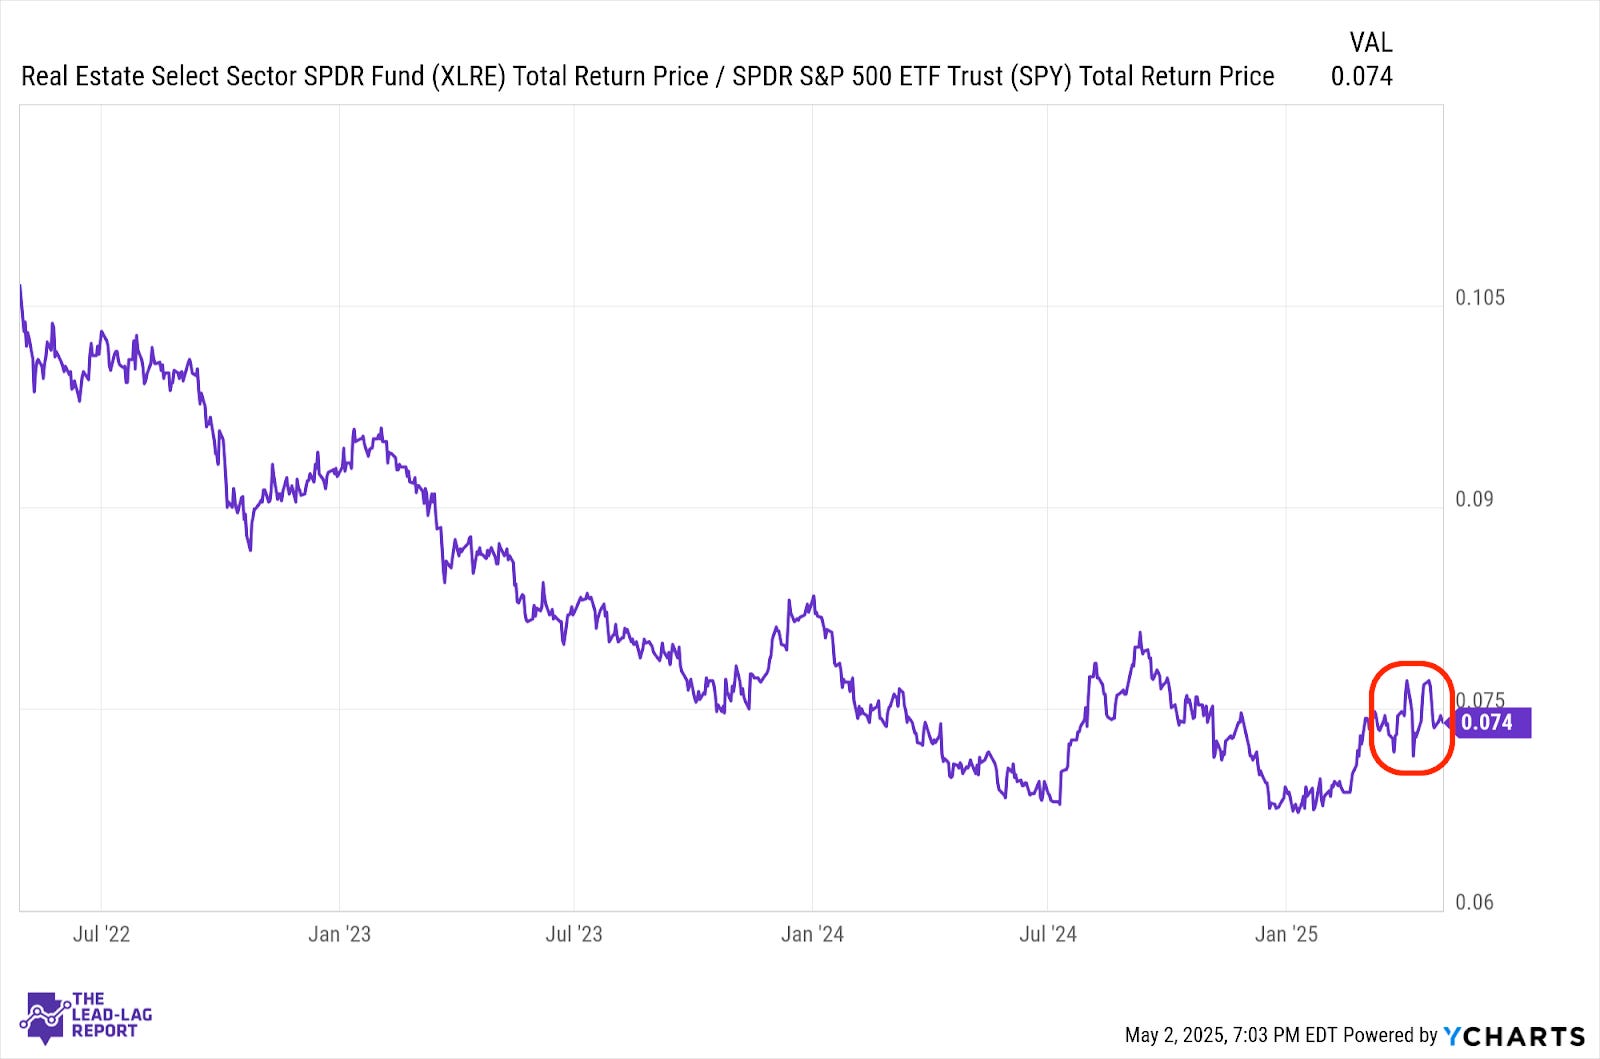
Real estate outperformance continues to tie heavily to volatility in long-term Treasury yields. Mortgage demand continues to weaken in light of high rates, but that still has yet to put a major dent in the housing market. As of now, however, real estate continues to behave as a risk-off asset more than anything.
Junk Debt (JNK) – Back To Underpricing Risk
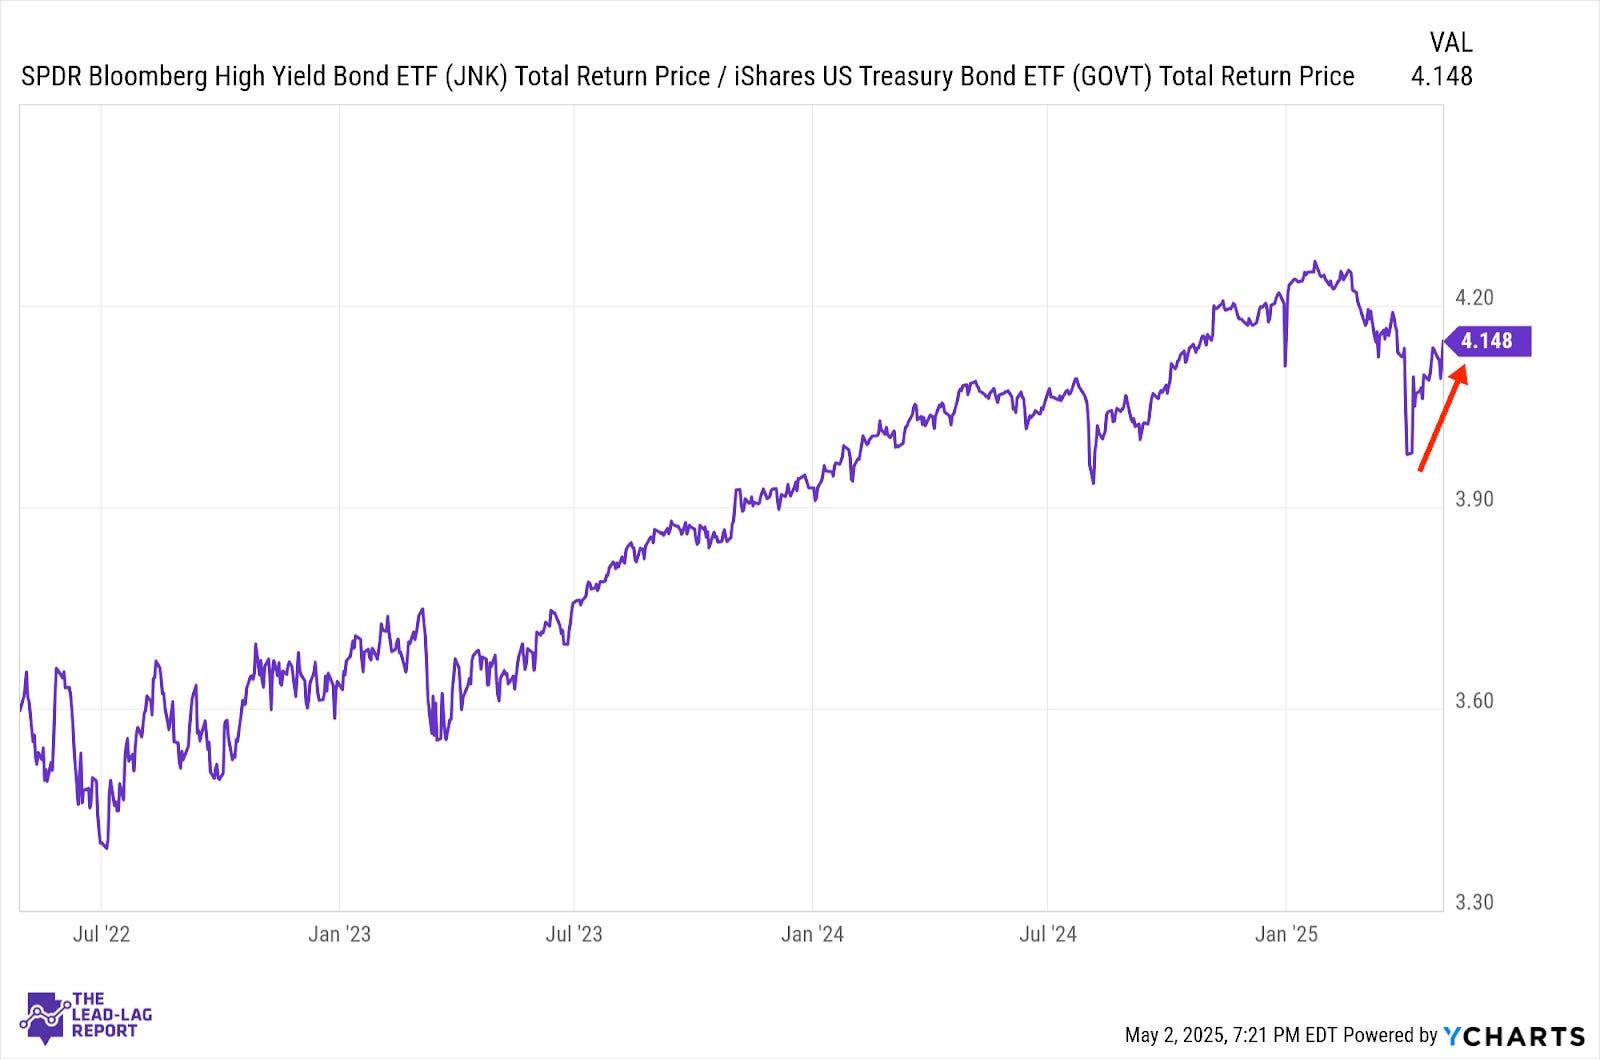
Junk bonds have resumed control of the bond market and investors suddenly seem less concerned with credit risk again. Even if trade war risk does become more mitigated here, high yield credit risk is still being underpriced relative to the entire macro picture. We know that companies are dialing back on spending and investment until there’s more clarity on tariffs, but overall credit risk still remains high relative to history.
Europe, Australasia, and the Far East (EFA) – Uptrend Not Over Yet
