The Contradiction: Cool CPI, Hot Oil, Korean Bear
A cool June CPI told the Fed to stand down the same week an Iran blockade, a Korean bear, and IBM's worst day ever said otherwise.

Today’s Lead-Lag Report post is sponsored by Rayliant
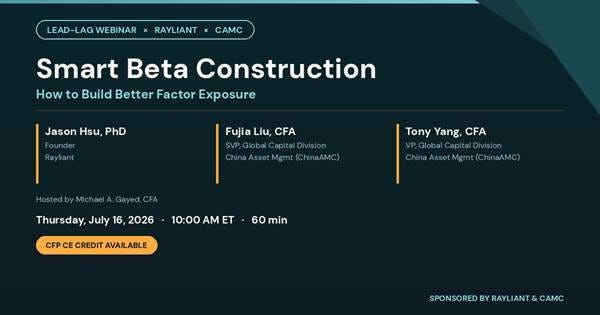
Join Me July 16: Smart Beta Construction with Jason Hsu (Rayliant), Fujia Liu & Tony Yang (ChinaAMC)
I’m excited to welcome you to my next Lead-Lag Webinar session, sponsored by Rayliant.
On Thursday, July 16 at 10:00am ET, I’ll sit down with Jason Hsu, PhD — Founder of Rayliant and one of the leading voices in systematic investing — together with Fujia Liu, CFA and Tony Yang of China Asset Management (ChinaAMC), for a practical conversation on smart beta construction and what it really takes to build better factor exposure.
Factor investing is often presented as a clean academic framework: identify a factor, build a portfolio, and harvest a premium. In reality, most of the outcome is driven by construction choices — what you define as the signal, how you neutralize unintended exposures, how you control turnover and trading costs, and how you think about regime dependence.
I’ll ask Jason about questions like:
● What does “better factor exposure” actually mean in practice?
● Where do smart beta strategies typically leak risk (and why)?
● How should investors think about factor cyclicality and crowded trades?
● What construction choices matter most: weighting, constraints, rebalancing, or implementation?
If you allocate to smart beta ETFs, manage multi-factor portfolios, or build rules-based strategies, this is the kind of conversation that can help you sharpen your framework and avoid common pitfalls.
This session is approved for CFP CE credit. If you attend live and want to claim it, I’ll email you after the session with the simple process — I submit your details directly to the CFP Board on your behalf.
Seats are limited — register here:
https://us06web.zoom.us/webinar/register/WN_qgl8xwwkTMyb3i6BS3myhQ
After you register, you’ll get your confirmation and a reminder before we go live. I hope you can join me.
— Michael A. Gayed, CFA
DISCLAIMER — PLEASE READ: This is sponsored advertising content for which Lead-Lag Publishing, LLC is being paid a fee. The information provided is solely the creation of Rayliant. Lead-Lag Publishing, LLC does not guarantee the accuracy or completeness of the information provided or make any representation as to its quality. All statements and expressions provided are the sole opinion of Rayliant and Lead-Lag Publishing, LLC expressly disclaims any responsibility for action taken in connection with the information provided.
The Contradiction: Cool CPI, Hot Oil, Korean Bear
Key Highlights
● Cool June CPI (+3.5% headline, +2.6% core) flipped the September FOMC from a coin-toss hike into an 86% hold — precisely the guidance the Warsh Fed refused to give, now handed to it by the tape.
● Oil did not fade: WTI settled +9.42% to $78.14 Monday and pushed near $80 Tuesday as a U.S. naval blockade of Iran took effect at 4pm ET, two days before Friday’s OFAC wind-down deadline.
● The market split in two — IBM’s worst day on record (-25%) against SK Hynix +27%, and a KOSPI now in bear territory after its 7th circuit breaker of 2026 — while the VIX sat at 17.16.
Let me lead with the contradiction, because this was a week that refused to resolve into a single story. Seven days ago the thesis here was that a Warsh Fed which declined to guide had left a bifurcated market — cool disinflation on one side, a Hormuz supply shock on the other — to price both risks at once. That premise is now half-resolved and half-detonated. The disinflation side won the argument at the front end: June CPI came in cool, and rate markets took it as permission to stand the Fed down. The supply-shock side, which last week’s iMessage traffic insisted had faded overnight, did no such thing — oil extended its gains into a formal Iran blockade. And in the middle sat the most violent single-stock dispersion event in years. The market did not choose. It split.
Start with the tape that matters most for the rate path. June CPI, released Tuesday morning, printed a headline of +3.5% year-over-year and core of +2.6%, both cooler than a consensus that had been drifting toward the high-3s (CBS News; Reuters via KELO). The market’s read was immediate and one-directional: CME FedWatch swung to roughly an 86% probability of a September hold, up sharply from near 60% before the print (CBS News). This is the punchline of the whole Warsh-regime saga. A Fed chair who built his brand on refusing to pre-commit just had the pre-commitment made for him — not by a dot plot he distrusts, but by a single benign inflation number that convinced the market the hike is off the table. The premise of last week’s edition, that the Fed’s silence forced the bond market to do its work, is now moot: the data did the work instead.
The banks, reporting the same morning, quietly reinforced the higher-for-longer floor beneath all of this. JPMorgan, Wells Fargo, Bank of America, Citigroup, and Goldman Sachs all beat on EPS — the sector’s eighth consecutive quarter of beats (IG.com). JPMorgan posted $6.14 against $5.85 expected with equities-trading revenue up 86%, and Goldman turned in a record quarter at $20.98 diluted (AP via Audacy; IG.com). Nothing here signals credit stress; resilient banks give the Fed less urgency to cut. Stitch the two Tuesday morning threads together and you get the market’s clean, and I think dangerously tidy, synthesis: banks make money, cool CPI means the Fed doesn’t need to hike, the curve stays flat, and the money rotates hard within tech. Which brings us to the third act — the one that actually moved portfolios (chart 1).
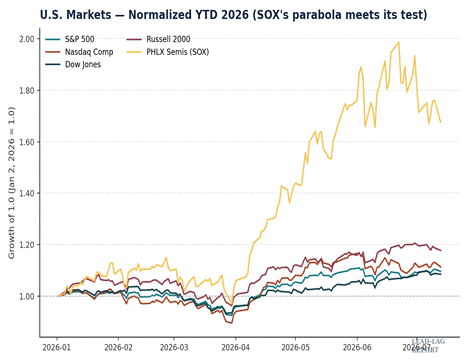
Chart 1 — U.S. markets, indexed to January 2, 2026. The SOX’s parabola meets its first real test.
IBM had the worst single day in its history on Tuesday, falling roughly 25% after a CEO letter flagged capital expenditure shifting toward memory and servers ahead of a coming wave of price increases — a signal the market read as a tectonic reallocation of AI spend. What followed was pure dispersion: SK Hynix ripped about 27% (Chosun), Dell rose around 7% (The Globe and Mail), Sandisk gained roughly 5% (Benzinga), and cybersecurity broadly traded higher on the same tape, while the software complex — IBM (Reuters/Forbes), Adobe, ServiceNow, Oracle — was crushed. This is not risk-off; it is a wholesale repricing of who captures the next dollar of AI capex. Memory and hardware win, application software loses. It is worth sitting with how strange the composite picture is: the SOX had run parabolic into July, up more than 80% for the year at the Q2 close, yet Monday’s session had already been a semiconductor-led decline masquerading as an oil scare, with SK Hynix down about 15% in Seoul the day before it reversed violently higher (WSJ live coverage). The divergence between the memory complex and the software complex is now the single most important intra-equity story in the market, and the VIX — sitting at 17.16 as of the Jul 13 close (verified via YCharts) — is telling you the index level barely noticed a rotation this large happening beneath it.
Across the Pacific, the read-through ran through Japan and Europe rather than around them (chart 2). The Nikkei 225 closed Tuesday around 67,243, off about 1.9%, as the Korean semiconductor shock spilled into Tokyo and a yen pinned near 40-year lows failed to cushion exporters (Japan Market Report, Jul 14). That is a notable pullback from the 70,062 Q2 close and from June’s brush with 70,000 intraday. The dollar side of the story is quieter but structurally supportive: USD/JPY held at 162.44 Tuesday, essentially unchanged and still shy of the 164-165 intervention zone desks are watching, while the DXY held firmly above 101 (Twelve Data; Investing.com).
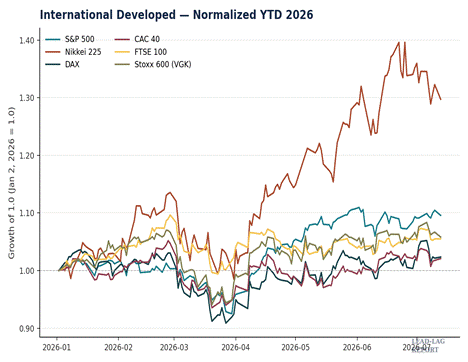
Chart 2 — International developed markets vs. the S&P 500, indexed to January 2, 2026.
Europe told the same muted-defensive story. The Stoxx Europe 600 traded near 641, below its July 3 record of 652.77, with the DAX slipping toward 24,950-24,975 intraday and the CAC 40 closing at 8,292.93, down 0.86% (Stoxx official; Boursorama). The ECB, having hiked in June, is deliberately holding — Lagarde told Les Echos it “made the right choice” and cannot yet call a peak (Bloomberg, Jul 2). The net read-through for the dollar is that a hawkish-leaning global backdrop — BoJ still hiking, ECB done-but-not-declaring-victory, a BoE talking tough into its Jul 30 decision — leaves the greenback bid even as U.S. hike odds collapse, because everyone else’s central bank is closer to the end of its road than the market thinks the Fed is.
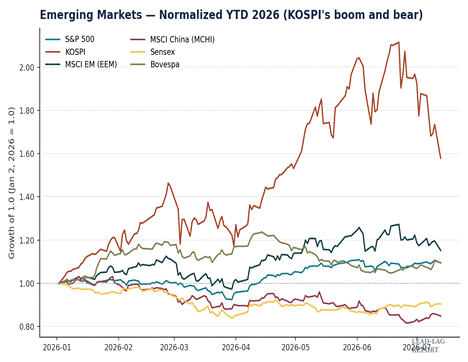
The emerging-market panel is where the bifurcation turns genuinely ugly (chart 3). KOSPI, the single best-performing major index of 2026, triggered its seventh circuit breaker of the year Monday, plunging 8.95% to close at 6,806.93 — its first close below 7,000 since May — then extended lower Tuesday to 6,662.93 (Dong-A Ilbo, Jul 14; Trading Economics, Jul 14). The index is now roughly 20% below its June record and formally in bear-market territory, even as it clings to a gain north of 67% year-to-date (CNBC, Jul 9). Barron’s picked up the “KOSPI problem” framing Tuesday, and for good reason: Samsung and SK Hynix alone are more than half the index’s weight, a concentration with no U.S. parallel (CSIS, Jun 30). This is a capital-flight signal wearing a still-positive YTD number, and the fact that SK Hynix could crater 15% in Seoul on Monday and rip 27% globally on Tuesday’s memory pivot tells you the Korean tape is now a pure derivative of the AI-hardware trade.
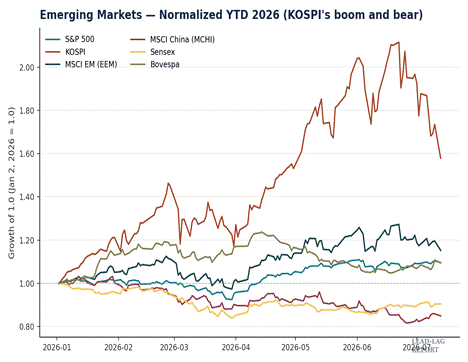
Chart 3 — Emerging markets vs. the S&P 500, indexed to January 2, 2026. KOSPI’s boom and bear.
The rest of the EM complex bent without breaking. India’s Sensex fell 0.72% to 77,054.94 as the oil-import bill reasserted itself and the rupee slid toward the mid-95s (Business Standard, Jul 14). MSCI EM had given back roughly six points of YTD gain to around +20% since the quarter close, yet the JPMorgan EMBI Global Diversified spread sat near 235bp and Argentina’s country risk hit its tightest since 2018 (SSGA Q2 commentary). EM credit is reading the oil shock as a duration and inflation story, not a solvency crisis — which is exactly right, and exactly why the equity pain is concentrated where the AI leverage is, not where the current-account leverage is.
Which leaves the shock itself, the one the market keeps insisting will fade (chart 4). It did not. Front-month NYMEX WTI settled Monday up 9.42% to $78.14 and pushed toward $80 Tuesday, its highest in a month, as a U.S. naval blockade of the Iranian coast took formal effect at 4pm ET; Brent settled $83.30 Monday and traded near $85 (GMA/Reuters; Morningstar Data Talk; Straits Times). This is Hormuz Day 137, and Friday brings the OFAC wind-down deadline for the revoked Iranian-oil license — a hard date sitting two sessions past a soothing CPI print.
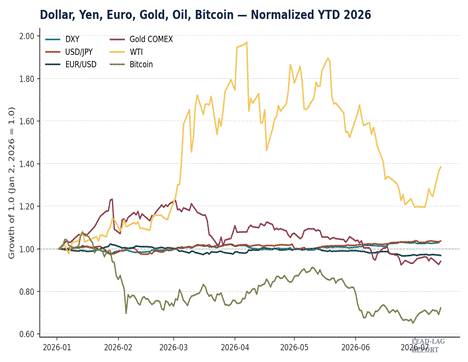
Chart 4 — Dollar, yen, euro, gold, oil, and bitcoin, indexed to January 2, 2026.
The tell is in gold. On any historical script, an oil-driven war premium plus a hard geopolitical deadline sends gold ripping. Instead COMEX gold settled down 2.61% Monday to around $3,997 and managed only a shallow bounce to roughly $4,015-4,025 Tuesday (Morningstar Data Talk; Trading Economics). Gold is trading as a rate-and-dollar asset, not a safe haven — the decoupling thesis first flagged here in mid-June, now hardened. Higher oil lifts inflation expectations, which firm the dollar, which pressures gold, inverting the metal’s entire crisis playbook (FX Leaders, Jul 14). Bitcoin, for its part, barely moved — rangebound near $62,700 as it trades on its own ETF-flow dynamics rather than as any kind of hedge (Twelve Data). When the two assets everyone reaches for in a crisis — gold and bitcoin — both shrug at a naval blockade, the market is telling you it does not believe the war premium is durable. In my view that is the market trading on borrowed time: it has priced the CPI relief as permanent and the oil shock as transient, and Friday’s deadline is where those two assumptions collide.
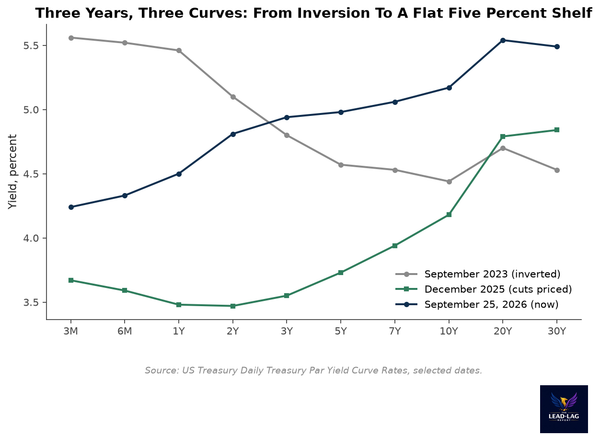
What I’m watching next week. First, the Jul 17 OFAC wind-down — does WTI hold near $80 or mean-revert toward the $60 that traders say a reopening would trigger, and does the July CPI (out mid-August) start absorbing an oil premium this June print was too early to see. Second, the durability of the memory-over-software AI divide: is IBM’s worst day a one-session capex scare or the start of a genuine leadership rotation within tech, and does the SOX resume its trend or confirm a top. Third, whether the Korean bear stays contained to a concentrated index or becomes the canary for the entire AI-hardware complex. And underneath all of it, the flattest question of all: with 2s10s at 36bp, the curve is pricing neither a hike nor a recession. One of those complacencies breaks first.
The Lead-Lag Report is provided by Lead-Lag Publishing, LLC. All opinions and views mentioned in this report constitute our judgments as of the date of writing and are subject to change at any time. Information within this material is not intended to be used as a primary basis for investment decisions and should also not be construed as advice meeting the particular investment needs of any individual investor. Trading signals produced by the Lead-Lag Report are independent of other services provided by Lead-Lag Publishing, LLC or its affiliates, and positioning of accounts under their management may differ. Please remember that investing involves risk, including loss of principal, and past performance may not be indicative of future results. Lead-Lag Publishing, LLC, its members, officers, directors and employees expressly disclaim all liability in respect to actions taken based on any or all of the information on this writing.