
The Credit-Equity Divergence: What 285 Basis Points Is Telling You That 7,000 Isn't
The S&P 500 just crossed a round number. Corporate credit already told you how this ends. Stop watching the wrong market.

KEY HIGHLIGHTS
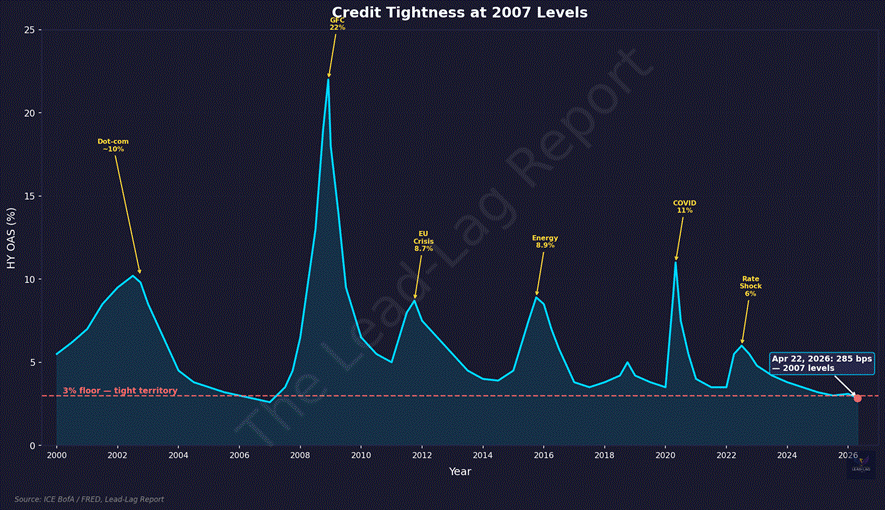
• The ICE BofA US High Yield Master II option-adjusted spread closed at 285 basis points on April 21, 2026 — levels last seen at the June 2007 cycle low, seven months before the Great Financial Crisis began.[1]
• Investment-grade spreads touched 71 bps in late January — the tightest reading since 1998, the year of LTCM. They currently sit at 79 bps.[2]
• The S&P 500 crossed 7,000 for the first time in history on April 15, closing the week at 7,126.06 after a 13-session winning streak.[3] Beneath that headline, HY spreads had already widened 74 basis points in the weeks prior.[4]
• My Lumber/Gold signal flipped to Risk-Off on April 21 as gold’s 13-week return (+3.59%) overwhelmed lumber’s (-4.59%). Every one of my seven sub-strategies rotated defensive.[5]
• The FOMC meets April 28–29. Markets price a 99% probability of a hold at 3.50–3.75%. The Fed is trapped: it cannot cut into record equity prices, and it cannot hike into widening credit.[6]
The Number Nobody Is Talking About
Seven thousand. That is the number everyone saw. The S&P 500 closed above 7,000 for the first time in its history on April 15, 2026, and by April 17 it stood at 7,126.06. Thirteen straight green sessions. The Nasdaq’s longest winning streak since 1992. Headlines wrote themselves. Fund flows followed.[3]
Here is the number nobody is talking about. On the same week the S&P made history, the ICE BofA US High Yield Master II option-adjusted spread was 285 basis points.[1] That is where junk bonds were trading in June 2007. Seven months before the recession began. Fourteen months before Lehman.
When credit spreads are this tight, there are only three historical precedents worth studying. 1998. 2007. Late 2021. One LTCM. One Global Financial Crisis. One twenty-two percent bear market. Three out of three ended in repricing. Different triggers. Same ending.
And yet the retail narrative this week is ceasefire euphoria and the return of mega-cap tech. That is not analysis. That is tape-chasing.
Credit Already Cracked. The Tape Just Hasn’t Caught Up.
Here is what the record-high headlines are hiding. Between March 20 and March 31, 2026, HY OAS blew out from roughly 3.05% to 3.61%. That is a 56 basis point widening in eight trading days.[7] CCC spreads moved from 9.13% to 10.20% in the same stretch, then blew through 10.5%.[8] Investment-grade spreads touched 85 basis points. This was not noise. This was the bond market repricing Iran risk, tariff escalation risk, and the stagflation risk the equity market refused to price.
Then came the ceasefire. Oil collapsed. Spreads roundtripped. By April 21, HY OAS was back to 2.85%, CCC at 9.13%, IG at 79 basis points. The equity market read the compression as an all-clear. That is exactly backwards. What actually happened is that the bond market showed you, in real time, what stress looks like in a compressed-spread environment. It moves first. It moves fast. And when you are starting from 285 basis points, the next 200 basis points of widening do not require a recession. They require a mood change.
