
The Curve Just Un-Inverted. History Says That's When Things Break.
Credit spreads at 2007 lows, VIX collapsing, CPI re-accelerating, and a Fed splitting 8-4 for the first time since 1992. The all-clear isn't an all-clear.

KEY HIGHLIGHTS
• The 10Y-2Y curve sits at +0.47% after the longest inversion since 1929. Every major un-inversion since 1980 was followed by recession within 5 to 18 months.
• Investment-grade credit spreads hit 71 basis points in January 2026, the tightest level since 1998. High-yield OAS sits in the 16th historical percentile.
• April CPI re-accelerated to 3.81% year-over-year, the highest since May 2023, with energy contributing 40% of the monthly increase.
• The Fed held rates at 3.50-3.75% on April 29 via an 8-4 vote. The last time four members dissented was October 1992.
• The VIX collapsed from 31 in late March to 18 in early May. Sub-19 readings into reaccelerating inflation have preceded every major drawdown of the past three decades.
The Un-Inversion Nobody Wants to Talk About
The 2-year and 10-year Treasury yield curve un-inverted in late 2024 after spending more than 700 trading days underwater¹. That was the longest inversion since 1929. As of May 14, 2026, the spread sits at positive 47 basis points, well below the long-term average of 85 basis points but firmly in normalized territory².
Wall Street has turned this into a victory lap. The curve normalized without a recession. The soft landing is real. Risk-on, full throttle. The S&P 500 traded at 7,399 on May 11, almost 10% above its 200-day moving average, with technology leading the charge³.
But here is what they are not telling you. The curve has never been a recession signal at the moment of inversion. It has always been the signal at the moment of normalization. The inversion is the diagnostic. The un-inversion is the trigger.
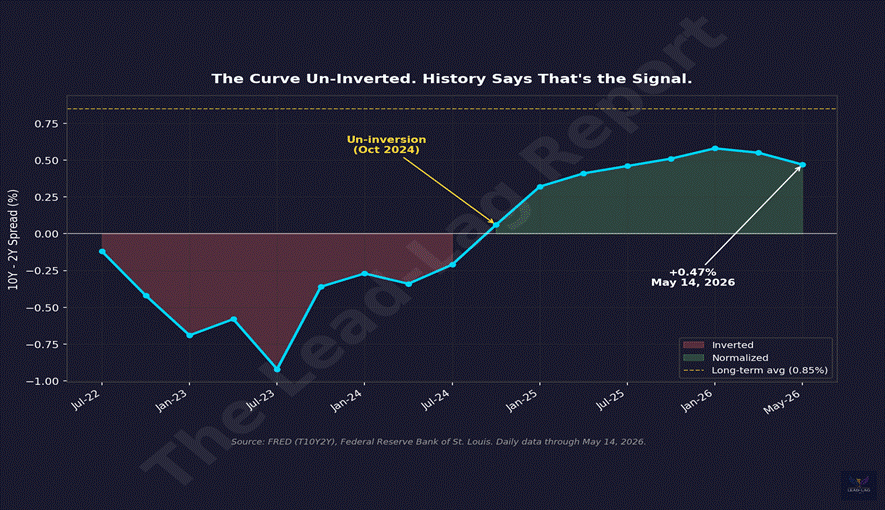
Pull the historical record. May 2007: the curve normalized, 18 months later Lehman fell⁴. November 2000: normalized 3 months before the recession started. October 1989: normalized 12 months before the 1990 recession. October 2019: normalized 5 months before COVID hit, though the underlying credit fragility was already in place. The FRED Blog notes the average lag from un-inversion to recession sits at 13 months, with a range of 8 to 19 months⁵.
Late 2024 plus 13 months puts us in early 2026. We are inside the window right now. And nobody is positioned for it.
Credit Spreads at 1998 Lows. With Inflation Coming Back.
If the curve is the recession diagnostic, credit spreads are the early warning system. And the warning system is broken.
Investment-grade option-adjusted spreads briefly touched 71 basis points in late January 2026, the tightest level since 1998⁶. They have since drifted to 77 basis points, still in the 6th historical percentile. The long-term median sits at roughly 140 basis points. BBB spreads, the lowest rung of investment grade, trade at 98 basis points against a median of 175. High-yield OAS sits at 282 basis points, the 16th percentile, levels last seen in 2007⁷.
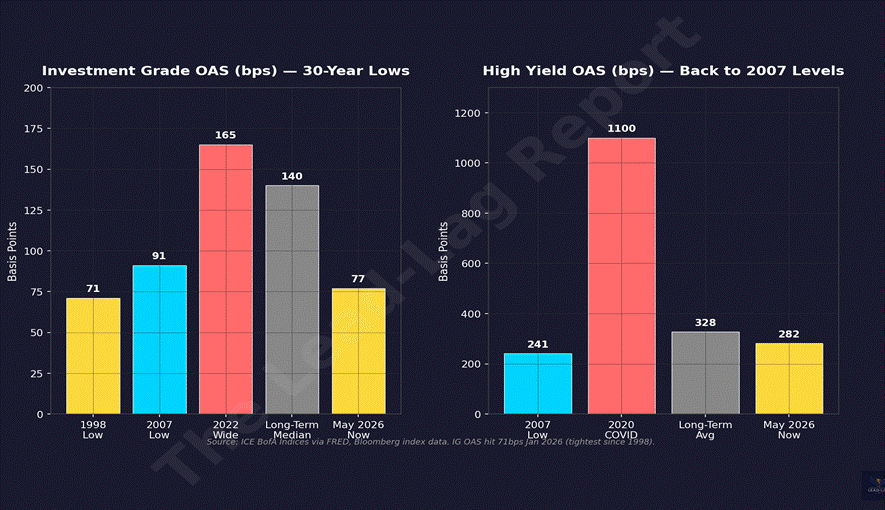
PIMCO put it plainly: spreads near 25-year tights “leave little risk premium to absorb shocks”⁸. The January 2026 FOMC minutes flagged the same concern, warning of “high asset valuations and historically low credit spreads” that could amplify downside if conditions reversed⁹.
Meanwhile, inflation is not behaving. April CPI printed 3.81% year-over-year, the highest reading since May 2023, up from 3.26% in March¹⁰. Core CPI accelerated to 2.78% from 2.60%. Energy prices were the lead culprit, up 17.87% year-over-year, contributing roughly 40% of the monthly increase¹¹. The 21-percentage-point energy swing from April 2025 is not a base effect. It is a regime change.
Tight credit spreads make sense when inflation is contained and the Fed is cutting. Tight credit spreads with re-accelerating inflation and a Fed that cannot cut are a mispricing. Mispricings get corrected violently when the catalyst arrives.
