

Below is an assessment of the performance of some of the most important sectors and asset classes relative to each other with an interpretation of what underlying market dynamics may be signaling about the future direction of risk-taking by investors. The below charts are all price ratios which show the underlying trend of the numerator relative to the denominator. A rising price ratio means the numerator is outperforming (up more/down less) the denominator. A falling price ratio means underperformance.
LEADERS: TRUMP’S BIG BEAUTIFUL BILL COULD IGNITE A LIQUIDITY-FUELED RALLY
Technology (XLK) – The Tax Bill Tailwind
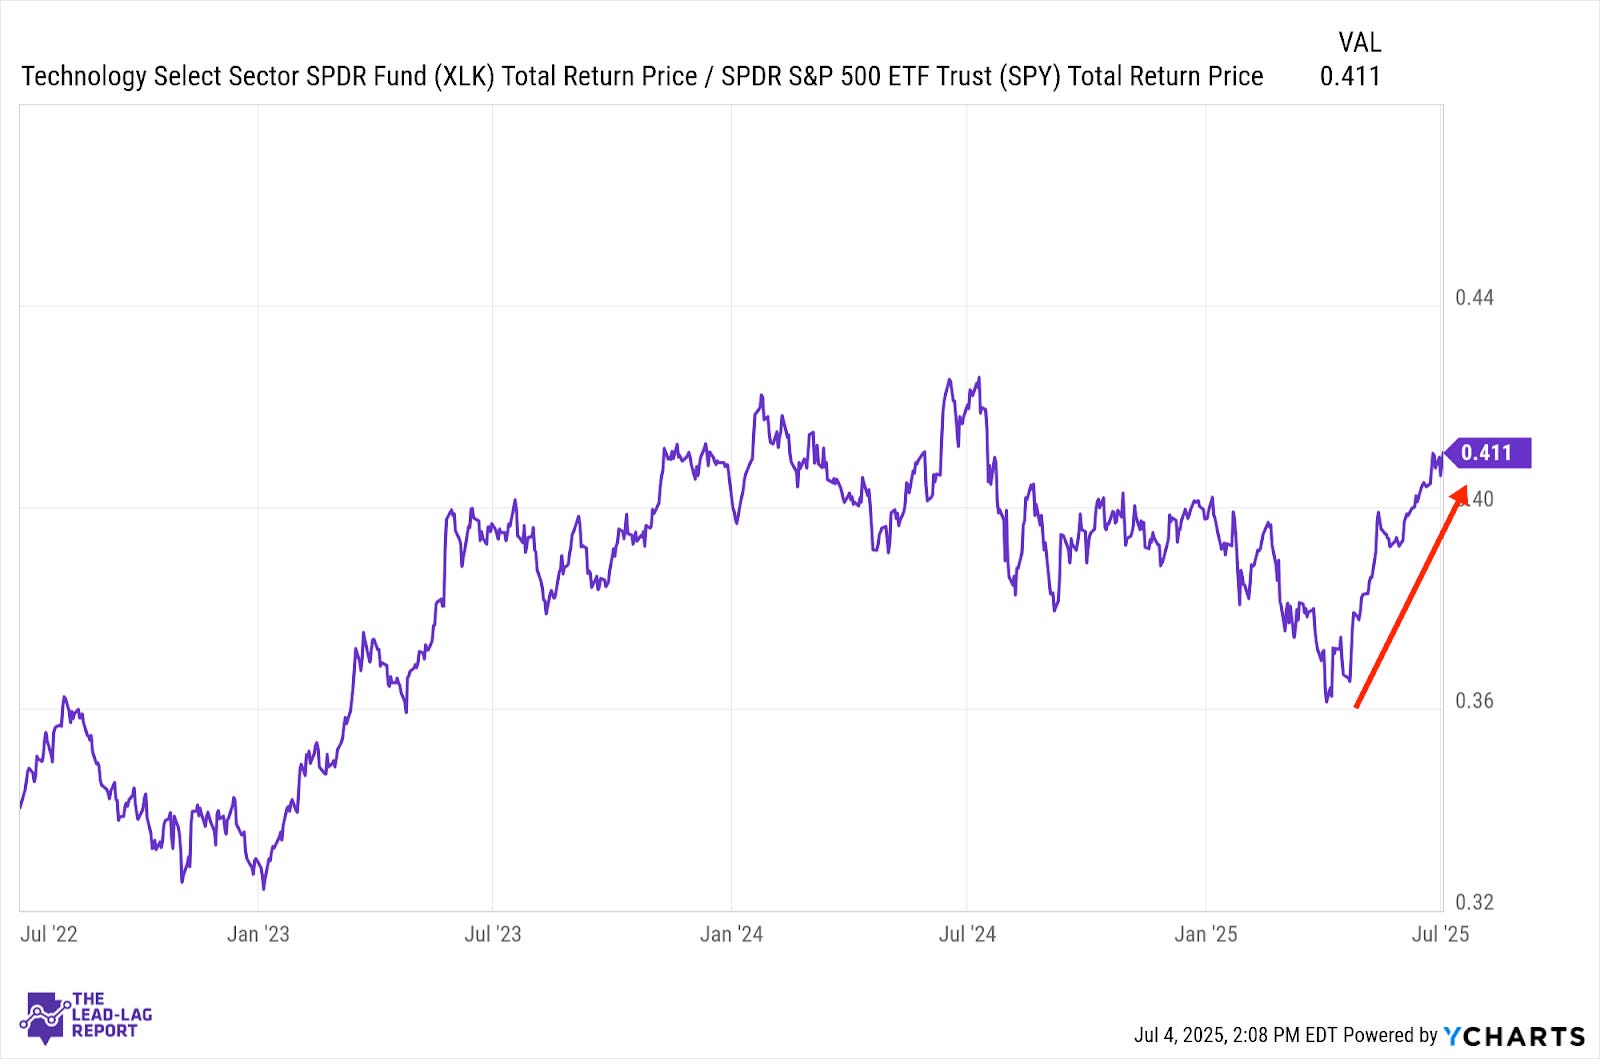
The tech rally has shown little indication that it’s ready to slow down. It may have even less reason now. Setting aside some of the concerns that come with it, Trump’s tax bill has the potential to be a huge liquidity injection into the economy. While it raises questions about debt and inflation risk, there’s little argument that adding liquidity to the system often tends to be bullish for equities.
Communication Services (XLC) – Getting Sucked Back In
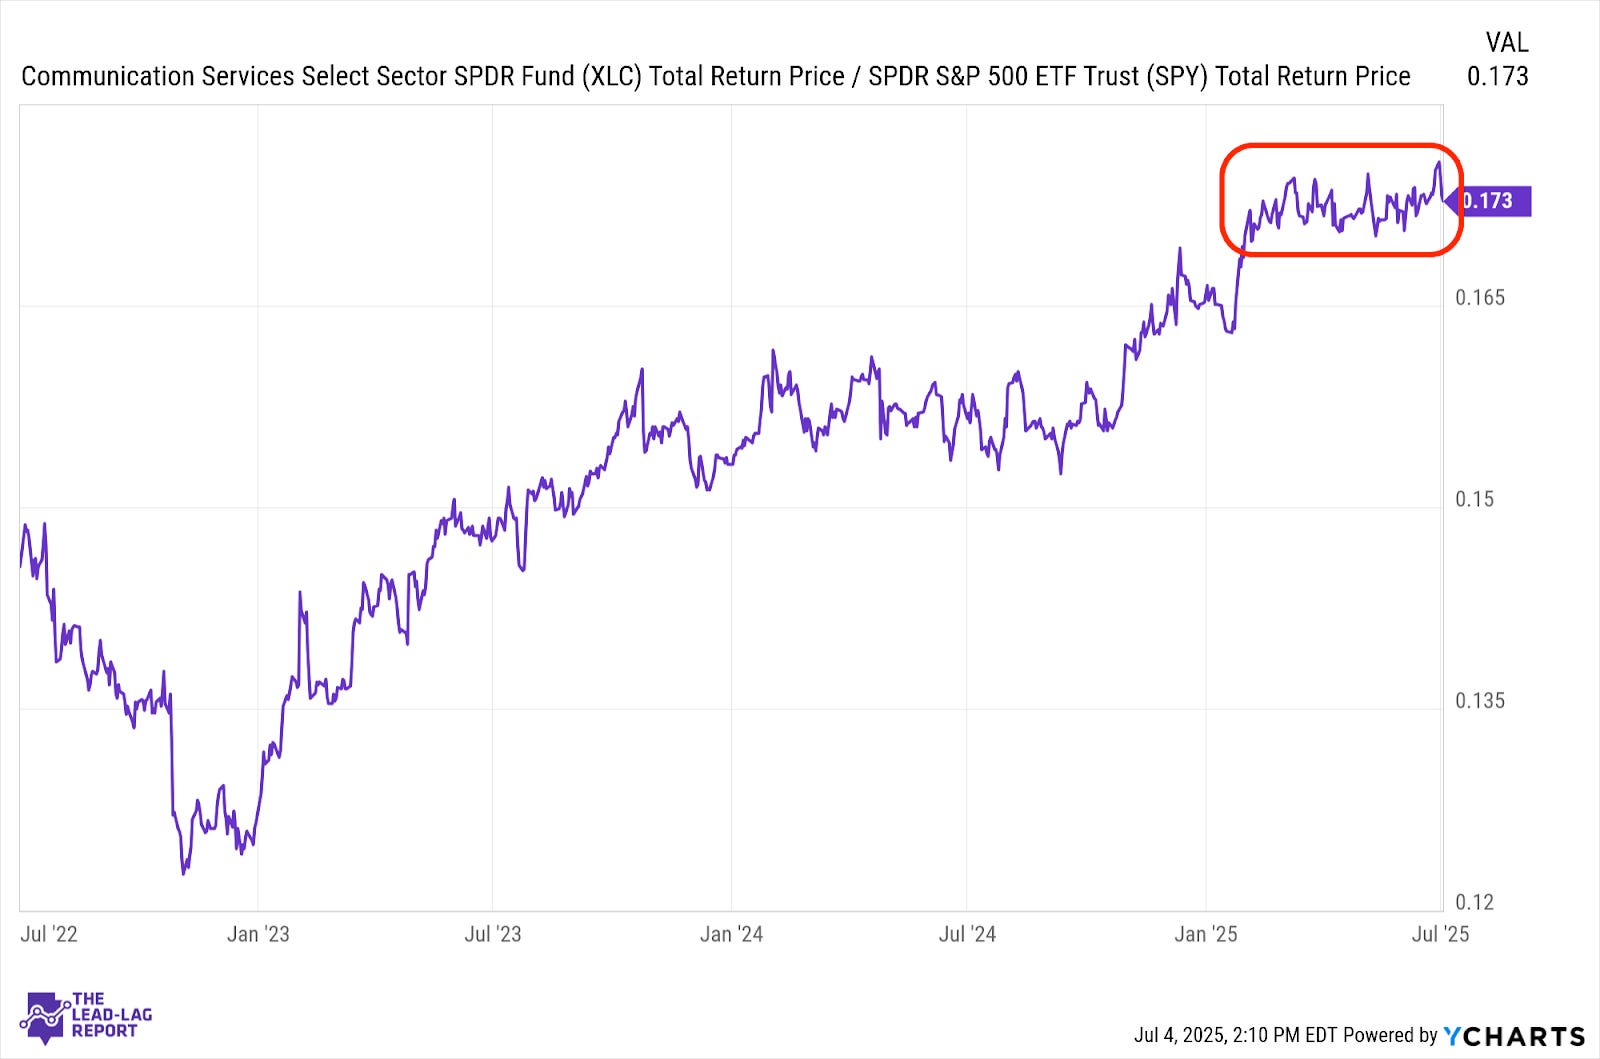
This sector was actually the worst performer last week, getting pulled lower from some of the more conservative components of the portfolio. It’s a bit disappointing to see because the sector looked like it was finally building a little momentum and could have been ready to break out. Now, the chart looks like it’s getting pulled back into the sideways pattern it’s experienced for most of 2025.
Financials (XLF) – Deregulatory Tailwinds Pick Up
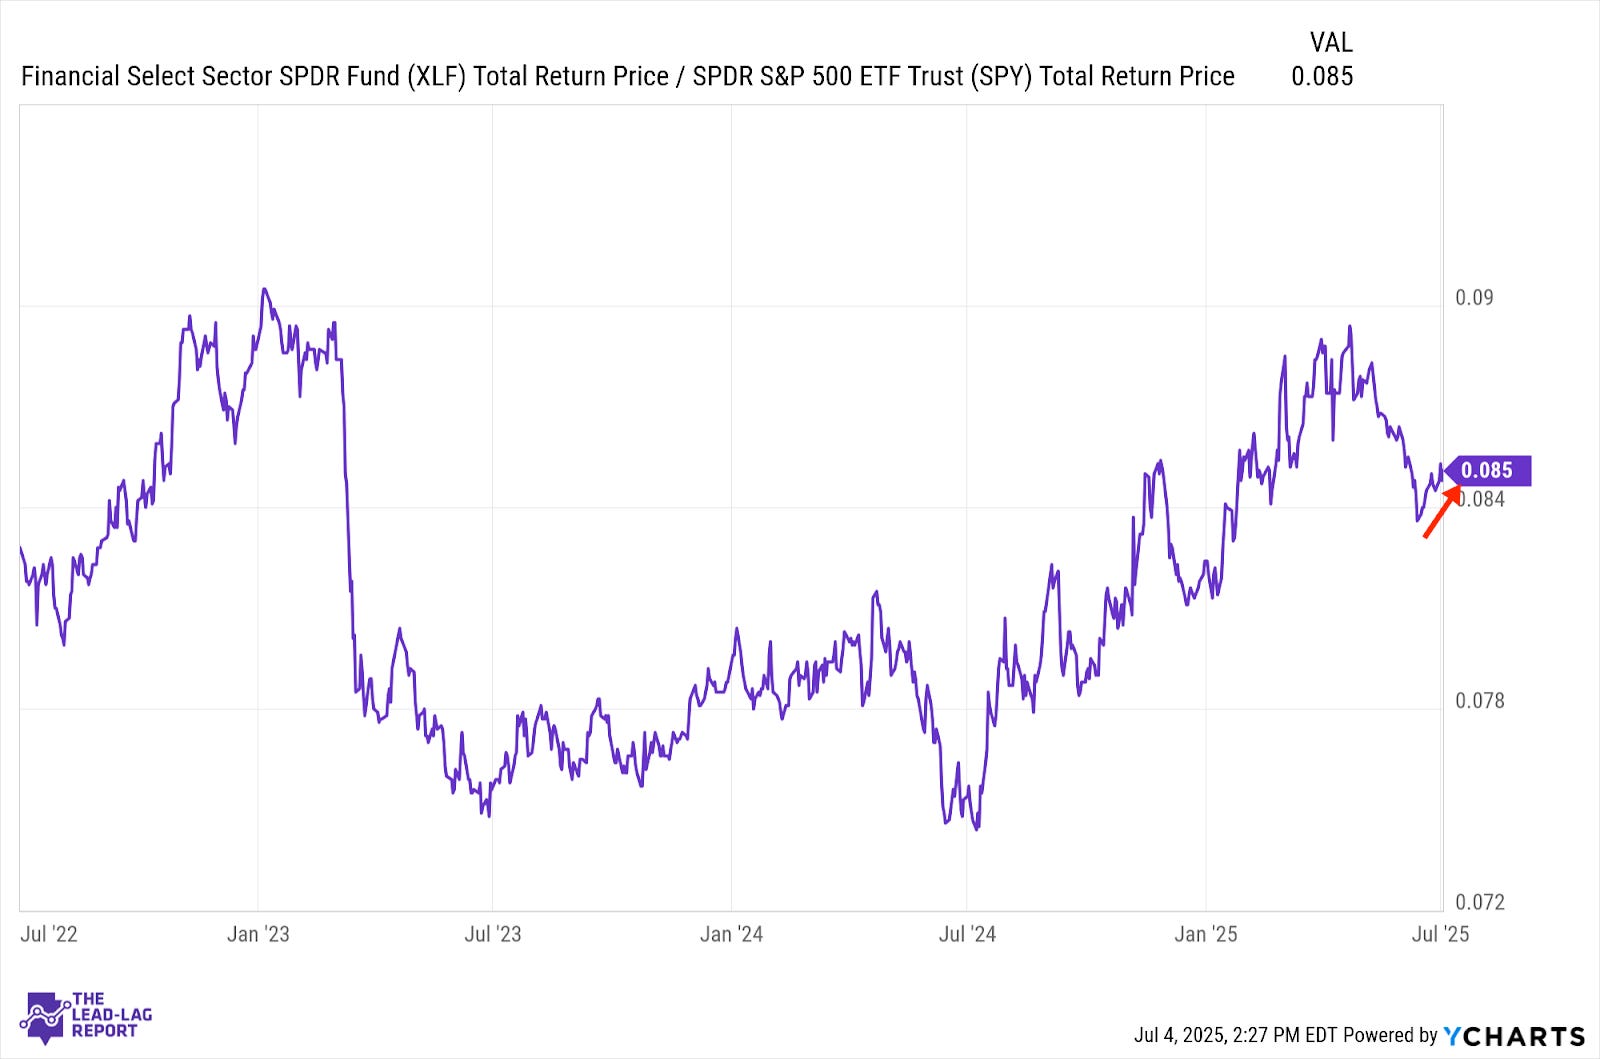
Conditions may really start to improve soon for banks. All of the major financial institutions passed the latest round of stress tests, which were less stringent than before. Capital requirements look like they’re about to start easing. Falling interest rates aren’t likely to help any, but there’s a clear deregulatory tailwind that’s already developing here.
Materials (XLB) – Solid Risk/Reward Play
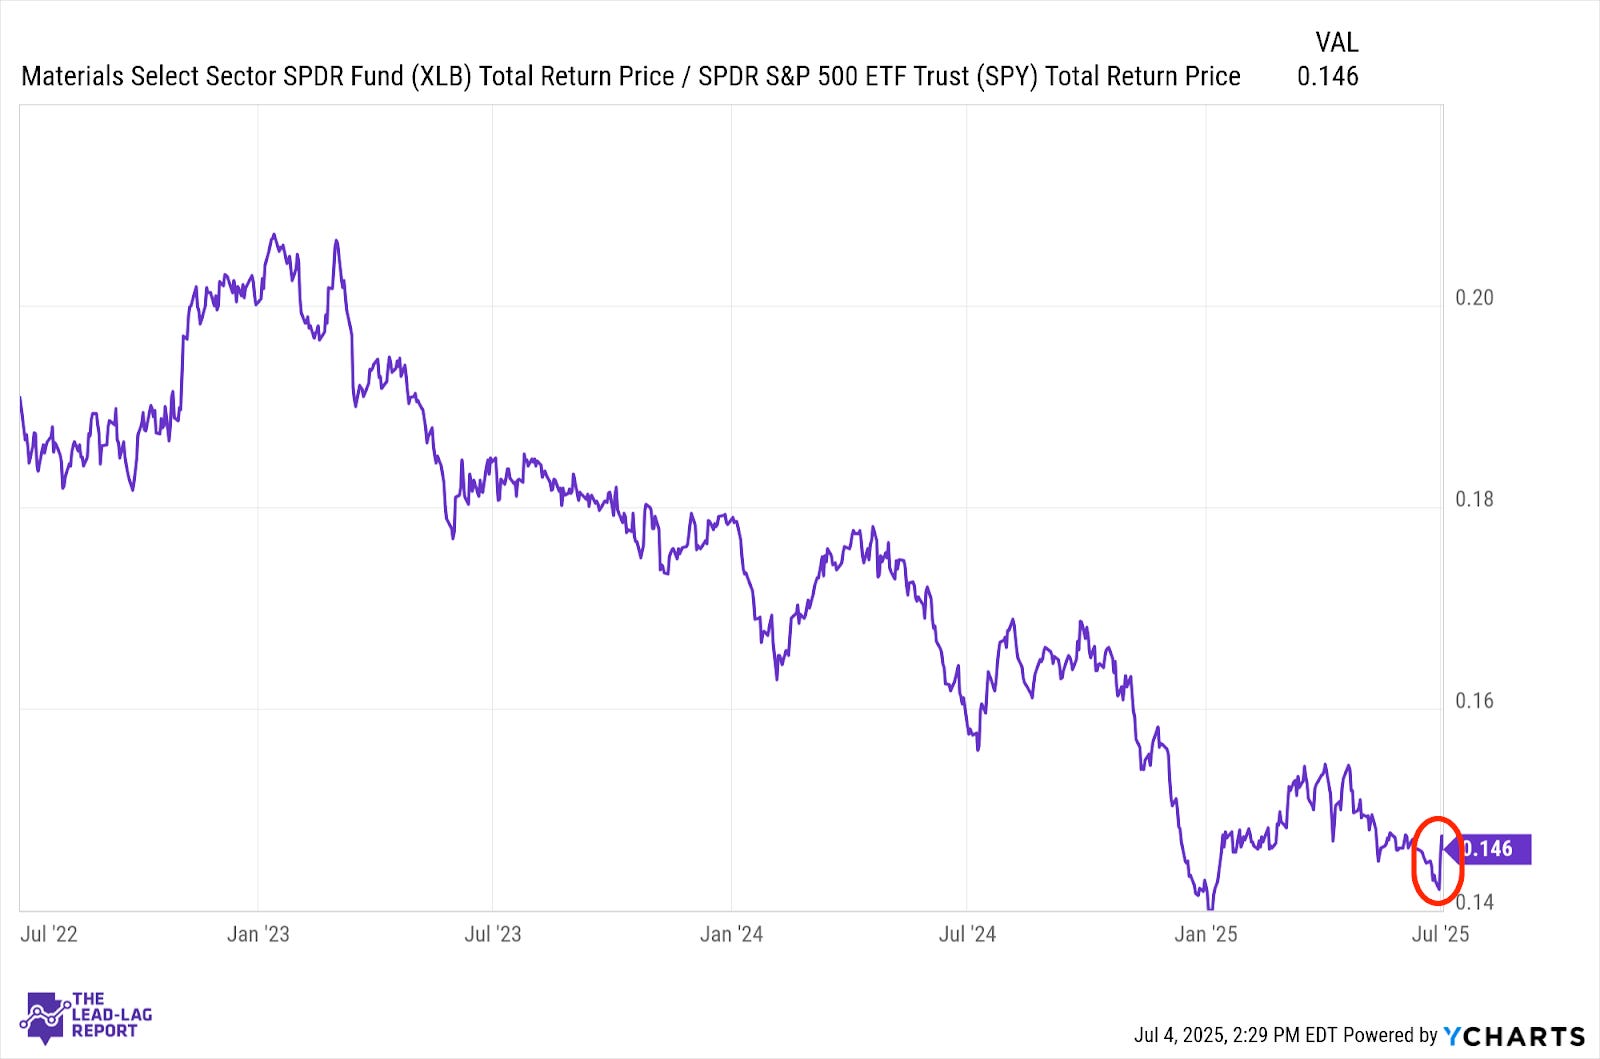
There was no bigger winner last week than materials, which got a big boost from the bullishness around the economic expansion theme. While there are still a lot of questions around the global commodities market, there’s enough value in this sector and enough upside potential due to the anticipated liquidity addition to the economy that it makes this sector a solid risk/reward play.
Long Bonds (VLGSX) – Positive Outlook
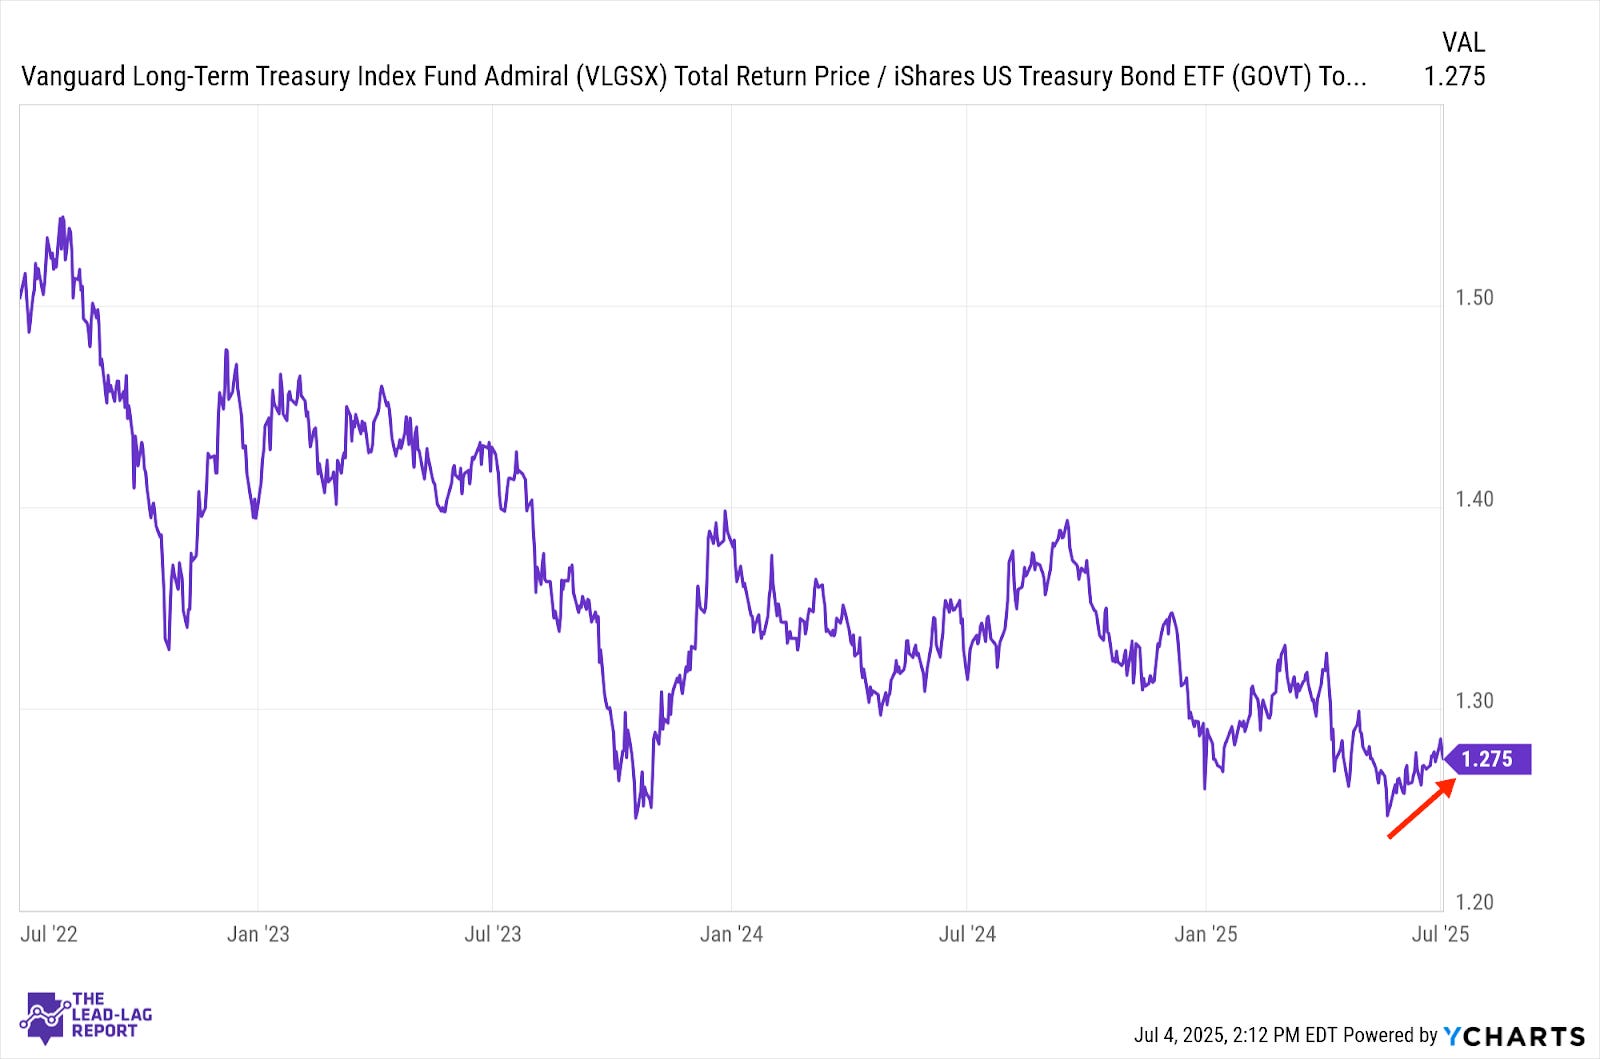
Long bonds have been steadily gaining here as the Fed gets closer to restarting its rate cutting cycle. That trend took a slight pause last week, but the potential catalysts are still there. The Fed tailwind and controlled inflation rates help, but a disappointing ADP report signaling a potentially troubled labor market and a new flight to safety helps to maintain a positive outlook for Treasuries.
Treasury Inflation Protected Securities (SPIP) – Low Priority
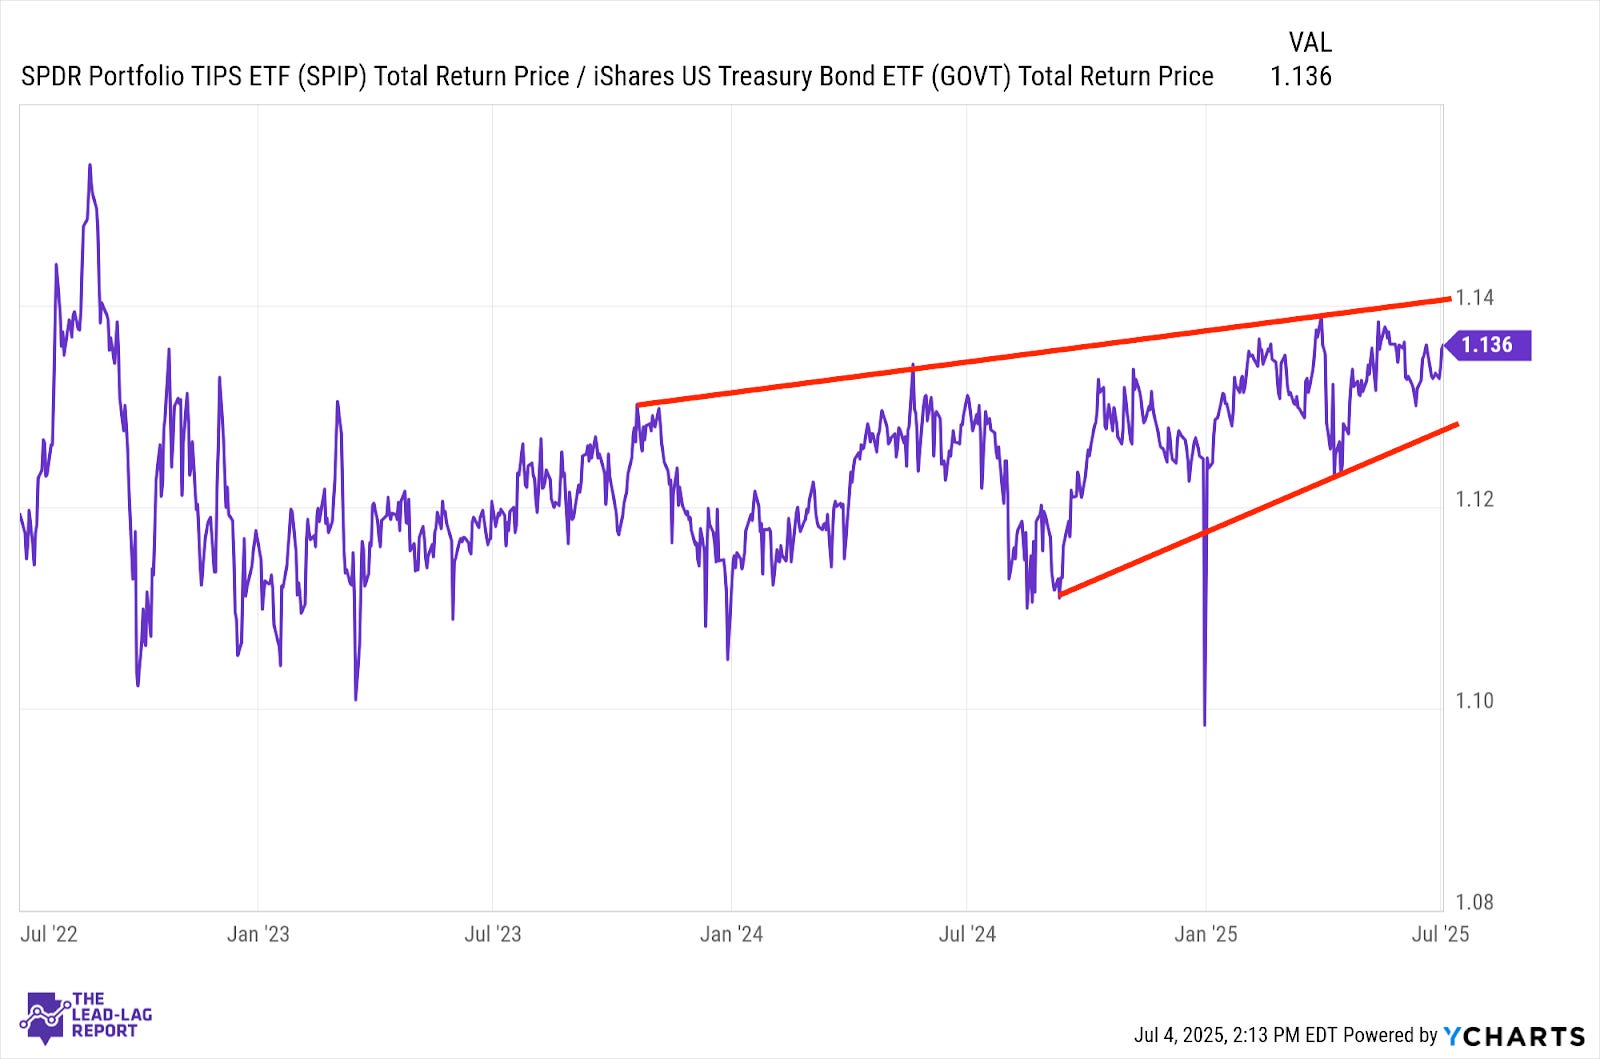
Ever since inflation rates started coming back down, inflation protection has been something of an afterthought. Trump’s tax bill, discussions of debt and the focus on the Fed have all contributed to making inflation very low on investors’ radars at the moment. Absent a new spike in inflation triggered by tariffs or excess liquidity, this ratio probably just keeps meandering along.
Junk Debt (JNK) – Liquidity Is Coming
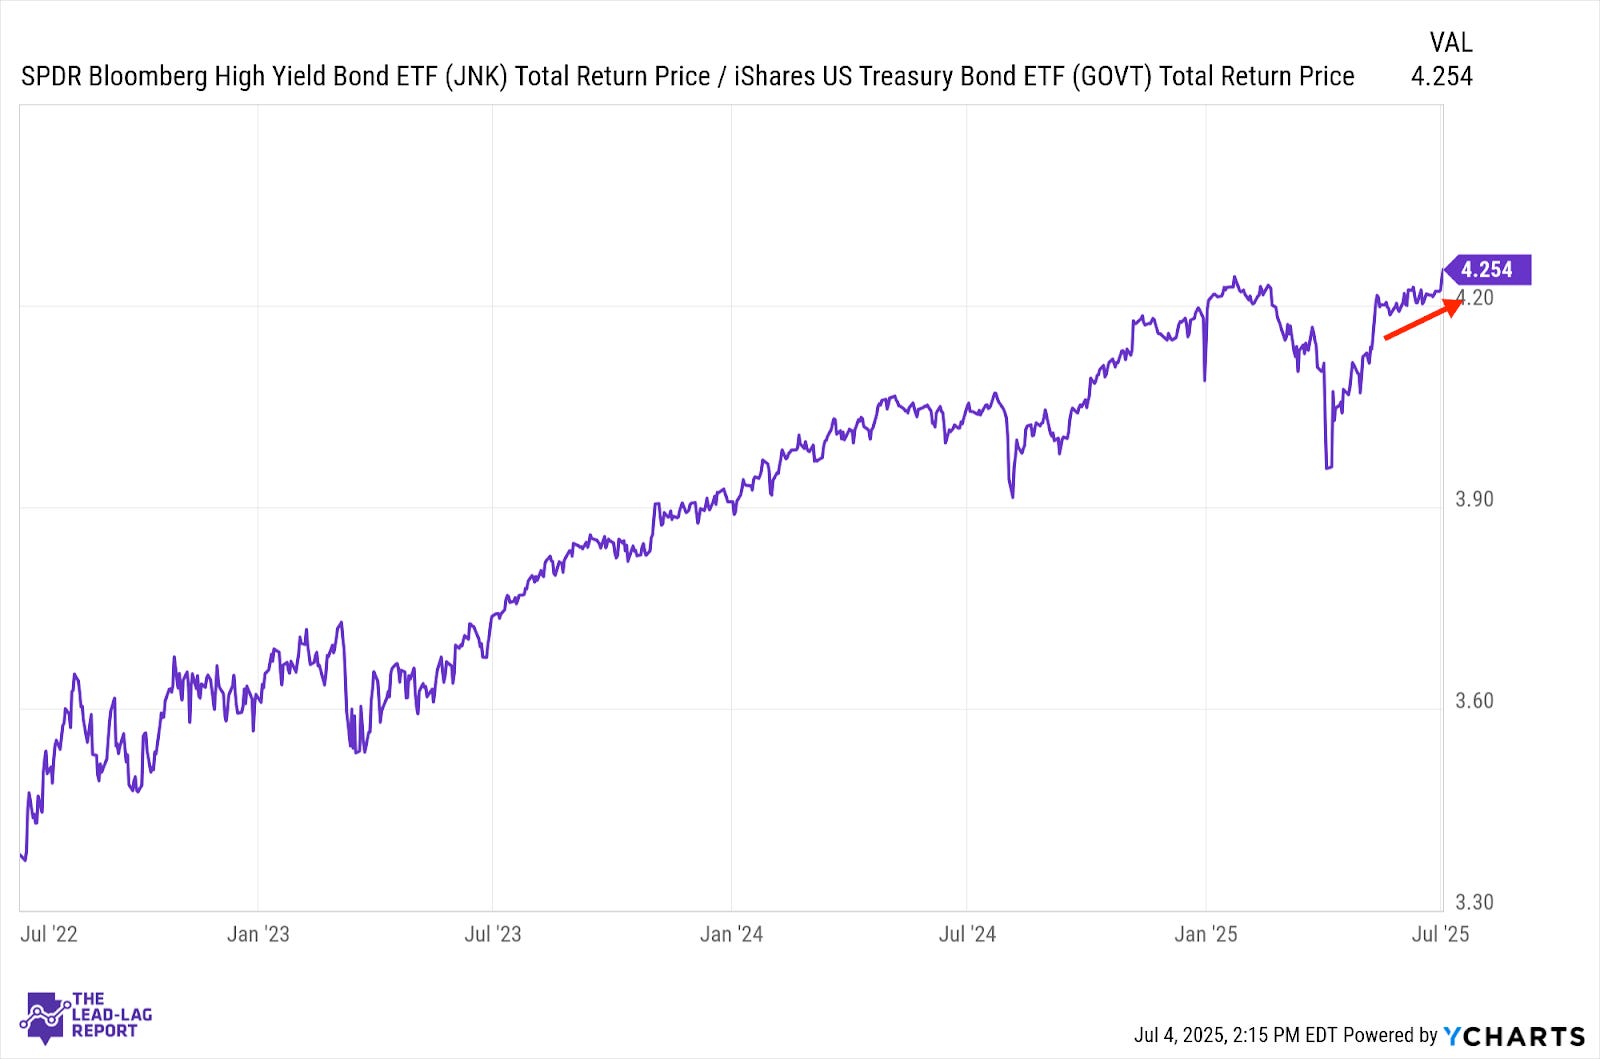
The passage of Trump’s tax bill clearly had a positive impact on the junk bond market. Fed rate cuts were helping this group maintain its positive momentum, but the liquidity addition provided by the bill likely acts as an upside catalyst for riskier bonds. Worries about tighter credit conditions ahead might suddenly not be quite as big of a concern with a big dose of liquidity coming.
Emerging Markets Debt (EMB) – The Dollar Is The Driver
