
The Dollar's Structural Bid Is Fading
The Index Has Recovered. The Buyers Underneath It Have Not.
Today’s Lead-Lag Report post is sponsored by TappAlpha
Just ten companies now command close to 40% of the index — the most top-heavy the U.S. equity market has been in over fifty years.
That is the index you own. Whether or not you meant to.
For advisors holding S&P 500 exposure for income-oriented clients, the math is uncomfortable. You are paid in price appreciation (when it comes), and the dividend yield on the broad index is roughly 1%. That is the deal.
TSPY rewrites the deal.
TSPY (TappAlpha S&P 500 Growth and Daily Income ETF) writes a daily call overlay on top of S&P 500 exposure, designed to convert intraday volatility into distributable income on a daily reset cadence. When concentration drives wider intraday ranges — as it has every time mega-cap earnings or AI-capex headlines hit — TSPY’s daily overlay is positioned to monetize that movement rather than simply ride it.
For advisors asking: “How do I keep clients in S&P 500 exposure while the index sits at record concentration, without telling them to stomach 1.3% yield and 40% tech beta?” — TSPY is the income overlay built for exactly that question.
The performance data quoted represents past performance. Past performance does not guarantee future results.
Learn more at tappalpha.com.
____________________________________________________________
Disclosures
Investors should carefully consider the investment objectives, risks, charges and expenses of the ETFs identified on this site. This and other important information about the Fund are contained in the prospectus, which can be obtained at tappalphafunds.com or by calling (844) 403-2888. The prospectus should be read carefully before investing.
Investing in securities involves risk, including the potential loss of principal.
The principal risks affecting shareholders’ investments in the Fund including the risks of the investment strategies of the Index are set forth below. An investment in the Fund is not a bank deposit and is not insured or guaranteed by the FDIC or any government agency. The Fund’s Shares will change in value, and you could lose money by investing in the Fund. The Fund may not achieve its investment objectives.
ETFs are subject to additional risks that do not apply to conventional mutual funds, including the risks that the market price of an ETF’s shares may trade at a premium or discount to its net asset value, an active secondary trading market may not develop or be maintained, or trading may be halted by the exchange in which they trade, which may impact a Fund’s ability to sell its shares. Shares of any ETF are bought and sold at market price (not NAV) and are not individually redeemed from the Fund. Brokerage commissions will reduce returns.
Investing involves risk. Principal loss is possible. The Fund’s shares will change in value, and you could lose money by investing in the Fund. The Fund may not achieve its investment objectives. The Fund invests in options contracts that are based on the value of the Index, including SPX and XSP options. This subjects the Fund to certain of the same risks as if it owned shares of companies that comprised the Index, even though it does not own shares of companies in the Index. The Fund will have exposure to declines in the Index. The Fund is subject to potential losses if the Index loses value, which may not be offset by income received by the Fund. By virtue of the Fund’s investments in options contracts that are based on the value of the Index, the Fund may also be subject to an indirect investment risk, an index trading risk & an S&P 500 Index Risk.
To the extent that the Fund invests in other ETFs or investment companies, the value of an investment in the Fund is based on the performance of the underlying funds in which the Fund invests and the allocation of its assets among those ETFs or investment companies. The Fund may incur high portfolio turnover to manage the Fund’s investment exposure. The Fund is classified as “non-diversified” under the 1940 Act. As a result, the Fund is only limited as to the percentage of its assets which may be invested in the securities of any one issuer by the diversification requirements imposed by the Internal Revenue Code of 1986, as amended (the “Code”). A decline in the value of an investment in a single issuer could cause a Fund’s overall value to decline to a greater degree than if the Fund held a more diversified portfolio. For more information about the risks of investing in this Fund, please see the prospectus.
The SPDR® S&P 500® ETF Trust. The SPDR® S&P 500® ETF Trust seeks to provide investment results that, before expenses, correspond generally to the price and yield performance of the S&P 500® Index (the “Index”).
The S&P 500® Index. The S&P 500® Index is a widely recognized benchmark index that tracks the performance of 500 of the largest U.S.-based companies listed on the New York Stock Exchange or Nasdaq. These companies represent approximately 80% of the total U.S. equities market by capitalization, making it a large-cap index. The S&P 500® Index includes 500 selected companies, all of which are listed on national stock exchanges and spans a broad range of major sectors. The five largest sectors in the Index as of December 29, 2023 were information technology, financials, healthcare, consumer discretionary and industrials. This distribution can vary over time as the market value of these sectors change. Regarding volatility, the S&P 500® Index, like all market indices, has experienced periods of significant daily price movements. However, the specific degree of volatility can vary and is subject to change based on overall market conditions. Despite these periods of volatility, the Index has shown long-term growth over its history.
Due to the short time until their expiration, 0DTE options are more sensitive to sudden price movements and market volatility than options with more time until expiration. Because of this, the timing of trades utilizing 0DTE options becomes more critical. Even a slight delay in the execution of 0DTE trades can significantly impact the outcome of the trade. 0DTE options may also suffer from low liquidity, making it more difficult for the Fund to enter into its positions each morning at desired prices. The bid-ask spreads on 0DTE options can be wider than with traditional options, increasing the Fund’s transaction costs and negatively affecting its returns. These risks may negatively impact the performance of the fund.
The Fund may incur high portfolio turnover to manage the Fund’s investment exposure. Additionally, active market trading of the Fund’s Shares may cause more frequent creation or redemption activities that could, in certain circumstances, increase the number of portfolio transactions. High levels of portfolio transactions increase brokerage and other transaction costs and may result in increased taxable capital gains. Each of these factors could have a negative impact on the performance of the Fund.
Passive Strategy/Index Risk. SPY and VOO are not actively managed. Rather, SPY and VOO attempt to track the performance of an unmanaged index of securities. This differs from an actively managed fund, which typically seeks to outperform a benchmark index. As a result, SPY and VOO will hold constituent securities of the Index regardless of the current or projected performance of a specific security or a particular industry or market sector.
Index Tracking Risk. While SPY and VOO are intended to track the performance of the S&P 500® Index (the “Index”) as closely as possible (i.e., to achieve a high degree of correlation with the Index), SPY and VOO’s return may not match or achieve a high degree of correlation with the return of the Index due to expenses and transaction costs incurred in adjusting the Portfolio.
Non-Diversification Risk. The Fund is classified as “non-diversified” under the 1940 Act. As a result, the Fund is only limited as to the percentage of its assets which may be invested in the securities of any one issuer by the diversification requirements imposed by the Internal Revenue Code of 1986, as amended (the “Code”). A decline in the value of an investment in a single issuer could cause a Fund’s overall value to decline to a greater degree than if the Fund held a more diversified portfolio. The Fund seeks to achieve its investment objective by entering into one or more options contracts. The Fund may invest a relatively high percentage of its assets in a limited number of issuers and/or in options contracts with a single counterparty or a few counterparties. As a result, the Fund may experience increased volatility and be more susceptible to a single economic or regulatory occurrence affecting one or more of these issuers and/or counterparties.
You could lose money by investing in the Fund and the Fund may not achieve its investment objectives.
____________________________________________________________
Definitions
Daily call overlay (covered call) — An options strategy in which call options are written (sold) against an underlying holding. The seller collects option premium as income in exchange for capping gains above the option’s strike price. A “daily” overlay writes and resets these options each trading day.
AI-capex (artificial-intelligence capital expenditure) — Large, ongoing spending by major technology companies on data centers, semiconductors, and related infrastructure to build AI capabilities. Uncertainty over the returns on this spending is a notable driver of mega-cap and index volatility.
Tech beta — A measure of how much a portfolio moves relative to the technology segment of the market. A higher figure indicates greater sensitivity to moves in large technology stocks.
Dividend yield — A stock’s or index’s annual dividends expressed as a percentage of its price.
DISCLAIMER — PLEASE READ: This is sponsored advertising content for which Lead-Lag Publishing, LLC is being paid a fee. The information provided is solely the creation of TappAlpha. Lead-Lag Publishing, LLC does not guarantee the accuracy or completeness of the information provided or make any representation as to its quality. All statements and expressions provided are the sole opinion of TappAlpha and Lead-Lag Publishing, LLC expressly disclaims any responsibility for action taken in connection with the information provided.
The Dollar’s Structural Bid Is Fading
KEY HIGHLIGHTS
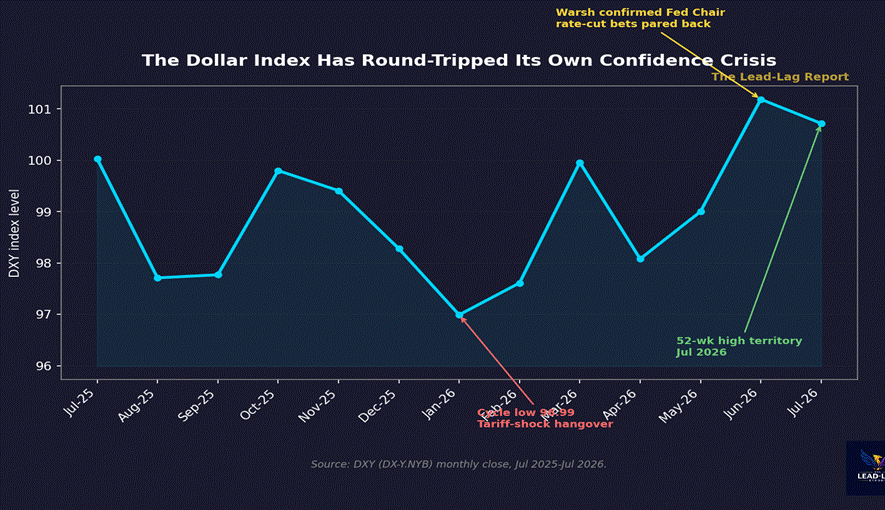
• The Dollar Index has round-tripped from a January 2026 cycle low of 96.99 back to 52-week-high territory at 100.72-101.19 by June-July 2026, undercutting the simple narrative that dollar confidence is collapsing.
• Beneath that recovery, foreign official holdings of Treasuries have not kept pace: foreign holders sold $138.4 billion in March 2026, the largest one-month drawdown since September 2022, and China’s holdings fell to an 18-year low of roughly $651 billion.
• Since 2023, foreign private investors have added $1.3 trillion to Treasury holdings while the official sector added only $0.1 trillion — private capital, not central banks, is now the marginal buyer of US government debt.
• Central banks bought an estimated 1,237 tonnes of gold in 2025 and are still running near a 350-tonne annualized pace in 2026, roughly 2.5 times the 2010-2021 average, even as gold prices fell about 21% from their February 2026 peak.
• The USD share of allocated global FX reserves sits at 57.1% in Q1 2026, up slightly from 56.4% in Q4 2025 but still near a 25-year low — a slow structural bleed, not the acute funding stress visible in the 2020 or 2022 crises.
The easy version of the dollar story died sometime around April. Back then the index had broken below 99, gold was making new highs alongside it, and the narrative wrote itself: confidence in the dollar was cracking, and the money was voting with its feet into hard assets. That story required the dollar to keep falling. It did not.
The Dollar Index bottomed at 96.99 in January 2026 and has since round-tripped almost the entire move, closing at 101.19 in June and 100.72 in July — 52-week-high territory.[1] Kevin Warsh’s confirmation as Federal Reserve Chair in the spring pared back rate-cut expectations and gave the dollar a floor. Anyone still running the simple version of the confidence-crack thesis — falling dollar, rising gold, straight line to crisis — has to explain why the index is back near a year high.
But a recovering index price is not the same thing as a recovering structural bid. The question worth asking is not where the exchange rate sits this week. It is who is still showing up to fund $9-plus trillion of foreign-held Treasury debt, and on what terms.
Gold and the Dollar Have Stopped Trading as Mirror Images
The first crack in the simple narrative is the correlation itself. Gold and the dollar are supposed to move in opposite directions — dollar weakness is the classic driver of gold strength. That relationship held cleanly from mid-2025 through February 2026, when gold-backed GLD shares rose from roughly $303 to a peak of $483.75 as the dollar sold off.[2] Since February, gold has fallen about 21%, to $382.13 in July, while the dollar has risen. Both assets moved the same direction for four straight months. That is not what a clean confidence-crisis trade looks like.
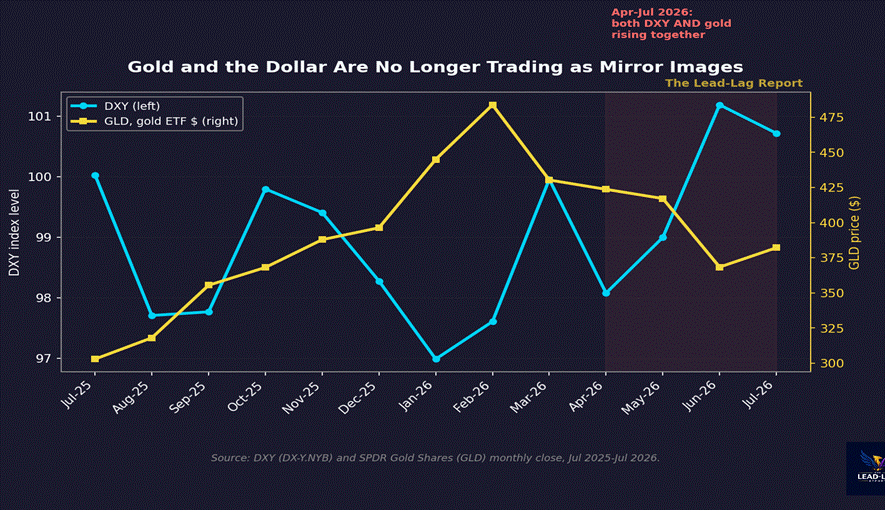
There are two ways to read the decoupling. One is that the dollar-confidence story was overstated to begin with, and the gold rally was a momentum and positioning trade that is now unwinding on its own. The other is that the two assets are now responding to different inputs — the dollar to the Fed’s reaction function and rate-cut repricing under Warsh, gold to central bank reserve diversification that operates on a multi-year horizon and does not care about a single quarter’s exchange rate print. The data on official-sector behavior favors the second read.
The Marginal Buyer of Treasuries Has Already Changed
Total foreign holdings of US Treasuries hit a record $9.487 trillion in February 2026, then fell to $9.25 trillion in March — a $138.4 billion drop, the largest single-month decline since September 2022.[3] Japan’s holdings fell from $1.239 trillion to $1.192 trillion. China’s fell to $652.3 billion, the lowest level since September 2008 and down more than 14% since the start of 2025.[4] April brought a partial rebound — foreigners bought a net $103 billion in US securities and total holdings rose back to $9.353 trillion — but China’s position kept drifting lower, to roughly $651 billion.[5]
The headline aggregate obscures the more important compositional shift. Treasury’s own Borrowing Advisory Committee data shows that since 2023, foreign private investors have increased their Treasury holdings by $1.3 trillion, while the foreign official sector — central banks and sovereign reserve managers — added only $0.1 trillion over the same period.[6] As of the most recent full-year data, the official sector holds 41.9% of foreign-held Treasuries and the private sector holds 58.1%, a split that has been shifting toward private ownership since at least 2015, when Treasuries were 35% of foreign-held US securities versus 22% today.[7]
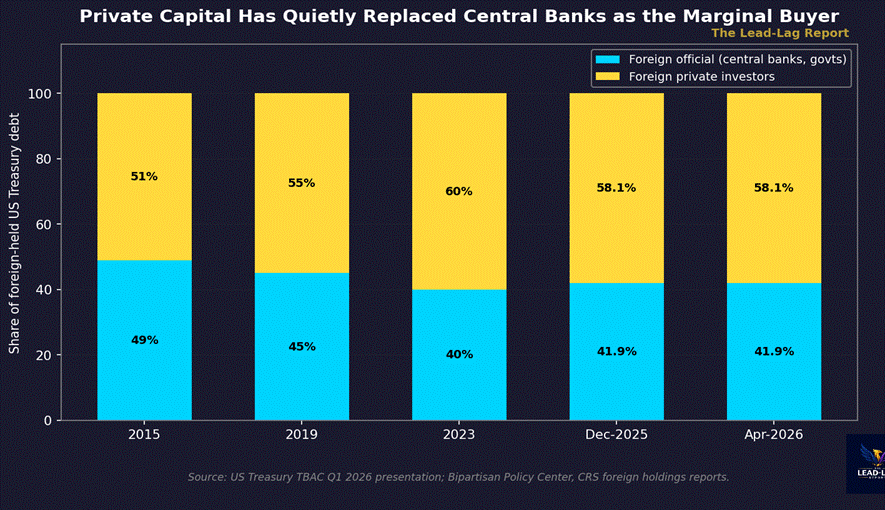
This matters because private capital and official capital do not behave the same way under stress. Central bank reserve managers hold Treasuries as a policy instrument — for exchange rate management, crisis reserves, and diplomatic signaling — and have historically been a stable, price-insensitive source of demand. Private investors, whether hedge funds, insurers, or basis traders, hold Treasuries as a return-seeking position and will rotate out the moment the carry trade or the relative-value arbitrage stops working. A funding structure that depends more on private, return-chasing capital and less on official, policy-driven capital is a more fragile funding structure, even if the headline total looks stable.
Central Banks Are Still Buying Gold, Just More Quietly
If official reserve managers are stepping back from Treasuries, the obvious question is where that capital is going instead. Gold is the clearest answer, even though the price says otherwise for now. Central banks purchased an estimated 1,237 tonnes of gold in 2025, extending a buying pace that has run at roughly double the 2010-2021 average of 473 tonnes per year since Russia’s reserves were frozen in 2022.[8] The People’s Bank of China alone has added to its reserves for 20 consecutive months, a streak that reached roughly 2,346 tonnes in cumulative official holdings, with a further 14.93 tonnes purchased in June 2026 alone.[9] World Gold Council data puts the trailing 36-month average purchase pace at approximately 29 tonnes per month, which annualizes to a run-rate in the high 300s of tonnes for 2026 — down from the 2022-2025 peak years but still structurally elevated versus the pre-2022 baseline.[10]
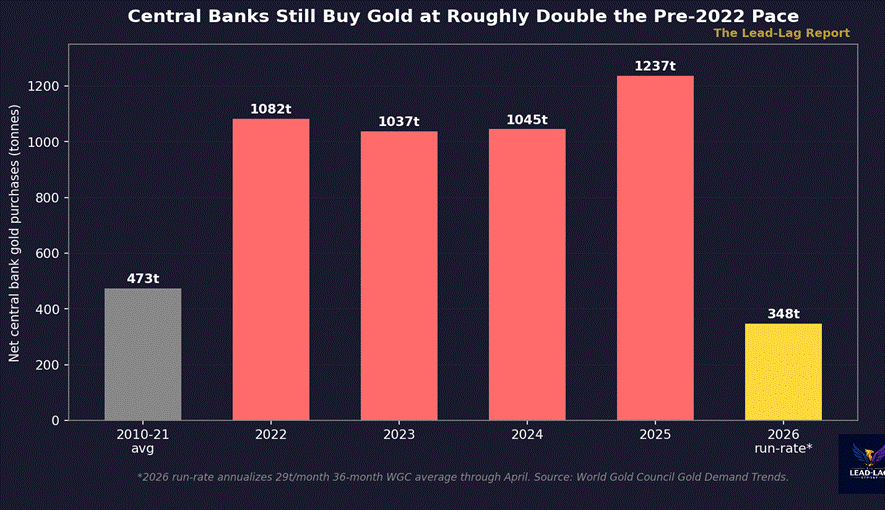
The price pullback since February complicates the narrative without breaking it. Central banks buy gold on a multi-year reserve-diversification horizon, not a trading horizon, and continuing to add tonnage into a 21% price correction is arguably a stronger signal of conviction than buying into new highs would have been. The gold allocation decision and the Treasury reduction decision appear to be two sides of the same reserve-composition rebalancing, executed at different speeds and with different sensitivity to near-term price action.
Two Speeds of Confidence: Plumbing Versus Allocation
A genuine dollar funding crisis would show up first in the plumbing — in Federal Reserve central bank liquidity swap usage, the emergency facility that keeps offshore dollar funding markets from seizing when foreign banks cannot source dollars through normal channels. During the March 2020 COVID shock, swap line balances peaked near $449 billion. During the September 2022 UK gilt crisis, usage rose to roughly $24 billion. During this spring’s brief Iran-related market stress, swap balances rose to only about $5.2 billion before fading. As of the most recent H.4.1 release, swap line usage sits at approximately $250 million — effectively dormant.[11]
Compare that to the allocation data. The IMF’s COFER series shows the US dollar’s share of allocated global FX reserves at 57.13% in the first quarter of 2026, a modest increase from 56.42% in the fourth quarter of 2025 — an uptick the IMF attributes mostly to valuation effects rather than active reserve reallocation.[12] That share is still down from 65.4% at the 2016 peak and 71% in 1999, when the euro did not yet exist as a reserve alternative.[13]
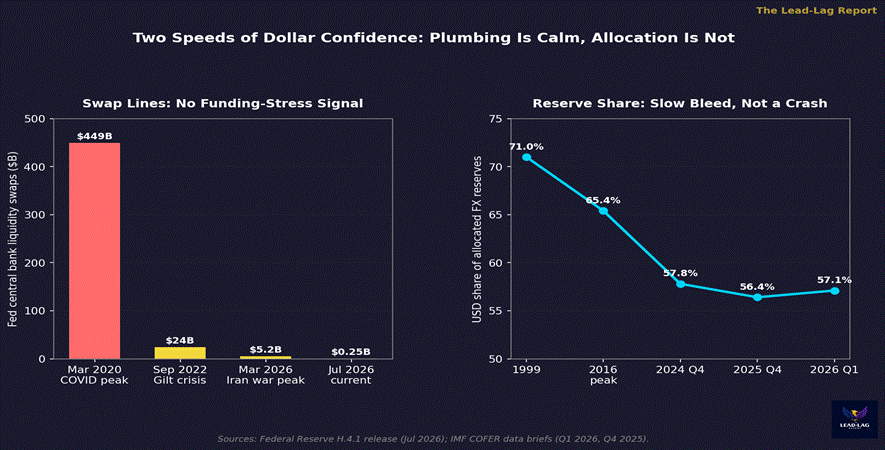
Reading the two panels together: there is no acute funding stress in the system that would force a disorderly dollar repricing this quarter. But there is a slow, multi-year bleed in the dollar’s structural role as the reserve currency of choice, running in parallel with a shift in who is willing to fund it. Slow bleeds are easier to ignore than crises, which is exactly why they tend to run longer before anyone reprices around them.
What This Is Not
It is worth being precise about what the data does not show. BRICS-aligned payment infrastructure — BRICS Pay, the mBridge central bank digital currency corridor, and the proposed gold-linked settlement unit sometimes called “The Unit” — continues to generate headlines, but none of it operates at a scale that displaces dollar-denominated trade settlement today. mBridge’s cumulative transaction volume remains in the tens of billions of dollars, a rounding error against the roughly $7 trillion in daily global FX turnover in which the dollar is on one side of about 88% of trades.[14] The de-dollarization thesis in its maximalist form — an imminent multipolar reserve system displacing the dollar within a few years — is not supported by the swap-line data, the COFER pace, or the actual settlement volumes on alternative rails.
What the data does support is narrower and, in some ways, more durable: a gradual, multi-year reallocation of official reserve portfolios away from Treasuries and toward gold, running alongside a compositional shift in who funds US government debt from official to private hands. That is a trend that has been running since at least 2015 and shows no sign of reversing, even as the headline exchange rate does something else entirely in any given quarter.
The mistake in April was treating the exchange rate and the gold price as the whole story. The mistake now would be treating their recent decoupling as evidence the confidence-erosion thesis was wrong. The exchange rate is priced by the marginal trader on any given day, positioned around Fed policy and rate differentials. The reserve composition is priced by central banks on a multi-year horizon, and it has kept moving in one direction through both the dollar’s fall and its recovery.
For positioning purposes, the distinction is the whole exercise. A dollar-confidence thesis expressed through a short-dollar, long-gold trade is a bet on near-term price action that has already round-tripped once this year and could easily do so again. A dollar-confidence thesis expressed through exposure to the assets and jurisdictions benefiting from the multi-year reserve reallocation — gold and gold-adjacent exposure, non-dollar reserve-currency proxies, and duration-light Treasury alternatives — is a bet on a trend that has persisted through four distinct exchange-rate regimes over the past eighteen months without interruption.
Few understand this.
— — —
Notes
[1] Dollar Index (DX-Y.NYB) monthly close history, July 2025-July 2026. Cycle low 96.99 (Jan 2026); 101.19 (Jun 2026); 100.72 (Jul 2026).
[2] SPDR Gold Shares (GLD) monthly close history, July 2025-July 2026. Peak $483.75 (Feb 2026); $382.13 (Jul 2026), approximately -21% from peak.
[3] Bloomberg, “Foreign Holdings of US Treasuries Fell in March Amid Bill Sales,” May 18, 2026. https://www.bloomberg.com/news/articles/2026-05-18/foreign-holdings-of-us-treasuries-fell-in-march-amid-bill-sales
[4] Reuters, “Japan, China Lead Declines in Foreign Holdings of Treasuries, March Data Shows,” May 18, 2026. https://www.reuters.com/world/china/japan-china-lead-declines-foreign-holdings-treasuries-march-data-shows-2026-05-18/ ; CNBC, “Central Banks Offload US Treasuries, China Holdings at 18-Year Low,” May 19, 2026. https://www.cnbc.com/2026/05/19/central-banks-offload-us-treasuries-china-holdings-at-18-year-low.html
[5] Reuters, “Foreigners Bought $103 Billion in US Securities in April, Treasury Holdings Rise,” June 18, 2026. https://www.reuters.com/business/foreigners-bought-103-billion-us-securities-april-treasury-holdings-rise-2026-06-18/
[6] US Department of the Treasury, Treasury Borrowing Advisory Committee (TBAC) Q1 2026 Charge/Presentation. https://home.treasury.gov/system/files/221/TBACCharge2Q12026.pdf
[7] Congressional Research Service, “Foreign Holdings of Federal Debt,” updated April 22, 2026 (data as of Dec 2025: official 41.9% / private 58.1% of $9.2T foreign-held Treasuries). https://www.everycrsreport.com/files/2026-04-22_RS22331_782b7a44e9cbb478e1756860516a46ffa4d2ecf1.html ; Bipartisan Policy Center, “Foreign Investors Hold a Shrinking Share of US Debt,” updated May 4, 2026. https://bipartisanpolicy.org/article/foreign-investors-hold-a-shrinking-share-of-u-s-debt/
[8] World Gold Council, Gold Demand Trends, full-year 2025 and prior editions. Central bank net purchases: 2010-2021 average approximately 473 tonnes/year; 2022 1,082t; 2023 1,037t; 2024 1,045t; 2025 approximately 1,237t.
[9] People’s Bank of China reserve data via Reuters and World Gold Council trackers; 20 consecutive months of reported gold reserve additions through mid-2026; June 2026 addition of 14.93 tonnes; cumulative official holdings approximately 2,346 tonnes.
[10] World Gold Council, Gold Demand Trends, trailing 36-month average monthly central bank purchase pace approximately 29 tonnes.
[11] Federal Reserve H.4.1 statistical release, “Factors Affecting Reserve Balances,” July 2026 (central bank liquidity swap line balances). Historical peaks: March 2020 approximately $449B; September 2022 approximately $24B; March 2026 approximately $5.2B. https://www.federalreserve.gov/releases/h41/
[12] International Monetary Fund, Currency Composition of Official Foreign Exchange Reserves (COFER), Q1 2026 data release. USD share 57.13% (Q1 2026) vs 56.42% (Q4 2025). https://www.imf.org/en/News/Articles/2026/06/30/pr26-cofer-q1-2026
[13] IMF COFER historical series: USD share 71.0% (1999), 65.4% (2016 peak).
[14] Bank for International Settlements, Triennial Central Bank Survey of FX turnover (dollar on one side of approximately 88% of trades); mBridge Project cumulative settlement volume disclosures via BIS Innovation Hub and Reuters/Rio Times reporting on BRICS payment infrastructure, 2026.
The Lead-Lag Report is provided by Lead-Lag Publishing, LLC. All opinions and views mentioned in this report constitute our judgments as of the date of writing and are subject to change at any time. Information within this material is not intended to be used as a primary basis for investment decisions and should also not be construed as advice meeting the particular investment needs of any individual investor. Trading signals produced by the Lead-Lag Report are independent of other services provided by Lead-Lag Publishing, LLC or its affiliates, and positioning of accounts under their management may differ. Please remember that investing involves risk, including loss of principal, and past performance may not be indicative of future results. Lead-Lag Publishing, LLC, its members, officers, directors and employees expressly disclaim all liability in respect to actions taken based on any or all of the information on this writing.