
The Emerging Market Rally Has a Selection Problem
Korea Is Doing the Work. China, India, and Indonesia Are Not Along for the Ride

Today’s Lead-Lag Report post is sponsored by WisdomTree

Today’s Lead-Lag Report is brought to you by our friends at WisdomTree. Investors often treat growth and value as an either/or decision, chasing what’s working now while hoping they’re positioned for what’s next. WisdomTree has an approach that aims to solve that dilemma: own the characteristics that have historically mattered most. QGRW focuses on companies with strong growth potential backed by quality fundamentals, while WTV targets attractively valued companies with favorable earnings characteristics. Together, they offer a disciplined way to balance growth and value without relying on style timing. Learn more about blending quality and growth here.
Disclaimer
DISCLAIMER — PLEASE READ: This is sponsored advertising content for which Lead-Lag Publishing, LLC is being paid a fee. The information provided is solely the creation of WisdomTree, Inc. Lead-Lag Publishing, LLC does not guarantee the accuracy or completeness of the information provided or make any representation as to its quality. All statements and expressions provided are the sole opinion of WisdomTree Investments, Inc. and Lead-Lag Publishing, LLC expressly disclaims any responsibility for action taken in connection with the information provided.
Important information from WisdomTree: Investors should carefully consider the investment objectives, risks, charges and expenses of the Fund before investing. For a prospectus or, if available, the summary prospectus containing this and other important information about the fund, call 866.909.9473 or visit WisdomTree.com/investments. Read the prospectus or, if available, the summary prospectus carefully before investing.
There are risks involved with investing, including possible loss of principal.
WisdomTree Funds are distributed by Foreside Fund Services, LLC, in the U.S.
The Quiet Unwind: EEM/XLK/Financials Reclaim Leadership, Defensive Extreme Fades, Fed Watch Looms
KEY HIGHLIGHTS
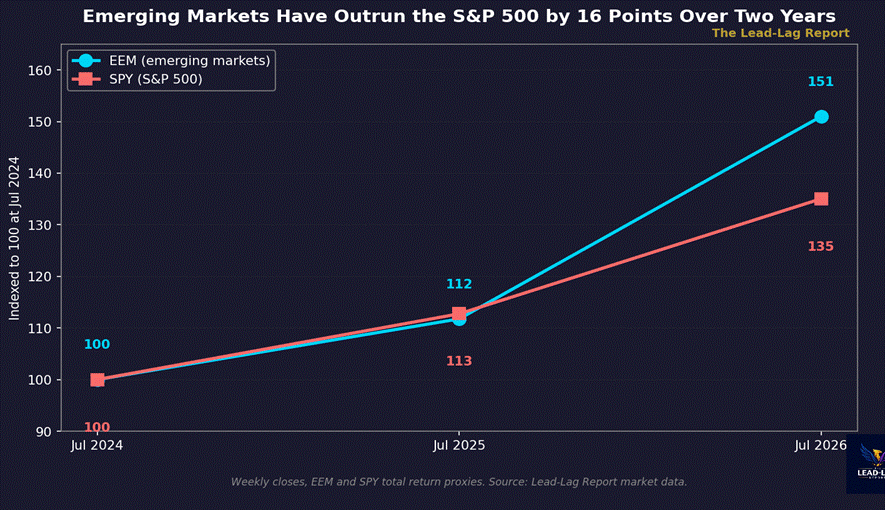
• EEM has outrun the S&P 500 by roughly 16 percentage points over the trailing two years, but the composite number is hiding a rally that is anything but broad.
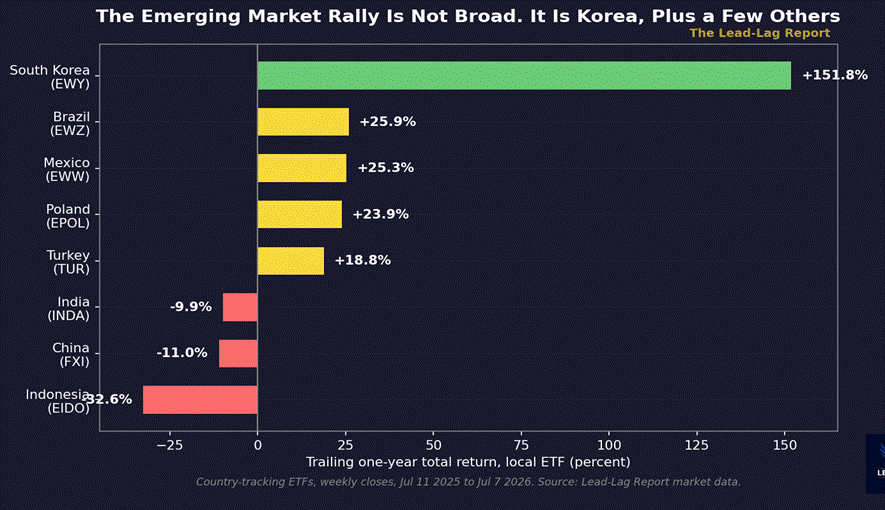
• South Korea’s EWY is up 152% over the trailing year while China’s FXI is down 11%, India’s INDA is down 10%, and Indonesia’s EIDO is down 33% over the same window.
• The dollar fell 7.4 points on the DXY through 2025 and has since stabilized, ticking back above 100 by July 2026 — the weak-dollar tailwind that powered the original EM re-rating has paused.
• The IMF cut its 2026 emerging-market growth forecast to 3.9% from 4.2% in January, citing the Middle East conflict, even as Brazil and Mexico GDP estimates were revised upward.
• Brazil’s central bank has cut rates for a third straight meeting to 14.25%, while Mexico’s Banxico held unanimously at 6.50% in June after two years of cuts — the EM cutting cycle is now diverging, not moving in unison.
Seven weeks ago I wrote that emerging markets were quietly eating the S&P 500’s lunch while mega-cap tech carried the index to new highs. That thesis has not just held. It has strengthened, on the headline number, to a degree that should make anyone benchmarked to the MSCI EM index feel vindicated.
It should also make them nervous, because the composite number is now concealing more than it reveals.
EEM has gone from 43.63 to 65.88 over the trailing two years, a 51% advance, versus the S&P 500’s 35% gain over the identical window.[1] Over the trailing twelve months alone, EEM is up approximately 35% against the S&P 500’s roughly 20%.[2] On the surface this reads as confirmation: emerging markets, structurally underweight in most institutional portfolios, are finally getting their turn. Underneath the surface, the story is narrower and more interesting than that.
One Country Is Carrying the Index
Break the EM basket into its country-level components and the aggregate outperformance stops looking like a regime shift and starts looking like a single, concentrated bet that happens to be large enough to move the benchmark. South Korea’s EWY is up approximately 152% over the trailing year, from 72.56 to 182.71, peaking near 219 in mid-June.[3] That is not an emerging-market rally. That is a semiconductor and technology rally that happens to be domiciled in an emerging market.
Bloomberg flagged this directly in February, noting that Korea’s equity ranking had climbed past France’s on the back of the same AI infrastructure demand that has powered US mega-cap tech.[4] Meanwhile Brazil’s EWZ is up about 26%, Mexico’s EWW about 25%, Poland’s EPOL about 24%, and Turkey’s TUR about 19% — solid, unremarkable gains consistent with a normal commodity-and-rate-cut cycle. China’s FXI is down approximately 11% over the same twelve months, India’s INDA down approximately 10%, and Indonesia’s EIDO down approximately 33%, with a fresh low in June.[5]
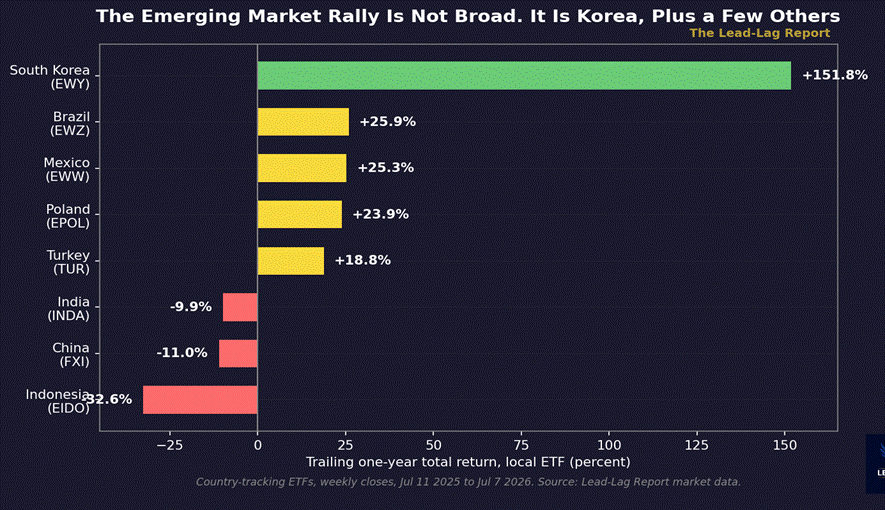
This is a dispersion story, not a beta story. An investor who bought the MSCI EM index in July 2025 captured Korea’s semiconductor cycle almost by accident, while simultaneously eating losses in three of the four largest EM economies by market capitalization. The index-level return was excellent. The median country-level experience was not.
That distinction matters for positioning. A stealth bull market that is really a concentrated single-country technology trade behaves very differently — in terms of drawdown risk, correlation to US semiconductors, and sensitivity to a single earnings season — than a genuine broad-based EM re-rating driven by currency, rates, and growth differentials.
The Weak-Dollar Tailwind Has Stalled
The original case for EM leaned heavily on dollar weakness: the DXY fell from 104.88 in July 2024 to 97.14 by mid-2025, a decline that eased financial conditions for dollar-denominated EM debt and made local-currency returns more attractive to unhedged foreign buyers. That decline has not continued. The DXY closed at 101.17 in late June 2026 and 100.72 on July 7, essentially unwinding a third of the 2025 move.[6]
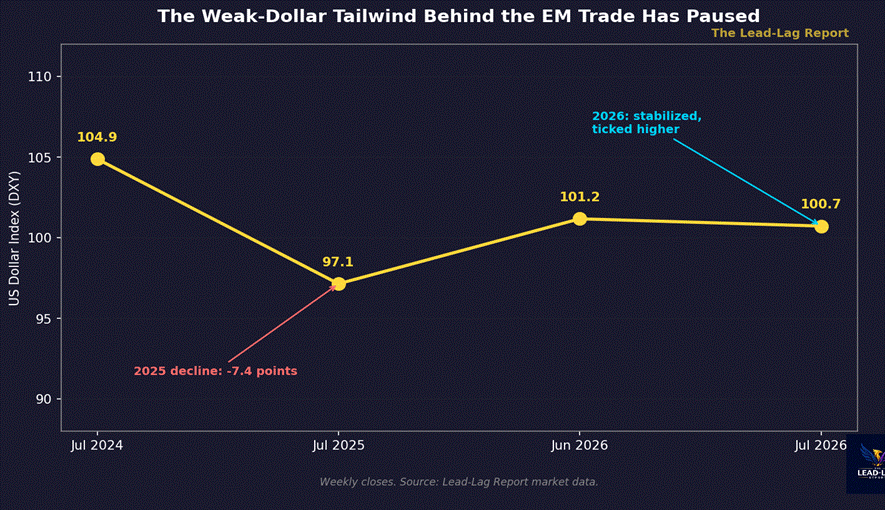
A dollar that has stopped falling and, if anything, firmed slightly, removes one of the two structural pillars beneath the original EM thesis. The fact that EEM has continued to climb even as the currency tailwind paused is itself informative — it suggests the rally, where it is genuine, is now being driven by idiosyncratic factors (Korean semiconductor demand, Brazilian and Mexican rate relief, commodity strength) rather than a single macro variable. That is a more fragile foundation for a broad-based EM overweight, and a more durable one for the countries and sectors actually generating the returns.
The IMF Cut EM Growth. Not Every Country Got Cut Equally
The IMF’s April 2026 World Economic Outlook, subtitled “Global Economy in the Shadow of War,” cut global growth to 3.1% for 2026 and 3.2% for 2027, down from 3.4% in 2025, and specifically lowered its emerging-market and developing-economy growth forecast to 3.9% for 2026, down from 4.2% in the January update.[7] The Middle East conflict is the proximate cause, and the damage is concentrated: the Middle East and Central Asia region was cut by a full two points to 1.9% growth, with Qatar, Iraq, and Iran absorbing the sharpest downgrades.[8]
But the aggregate EM downgrade obscures upward revisions inside it. China’s 2026 growth forecast was revised up to 4.4%. India remains the fastest grower among major economies at 6.5%. Brazil’s forecast moved up to 1.9% and Mexico’s to 1.6% for 2026 and 2.2% for 2027.[9] The countries actually posting equity gains — Brazil, Mexico — are also the countries whose growth outlook improved. The countries lagging in equity performance — India, and to a lesser extent China — are not seeing their growth outlook cut nearly as much as the war-exposed commodity importers. The growth story and the equity story are not perfectly aligned, which is itself a signal that positioning, not fundamentals alone, is doing some of the work in the country-level dispersion.
The Rate-Cutting Cycle Is No Longer Synchronized
A year ago, the EM central bank story was simple: Brazil, Mexico, India, and Indonesia were all easing while the Federal Reserve sat on its hands, and that policy asymmetry was a clean tailwind for EM local-currency assets. That synchronization has broken down.
Brazil’s central bank cut rates on March 19, 2026, its first cut in two years, and has kept cutting since — a third consecutive 25 basis-point reduction on June 17 brought the Selic rate to 14.25%.[10] Mexico’s Banxico cut to 6.75% in March, cut again to 6.50% in a split 3-2 vote in May, and then held rates unanimously at 6.50% on June 25-26 — a decision the Wall Street Journal characterized as the end of its easing cycle.[11]
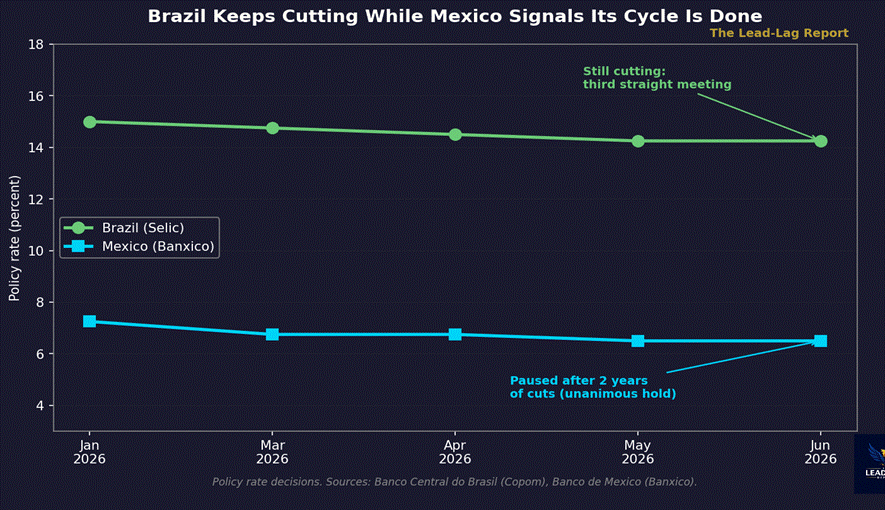
Brazil still has room to cut given a policy rate near 14%; Mexico has signaled it is done for now. That divergence matters because it means the local-currency debt trade — EMLC currently carries a 30-day SEC yield of 6.16% — is no longer a uniform bet across the asset class.[12] JPM’s EMBI Global Diversified index returned 14.3% in 2025 with high-yield sovereigns leading at 17.0%, while the local-currency GBI-EM index returned 19.3% in dollar terms — both strong years, both now facing a policy backdrop that is bifurcating rather than moving together.[13]
Commodities Are the Quiet Support Beam
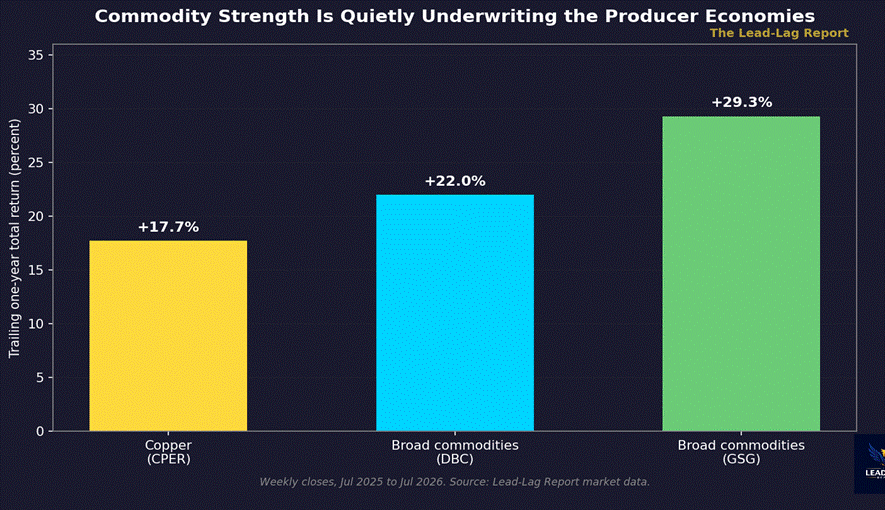
One thread that has strengthened rather than weakened since the original piece is commodities. Copper is up approximately 18% over the trailing year, and broad commodity baskets are up 22% to 29% depending on composition.[14] That backdrop disproportionately benefits commodity-exporting EM economies — Brazil most directly — and helps explain why Brazilian equities have participated in the rally even as the growth and currency tailwinds have become more mixed elsewhere in the complex.
Capital flow data adds a further wrinkle. UNCTAD’s 2026 World Investment Report found that foreign direct investment into developing economies actually declined 2% in 2025, to $877 billion, even as global FDI rose 14% to $1.6 trillion — nearly all of the increase went to developed markets.[15] Inside that developing-economy total, the divergence is stark: Brazil’s FDI rose 42% to its second-highest level on record and India’s surged 73% to $47 billion, while China’s FDI fell for a third consecutive year to $107.5 billion.[16] Portfolio flows tell a partially different story — the Institute of International Finance recorded $100.5 billion of EM portfolio inflows in January 2026 alone, before slowing sharply to $21.7 billion in February.[17] Real-economy investment and financial-market flows are not moving in lockstep. Money is chasing the trade faster than the underlying capital formation is following it.
The Other Side
The bull case for treating this as a genuine, durable EM re-rating rather than a Korea-shaped anomaly deserves a fair hearing.
First, EM equities as an asset class remain statistically cheap relative to developed markets even after the run. MSCI’s own research and multiple asset managers have documented that the EM discount to developed-market valuations widened even as EM outperformed on price — meaning multiples expanded off a low enough base that EM has not become expensive in aggregate.[18] A market that has risen 16% and gotten cheaper relative to its own history, on a relative basis, is a different animal than a market that has risen and become expensive.
Second, the composite EM number, even stripped of Korea, is not negative. Brazil, Mexico, Turkey, and Poland are all producing double-digit gains against a backdrop of easing or stabilizing policy rates and firm commodity prices. A trade concentrated in one country plus a handful of solid performers is not the same as a trade concentrated in one country alone.
Third, global fund flow data through the first half of 2026 shows emerging markets capturing an outsized share of new capital allocation relative to their weight in global benchmarks, with technology-focused EM funds seeing particularly large inflows — consistent with a structural, not purely tactical, re-rating of the asset class by allocators who have been underweight for a decade.[19] If that flow persists, the current dispersion could resolve through broadening participation rather than a Korea-led reversal.
The dispersion thesis fails if China, India, and Indonesia turn higher over the next two quarters while Korea merely consolidates — that would confirm genuine broadening rather than concentration risk. Watch relative performance among the laggards, not the index level, for the tell.
The Lead-Lag Dynamic: Selection Now Leads Beta
The lead-lag relationship inside emerging markets has changed shape since May. In the first phase of this cycle, being long the EM index versus the S&P 500 was the trade — broad exposure captured a broad tailwind of dollar weakness and synchronized rate cuts. In the current phase, the index-level return is being generated by a much narrower set of exposures, and an investor holding the aggregate is underwriting a Korean technology bet they may not have intended to make, while simultaneously holding real losses in China, India, and Indonesia that the headline number is quietly netting out.
None of this means the EM overweight thesis is wrong. It means the thesis has evolved from a beta call into a selection call, and the managers who are still underweight EM on the belief that the space is monolithic are making a different, and probably worse, mistake than the ones who were underweight a year ago. The asymmetry has shifted from being long or short the asset class to being right or wrong about which three or four countries inside it are actually working.
Few understand this.
— — —
Notes
[1] Lead-Lag Report market data, EEM and SPY weekly closes. EEM: $43.63 (Jul 5, 2024) to $65.88 (Jul 7, 2026), +51.0%. SPY: $554.64 to $749.00, +35.1%, same window.
[2] Lead-Lag Report market data, EEM and SPY weekly closes. EEM: $48.76 (Jul 3, 2025) to $65.88 (Jul 7, 2026), +35.1%. SPY: $625.34 to $749.00, +19.8%, same window.
[3] Lead-Lag Report market data, EWY (iShares MSCI South Korea ETF) weekly closes. $72.56 (Jul 11, 2025) to $182.71 (Jul 7, 2026), +151.8%; intraweek high $219.20 (Jun 18, 2026).
[4] Bloomberg, “Emerging-Market Rally Builds as Korea Tops France in Stock Ranks,” Feb 25, 2026. https://www.bloomberg.com/news/articles/2026-02-25/emerging-market-rally-builds-as-korea-tops-france-in-stock-ranks
[5] Lead-Lag Report market data, country ETF weekly closes, Jul 11, 2025 to Jul 7, 2026: EWZ (Brazil) +25.9%, EWW (Mexico) +25.3%, EPOL (Poland) +23.9%, TUR (Turkey) +18.8%, FXI (China) -11.0%, INDA (India) -9.9%, EIDO (Indonesia) -32.6% with a low of $11.23 in June 2026.
[6] Lead-Lag Report market data, DXY (US Dollar Index) weekly closes: 104.88 (Jul 5, 2024), 97.14 (Jul 6, 2025), 101.17 (Jun 28, 2026), 100.72 (Jul 7, 2026).
[7] International Monetary Fund, World Economic Outlook, April 2026, “Global Economy in the Shadow of War.” Global growth 3.1% (2026), 3.2% (2027); EMDE growth 3.9% (2026) vs 4.2% January estimate. https://www.imf.org/en/publications/weo/issues/2026/04/14/world-economic-outlook-april-2026
[8] IMF WEO April 2026, Chapter 1. Middle East and Central Asia growth cut to 1.9%; Qatar -8.6%, Iraq -6.8%, Iran -6.1%. https://www.imf.org/-/media/files/publications/weo/2026/april/english/ch1.pdf
[9] IMF WEO April 2026, Statistical Appendix Table A. China 4.4% (2026); India 6.5% (2026); Brazil 1.9% (2026); Mexico 1.6% (2026) and 2.2% (2027). https://www.imf.org/-/media/files/publications/weo/2026/april/english/tablea.pdf
[10] Reuters, “Brazil central bank cuts rates third straight meeting by 25 bps,” Jun 17, 2026, Selic to 14.25%. https://www.reuters.com/world/americas/brazil-central-bank-cuts-rates-third-straight-meeting-by-25-bps-2026-06-17/ ; Rio Times, “Brazil Interest Rate Cut,” Mar 19, 2026. https://www.riotimesonline.com/brazil-interest-rate-cut-selic-copom-march-2026/
[11] Reuters, “Bank of Mexico cuts benchmark interest rate to 6.50% in split vote,” May 7, 2026. https://www.reuters.com/world/americas/bank-mexico-cuts-benchmark-interest-rate-650-split-vote-2026-05-07/ ; Bloomberg, “Mexico Holds Key Interest Rate at 6.5% After Two Years of Cuts,” Jun 25, 2026. https://www.bloomberg.com/news/articles/2026-06-25/mexico-holds-key-interest-rate-at-6-5-after-two-years-of-cuts ; WSJ, “Bank of Mexico Ends Easing Cycle With Interest-Rate Cut.” https://www.wsj.com/economy/central-banking/bank-of-mexico-ends-easing-cycle-with-interest-rate-cut-baa52f64
[12] VanEck, JPMorgan EM Local Currency Bond ETF (EMLC) fact sheet, 30-day SEC yield 6.16% as of Jul 6, 2026. https://www.vaneck.com/us/en/investments/jp-morgan-em-local-currency-bond-etf-emlc/
[13] State Street Global Advisors, “Emerging Market Debt Outlook,” Jan 2026. EMBI Global Diversified +14.3% (2025), HY sovereigns +17.0%; GBI-EM Global Diversified +19.3% (2025). https://www.ssga.com/us/en/institutional/insights/emerging-market-debt-outlook-jan-2026
[14] Lead-Lag Report market data, weekly closes, Jul 2025 to Jul 2026: CPER (copper) +17.7%, DBC (broad commodities) +22.0%, GSG (broad commodities) +29.3%.
[15] UNCTAD, World Investment Report 2026 data note. Global FDI $1.6 trillion in 2025 (+14%); developed-economy FDI +43% to $728B; developing-economy FDI -2% to $877B. https://unctad.org/system/files/official-document/diaeiainf2026d1_en.pdf
[16] UNCTAD World Investment Report 2026. Brazil FDI +42% to $89B; India FDI +73% to $47B; China FDI -8% (third consecutive annual decline) to $107.5B. https://unctad.org/system/files/official-document/diaeiainf2026d1_en.pdf
[17] Reuters, “Portfolio flows to emerging markets slow to $22 billion in February, says IIF,” Mar 10, 2026. January 2026 inflows $100.5B; February $21.7B ($14.3B debt, $7.4B equity). https://www.reuters.com/world/china/portfolio-flows-emerging-markets-slow-22-billion-february-says-iif-2026-03-10/
[18] MSCI, “EM gains but discount to developed markets deepens.” https://www.msci.com/indexes/markets-in-motion/visualizations/em-gains-but-discount-to-developed-markets-deepens ; Yahoo Finance, “Emerging Markets Rise 16% in 2026, Outpacing S&P 500 by Wide Margin,” Apr 28, 2026. https://finance.yahoo.com/markets/world-indices/articles/emerging-markets-rise-16-2026-150031525.html
[19] Bloomberg, “Emerging-Market Assets Rally on Iran War Resolution Bets,” Apr 14, 2026, on flow and sentiment dynamics into EM funds. https://www.bloomberg.com/news/articles/2026-04-14/emerging-market-assets-rally-on-iran-war-resolution-bets
The Lead-Lag Report is provided by Lead-Lag Publishing, LLC. All opinions and views mentioned in this report constitute our judgments as of the date of writing and are subject to change at any time. Information within this material is not intended to be used as a primary basis for investment decisions and should also not be construed as advice meeting the particular investment needs of any individual investor. Trading signals produced by the Lead-Lag Report are independent of other services provided by Lead-Lag Publishing, LLC or its affiliates, and positioning of accounts under their management may differ. Please remember that investing involves risk, including loss of principal, and past performance may not be indicative of future results. Lead-Lag Publishing, LLC, its members, officers, directors and employees expressly disclaim all liability in respect to actions taken based on any or all of the information on this writing.