

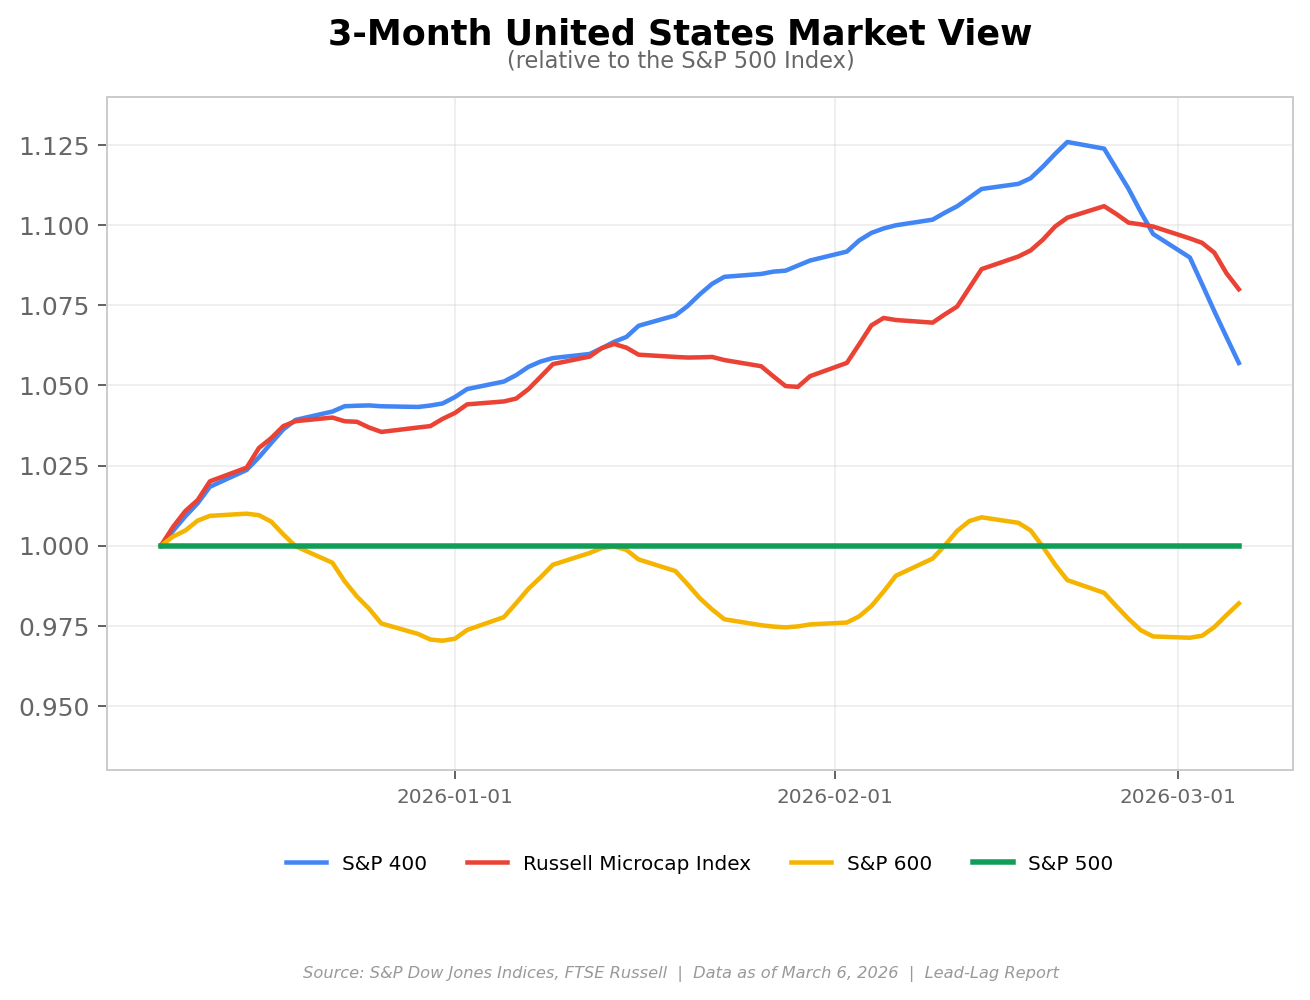
Two days ago I wrote about the small-cap rotation being real. It still is, but the market just threw a curveball that complicates the story considerably. The Russell Microcap Index remains up roughly 8% year-to-date. The S&P 400 is up about 5.7%. The Russell 2000 is holding a 4.2% gain. Meanwhile, the S&P 500 is essentially flat on the year at − 0.22%. That relative outperformance in smaller names has not been erased. But the Iran conflict and today’s disastrous jobs report have injected a level of uncertainty that could either accelerate or completely derail the rotation depending on what the Fed does next.
Let me start with the number that matters most right now. February nonfarm payrolls came in at negative 92,000. Not positive 50,000, which is what the consensus was. Not even zero. Negative 92,000. And if that’s not enough, December was revised down to negative 17,000 from an already-weak 48,000. January was revised down 4,000 to 126,000. The combined revision is negative 69,000 jobs. The unemployment rate ticked up to 4.4% from 4.3%, and average hourly earnings came in hot at 3.8% year-over-year. Health care lost 28,000 jobs on strike activity. Federal government shed another 10,000. This is a labor market that is cracking in real time.
Now layer in the oil picture. WTI crude is at $80 per barrel as I write this, up over 20% in a single week since the U.S.-Israel strikes on Iran began. Brent is above $84. The Strait of Hormuz has effectively been closed for six days, which accounts for roughly 20% of the world’s oil and gas supply. The ISM Manufacturing Prices Paid index hit 70.5% in February, the highest since June 2022, and that was before the latest oil spike fully filtered through. Core PCE was already running at 3.0% in December. The energy sector is up 26% year-to-date while the software sub-sector of the S&P 500 is down roughly 17%. The divergence is breathtaking. And it puts the Fed in an impossible position. You cannot cut into rising inflation. You cannot hike into a labor market that just printed a negative payroll number. This is what stagflation looks like in practice, and it’s why the market has pushed the next expected rate cut all the way out to September.
Despite what has been an awful week for risk assets globally, European equities are still outperforming the S&P 500 by 300 to 500 basis points on the year. The STOXX 600 is up about 1.4% year-to-date even after falling nearly 5% this week, its worst weekly decline since April 2025. To put that in context, the STOXX 600 hit an all-time high of 634 on February 27, the day before the Iran strikes began. Europe has given back the late-February surge but the structural outperformance story remains intact. Germany’s €500 billion infrastructure fund is now into its implementation phase, with defense spending at roughly €108 billion in 2026, the highest since the Cold War ended. Goldman Sachs is projecting 1.1% GDP growth for Germany this year, which doesn’t sound like much until you remember the country had six consecutive years of stagnation. The ECB has held at 2.0% for five straight meetings and the March 19 decision is a 99% probability hold. Eurozone headline inflation ticked up to 1.9% in February from 1.7% in January, and the Iran oil shock has made any near-term cut a non-starter.
