The Fed Just Told You There Are No Rate Cuts Coming. Here’s How To Build Your Own.
How a Daily 0DTE Covered Call Strategy on the Nasdaq-100 Can Turn a Hawkish Fed and a Tech-Vol Spread Into a Daily Paycheck

Key Highlights
· The Federal Reserve (Fed) held rates at 3.50–3.75% on June 17, 2026, removed the cut bias from its statement, and the dot plot now suggests a hike is more likely than a cut before year-end.
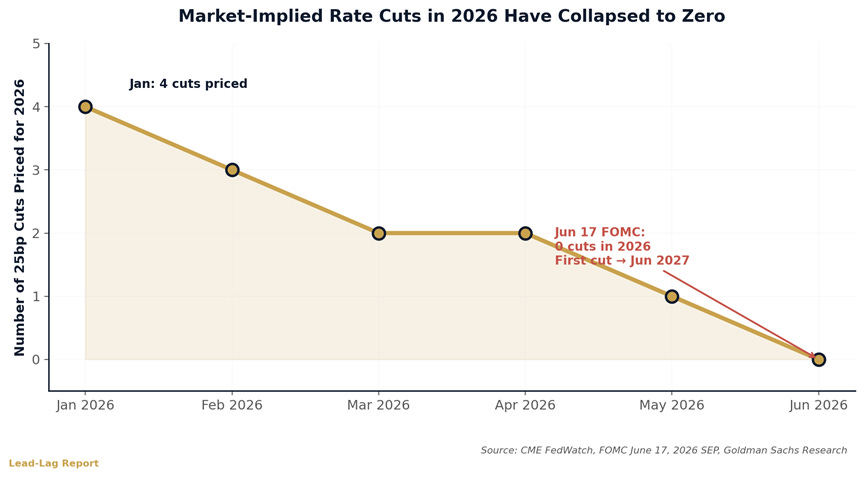
· Goldman Sachs Research has pushed its first projected rate cut to June 2027 — eighteen months from now — with the second following in December 2027.
· Headline CPI hit 4.2% in May 2026, the highest reading since April 2023, driven by sticky services inflation and energy-price pass-through from the Iran conflict.
· The Nasdaq-100 VIX is trading at 26.95 while the S&P 500 VIX sits at 17.68 — one of the widest tech-versus-broad vol spreads of the cycle.
· The TappAlpha Innovation 100 Growth & Daily Income ETF (TDAQ) uses a daily 0DTE covered call strategy on the Nasdaq-100 — and the spread between tech vol and broad vol is exactly the kind of premium environment the strategy is built to harvest.
Today, Kevin Warsh chaired his first Federal Open Market Committee (FOMC) meeting as Federal Reserve Chairman. The Committee held the federal funds rate steady at 3.50–3.75%, a level unchanged since late 2025. (CNBC) The substantive news was not the hold. It was what came out of the statement and the dot plot.
The previous cutting bias — language that had quietly signaled the next move was lower — was removed. The dot plot’s median path now suggests the federal funds rate ends 2026 at roughly 3.8%, above current levels, implying a hike is now considered more probable than a cut over the back half of the year. (CNBC) Goldman Sachs Research has responded by pushing its first projected cut to June 2027, with the second to December 2027. (MEXC)
For income investors, this is the death of a trade many had quietly been waiting on: the one where the Fed cuts, bond prices rise, and yield-starved portfolios get rescued by duration. That trade is now an eighteen-month wait, at minimum. Which raises the question every advisor running income mandates is asking this week: if the Fed isn’t coming, where does the income actually come from?
The answer this advertorial proposes is uncomfortable and structural. It does not come from waiting for cuts. It comes from monetizing the very thing a hawkish-Fed-meets-sticky-inflation regime produces in abundance: volatility. And it comes from monetizing it where the premium is richest — which, right now, is in tech.
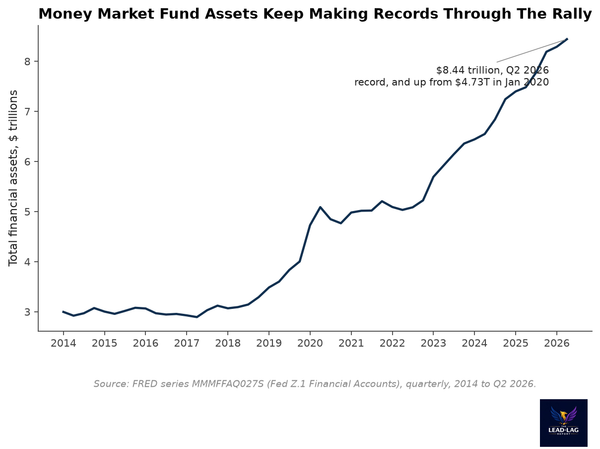
The Income Math Just Got Worse
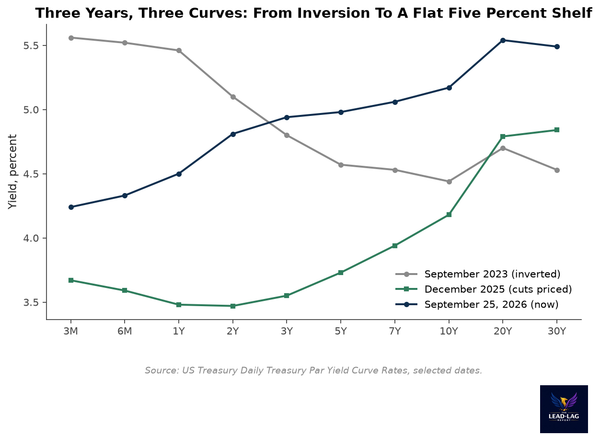
The S&P 500’s dividend yield sits at roughly 1%, one of the lowest readings in three decades. (Multpl) The Nasdaq-100’s dividend yield is lower still — closer to 0.5% — because the mega-cap technology companies that dominate the index reinvest cash rather than distribute it. Ten-year Treasuries are now yielding 4.43%, up from 4.13% in mid-April. (Morningstar)
That last number is the one that matters most for the income arithmetic. Yields have risen, not fallen, since the start of the year. Bond prices have moved in the other direction. An income investor who shifted into long-duration Treasuries six months ago expecting the Fed to ride to the rescue is now sitting on a markdown — and a Fed that, today, told the market the rescue isn’t coming.
Meanwhile, May 2026 CPI came in at 4.2%, the highest reading since April 2023, with energy prices passing through from the Iran conflict and services inflation refusing to cooperate. (CNBC, BLS) That is the mechanical reason the Fed cannot cut. And it is also the mechanical reason this Fed cycle is structurally different from anything investors have experienced since the early 1990s. Higher-for-longer is no longer a forecast. It is a regime.
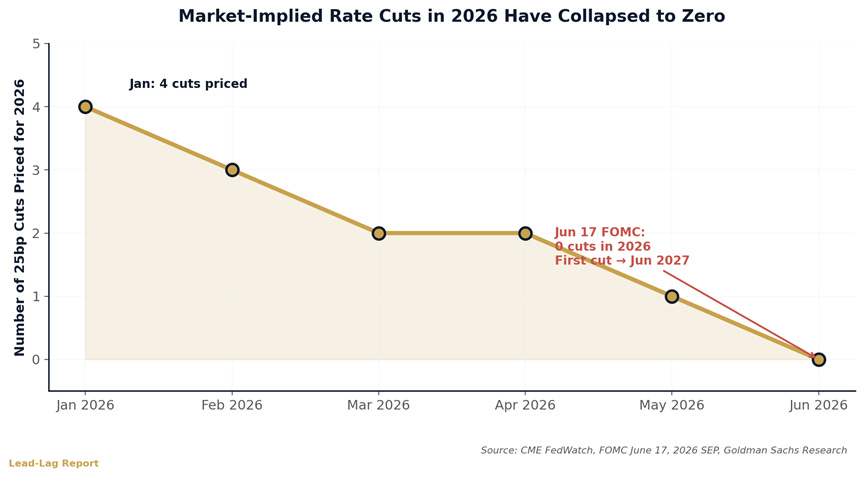
Figure 1: Fed rate cut expectations collapse
Figure 1: The path that wasn’t — market-implied rate cut expectations have collapsed from four cuts in 2026 to zero, with the first cut now projected for June 2027.
Where the Premium Actually Is
Volatility, like everything else in markets, has a term structure and a cross-section. And right now, the cross-section is telling income investors something specific.
The broad-market VIX closed at 17.68 on June 16. (FRED) That is a calm reading by historical standards — well inside the 12–20 “MID” band that has dominated the last two years. The Iran ceasefire took the edge off the early-June spike, and the market has digested the Fed hold with notable composure.
But the Nasdaq-100 VIX — the volatility index for the tech-heavy index — closed at 26.95 on June 16. (YCharts) That is a 27.79% increase versus one year ago, and it represents a roughly 9-point spread over the broad-market VIX.
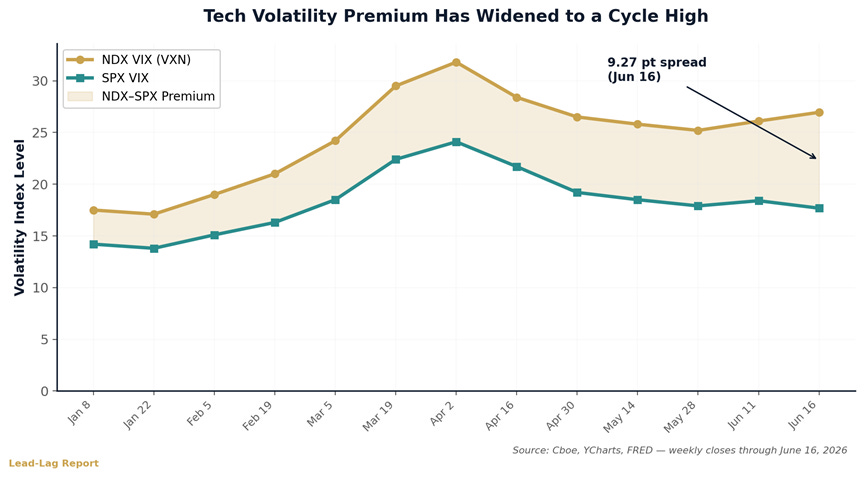
Figure 2: NDX VIX vs SPX VIX spread widens
Figure 2: NDX VIX vs SPX VIX — the spread has widened from ~3 points at the start of 2026 to over 9 points in mid-June, reflecting concentrated risk pricing in mega-cap technology.
That spread is not noise. It reflects something specific the options market is pricing: AI capex skepticism, mega-cap concentration risk, and earnings-driven dispersion that is far more concentrated in tech names than in the broader index. When the Nasdaq-100 VIX trades 50% richer than the S&P 500 VIX, options sellers on the Nasdaq are being paid materially more per unit of underlying exposure than options sellers on the broad index.
This is the structural setup. A hawkish Fed sustains the volatility regime. The Iran-related tail risk lingers. And the Nasdaq-100, with its concentrated mega-cap composition and its AI-capex-driven dispersion, is the part of the market where the volatility risk premium is currently richest. For investors with a strategy designed to harvest that premium, the spread is a windfall.
The Mechanic, Briefly
Zero-days-to-expiration options — 0DTE — are no longer exotic. SPX 0DTE contracts averaged 2.3 million per day in 2025 and represented 59% of total S&P 500 options volume, up from roughly 5% in 2016. (Cboe Global Markets) The same structural shift has
occurred on the Nasdaq side. Daily-expiry options are the baseline of how the largest options markets in the world now function.
The appeal of 0DTE for income generation comes down to theta decay. A call option that expires at the close of the same trading day it is written delivers the maximum possible rate of time decay to the seller. That is the mechanical engine.
Each morning, the strategy resets. Each evening, the options expire. The premium collected becomes income. The next day, it begins again.
The daily cadence does three things. It minimizes overnight options-book risk — yesterday’s calls have already expired by the time the next gap opens. It allows constant recalibration to the new level — if the Nasdaq drops 3% in a session, the next day’s calls are written at the new lower strike. And it converts what would otherwise be a single monthly income event into a continuous stream that compounds across the harvest window.
Why This Fed Cycle Favors Premium Harvest
A premium-collection strategy does not need rate cuts to work. It needs volatility. And we believe the conditions producing that volatility right now are durable, not transient.
Consider what would need to change for the volatility regime to compress meaningfully. The Fed would need to either cut decisively — which Goldman now projects no earlier than June 2027 — or signal a return to a clearly accommodative posture. Inflation would need to break decisively below the Fed’s 2% target — a five-year journey at the current trajectory, not a five-month one. The Iran situation would need to resolve into a durable peace rather than a fragile ceasefire. And AI capex skepticism — the central pricing question for the mega-cap tech complex — would need to resolve one way or the other, in either direction.
None of those are this year’s stories. They are 2027 or 2028 stories. Which means the volatility risk premium that funds the daily 0DTE harvest is structurally supported for the foreseeable horizon.
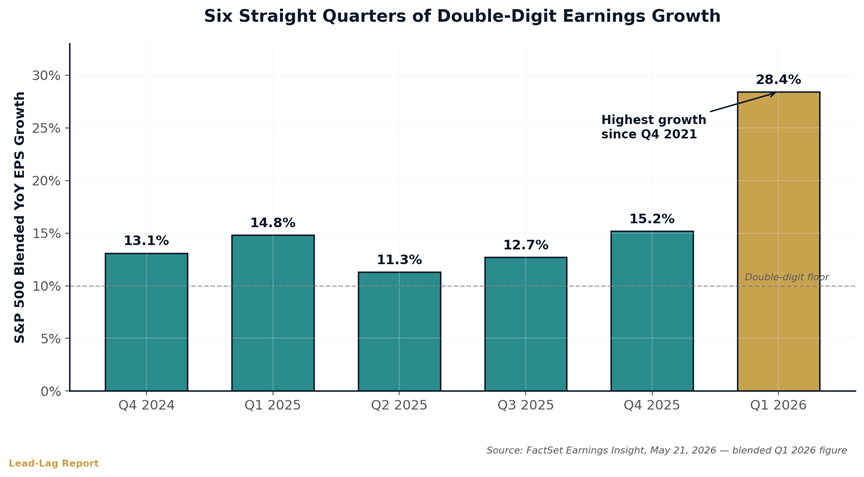
Figure 3: S&P 500 quarterly earnings growth
Figure 3: S&P 500 Q1 2026 earnings grew 28.4% on a blended basis — the sixth consecutive quarter of double-digit growth and the strongest reading since Q4 2021. The underlying index has a fundamental floor even as the volatility regime stays elevated. (FactSet)
This is the case that distinguishes the current moment from prior covered-call cycles. In 2018–2021, premium-harvest strategies struggled because volatility was structurally compressed by an accommodative Fed and low-inflation regime. In 2022–2023, they outperformed because the regime flipped. In 2024–2025, they delivered steady income because volatility settled into a middle band. The 2026 setup — hawkish Fed, sticky inflation, geopolitically-driven energy shocks, AI-capex dispersion — is the structural cousin of 2022. Except now the products built to harvest it are mature, transparent, and listed.
The Trade-Offs You Need to Understand
No strategy is a free lunch. A covered call program caps upside participation. If the Nasdaq-100 surges 5% in a single day on a Fed pivot, an AI earnings surprise, or a peace deal, TDAQ’s calls will limit the fund’s participation in that move. In a relentless momentum-driven bull market, an unhedged QQQM position will outperform TDAQ over time.
But “relentless momentum-driven bull market” is precisely what this Fed just made less likely for the back half of 2026. A hawkish Federal Reserve removing its cut bias, a dot plot pointing to a possible hike, and inflation running at 4.2% are not the conditions that produce relentless one-direction rallies. They are the conditions that produce chop, dispersion, and elevated volatility — the conditions in which the upside cap of a covered call strategy is the cheapest form of compromise an income investor can make.
And the Q1 2026 earnings season — the sixth consecutive quarter of double-digit growth on a blended basis, the strongest reading since Q4 2021 — tells you the underlying companies are not in trouble. The volatility being priced in the Nasdaq-100 VIX is not distress. It is dispersion. The two are very different things, and only one of them is sellable. Because TDAQ’s underlying holding is QQQM, the fund inherits all of the Nasdaq-100’s characteristics: heavy concentration in information technology (~50%), communications services (~17%), and consumer discretionary (~12%). It is not a replacement for diversification. It is a complement that maintains Nasdaq-100 growth participation while generating a cash-flow stream that does not depend on the index rising.
Drawdown risk is real. If the Nasdaq-100 falls 10% in a sustained sell-off, TDAQ will participate substantially in that drawdown, only partially offset by the premium collected during the period. The strategy is not a hedge. It is an income overlay on a Nasdaq-100 exposure.
Where TDAQ Fits in a Portfolio
TDAQ is best understood as an allocation decision rather than a trade. For income-oriented investors — retirees, those in the distribution phase, anyone drawing down a portfolio — it offers a structural source of cash flow tied to the Nasdaq-100 without requiring the index to rise. For growth-oriented investors, it can serve as a yield-enhancement sleeve within a broader tech allocation, generating income that partially offsets drawdowns during corrective periods and can be reinvested or used to rebalance into lagging parts of the market.
With approximately $234 million in AUM as of mid-June 2026 — nearly double its mid-April level — and listing on the Cboe since its September 2025 inception, TDAQ has crossed the size threshold where institutional and advisor allocators begin to consider new strategies. (Robinhood) The TappAlpha platform as a whole crossed $500 million in AUM in May 2026, doubling in four months. (GlobeNewswire) The fund’s three-holding structure — overwhelmingly QQQM with a small cash position and the daily options book — keeps the strategy transparent and explainable, which matters more in a regime where the underlying drivers of return are themselves complex.
The Bigger Picture
The Federal Reserve told the market today, with the clearest signal it has sent all year, that it does not intend to deliver the rate cuts the market spent twelve months pricing in. Goldman now projects the first cut eighteen months out. Inflation is running at 4.2%. The Nasdaq-100 VIX is at 26.95. The volatility risk premium is one of the few structural inefficiencies left at scale in the listed-product universe — and it is currently richest in tech.
The investors who navigate this environment most effectively are not the ones waiting for the Fed to come back. They are the ones who recognize that a hawkish Fed, in a 4.2% inflation regime, with concentrated tech-vol pricing, is not the absence of an income opportunity. It is the structural condition that makes the opportunity possible.
A daily 0DTE covered call strategy on the Nasdaq-100 does not require you to be right about when the Fed cuts, whether AI capex pays off, or how the next Iran-related escalation resolves. It requires only that you are willing to trade some upside for a consistent income stream — and that volatility, the very thing the Fed’s posture just guaranteed will stick around, keeps doing its job.
The Fed just told you there are no rate cuts coming. With TDAQ, you don’t need them to.
Disclosure:
This content is sponsored by TappAlpha. The Lead-Lag Report has been compensated for the publication of this material. The views and opinions expressed herein are those of the author and do not necessarily reflect the views of TappAlpha or its affiliates.
This material is for informational and educational purposes only and should not be construed as investment advice or a recommendation to buy, sell, or hold any securities, including TDAQ.
The fund currently expects, but does not guarantee, to make distributions on a monthly basis. Distributions may exceed the fund’s income and gains for the taxable year. Distributions in excess of the fund’s current and accumulated earnings and profits will be treated as a return of capital.
Investors should carefully consider the investment objectives, risks, charges and expenses of the ETFs identified on this site. This and other important information about the Fund are contained in the prospectus, which can be obtained on this site or by calling (844) 403-2888. The prospectus should be read carefully before investing.
Please click here for the prospectus:
https://cdn.prod.website-files.com/659c04f60051914529d01524/69a72d03b4013 4867ab95421_TappAlpha%20Prospectus%204.30.2025%2C%20%20sticker%2020 26.03.02.pdf
The performance data quoted represents past performance. Past performance does not guarantee future results. The investment return and principal value of an investment will fluctuate so that an investor’s shares, when sold or redeemed, may be worth more or less than their original cost and current performance may be lower or higher than the performance quoted. Performance current to the most recent month-end can be obtained above. Returns less than one year are not annualized.
Short term performance, in particular, is not a good indication of the fund’s future performance, and an investment should not be made based solely on returns. The Fund does not have a track record of reporting to investors or widely available research coverage which may result in price volatility.
Market performance is the price at which shares in the ETF can be bought or sold on the exchanges during trading hours, while the net asset value (NAV) represents the value of each share’s portion of the fund’s underlying assets and cash at the end of the trading day.
Click here for standardized performance: https://www.tappalphafunds.com/etfs/tdaq
Investing involves risk. Principal loss is possible. The Fund’s shares will change in value, and you could lose money by investing in the Fund. The Fund may not achieve its investment objectives. The Fund invests in options contracts that are based on the value of the Index. This subjects the Fund to certain of the same risks as if it owned shares of companies that comprised the Index, even though it does not own shares of companies in the Index. The Fund will have exposure to declines in the Index. The Fund is subject to potential losses if the Index loses value, which may not be offset by income received by the Fund. By virtue of the Fund’s investments in options contracts that are based on the value of the Index, the Fund may also be subject to an indirect investment risk, an index trading risk & a Nasdaq 100 Index Risk.
The Nasdaq-100® Index is a widely recognized benchmark index that tracks the performance of 100 of the largest non-financial companies listed on the Nasdaq Stock Market, including NDX and XND options. These companies represent a broad range of industries, with a notable concentration in technology-related sectors. The Index is market-capitalization weighted and includes companies across sectors such as information technology, consumer discretionary, communication services, healthcare, and industrials. As of December 31, 2023, the five largest sectors in the Index were information technology, consumer discretionary, communication services, healthcare, and industrials. The composition of the Index can change over time due to market capitalization shifts, periodic rebalancing, and company eligibility changes.
Regarding volatility, the Nasdaq-100® Index, like all market indices, has experienced periods of significant daily price movements. Its higher concentration in growth-oriented and technology-related companies can contribute to greater short-term volatility compared to more diversified indices. Despite these fluctuations, the Index has demonstrated strong long-term performance over its history.
Due to the short time until their expiration, 0DTE options are more sensitive to sudden price movements and market volatility than options with more time until expiration. Because of this, the timing of trades utilizing 0DTE options becomes more critical. Even a slight delay in the execution of 0DTE trades can significantly impact the outcome of the trade. 0DTE options may also suffer from low liquidity, making it more difficult for the Fund to enter into its positions each morning at desired prices. The bid-ask spreads on 0DTE options can be wider than with traditional options, increasing the Fund’s transaction costs and negatively affecting its returns. These risks may negatively impact the performance of the fund.
As of the date of this prospectus, the Fund has no operating history and currently has fewer assets than larger funds. Like other new funds, large inflows and outflows may impact the Fund’s market exposure for limited periods of time. This impact may be positive or negative, depending on the direction of market movement during the period affected.
Distributor: Foreside Fund Services, LLC, Member FINRA.
Definitions
The following plain-language definitions are provided for terms used above. They are general descriptions and are not part of the Fund’s offering documents.
FOMC (Federal Open Market Committee) — The Federal Reserve committee that sets U.S. monetary policy, including the target federal funds rate. It meets roughly eight times a year.
Dot plot — A chart released with the FOMC’s quarterly Summary of Economic Projections showing each policymaker’s expectation for the future path of the federal funds rate.
Hawkish — A monetary-policy stance that favors higher interest rates, or fewer rate cuts, to contain inflation. Its opposite, “dovish,” favors lower rates to support growth.
0DTE (zero-days-to-expiration) options — Options contracts that expire on the same trading day they are written. Because they expire within hours, they carry the fastest rate of time decay and are highly sensitive to intraday price movements.
Covered call — An options strategy in which call options are sold against an underlying holding the seller owns. The seller collects premium income in exchange for capping gains above the option’s strike price.
Theta decay — The decline in an option’s time value as it approaches expiration. Option sellers seek to capture this decay, which is fastest in the final day of an option’s life.
VIX / Nasdaq-100 VIX — Market-based gauges of expected near-term volatility derived from index option prices. The VIX reflects expected S&P 500 volatility; the Nasdaq-100 VIX (VXN) reflects expected Nasdaq-100 volatility.
AI capex (artificial-intelligence capital expenditure) — Large, ongoing spending by major technology companies on data centers, chips, and related infrastructure to build AI capabilities. Uncertainty about the returns on this spending is a key driver of tech-sector volatility.
Blended basis (earnings) — An earnings-growth figure that combines actual reported results for companies that have already reported with estimates for those that have not yet reported.
QQQM — The Invesco NASDAQ-100 ETF, which seeks to track the Nasdaq-100 Index. It is the underlying equity holding of TDAQ.
DISCLAIMER – PLEASE READ: This is a sponsored article for which Lead-Lag Publishing, LLC has been paid a fee. Lead-Lag Publishing, LLC does not guarantee the accuracy or completeness of the information provided in the article or make any representation as to its quality. All statements and expressions provided in this article are the sole opinion of TappAlpha and Lead-Lag Publishing, LLC expressly disclaims any responsibility for action taken in connection with the information provided in the discussion. The content in this writing is for informational purposes only. You should not construe any information or other material as investment, financial, tax, or other advice. A participant may have taken or recommended any investment position discussed, but may close such position or alter its recommendation at any time without notice. Nothing contained in this article constitutes a solicitation, recommendation, endorsement, or offer to buy or sell any securities or other
financial instruments in any jurisdiction. Please consult your own investment or financial advisor for advice related to all investment decisions.
Footnotes / Sources:
1. Federal Reserve FOMC, “Federal Reserve issues FOMC statement,” June 17, 2026.
2. CNBC, “Fed holds rates steady, pares down statement to remove cutting bias,” June 17, 2026.
3. MEXC / Goldman Sachs Research, “Goldman Sachs Research now projects no Federal Reserve rate cuts in 2026,” June 2026.
4. Federal Reserve Bank of St. Louis (FRED), CBOE Volatility Index (VIXCLS), observation for June 16, 2026.
5. YCharts, NASDAQ-100 VIX (I:NASDAQ10), observation for June 16, 2026.
6. Multpl, S&P 500 Dividend Yield by Month, June 2026.
7. Morningstar / Dow Jones, “10-Year Treasury Yield Falls to 4.427%,” June 16, 2026.
8. Cboe Global Markets, “The State of the Options Industry: 2025.”
9. TappAlpha, TDAQ Fund Page, June 16, 2026.
10. Robinhood, TDAQ AUM data, June 16, 2026.
11. TappAlpha / GlobeNewswire, “Growth + Income Emerges as a Category: TappAlpha Crosses $500M AUM,” May 12, 2026.
12. FactSet, “Earnings Insight,” May 21, 2026 — Q1 2026 blended growth 28.4%.
13. CNBC, “Consumer prices rose 4.2% in May, higher than expected on energy and shelter,” June 10, 2026.
14. U.S. Bureau of Labor Statistics, “Consumer Price Index – May 2026,” June 10, 2026.
DISCLAIMER – PLEASE READ: This is a sponsored article for which Lead-Lag Publishing, LLC has been paid a fee. Lead-Lag Publishing, LLC does not guarantee the accuracy or completeness of the information provided in the article or make any representation as to its quality. All statements and expressions provided in this article are the sole opinion of TappAlpha and Lead-Lag Publishing, LLC expressly disclaims any responsibility for action taken in connection with the information provided in the discussion. The content in this writing is for informational purposes only. You should not construe any information or other material as investment, financial, tax, or other advice. A participant may have taken or recommended any investment position discussed, but may close such position or alter its recommendation at any time without notice. Nothing contained in this article constitutes a solicitation, recommendation, endorsement, or offer to buy or sell any securities or other financial instruments in any jurisdiction. Please consult your own investment or financial advisor for advice related to all investment decisions.