
The Great Rotation Is Here — And FMKT Is Built for It

KEY HIGHLIGHTS
The 10-year/2-year Treasury yield spread has normalized to +0.50% as of April 10, 2026 — ending the deepest and longest yield-curve inversion since the 1980s.[1]
ISM Manufacturing PMI reached 52.7 in March 2026, signaling that the industrial economy has crossed back into expansion — a key intermarket signal for equity sector positioning.[2]
The S&P 500 fell over 5% in March 2026, its worst monthly drop since March 2025 — yet Energy (+21%), Materials (+17%), and Industrials (+12%) YTD are staging one of the most powerful sector rotations in a decade.[3]
The Dow Jones Industrial Average crossed 50,000 in February 2026, reflecting broad market participation — the first time in over a decade that the broader market is outpacing the mega-cap index heavyweights.[4]
The Free Markets ETF (Ticker: FMKT) is explicitly built for this environment — tactically rotating across sectors based on intermarket signals, favoring deregulation beneficiaries in healthcare, energy, and financials.
I have spent the better part of two decades studying the language markets use to communicate regime change — not through headlines, but through the quiet, persistent signals embedded in intermarket relationships. Yield curves. Sector relative strength. The push and pull of capital between what worked yesterday and what is beginning to work today. And right now, in the spring of 2026, every one of those signals is pointing in the same direction: we are in the middle of one of the most significant sector rotations of the post-pandemic era. The question I am asking — and I think you should be asking too — is whether your portfolio is positioned to participate in it, or whether it is still anchored to the leadership of a cycle that has already ended.
THE YIELD CURVE TELLS THE STORY FIRST
For the better part of 2022 through 2024, the 10-year/2-year Treasury yield spread was deeply inverted — the most severe inversion since Paul Volcker’s era. Inverted yield curves are not merely technical curiosities. They are the bond market’s collective verdict that short-term rates are too restrictive for the economic conditions ahead. And historically, their normalization has marked the beginning of a new equity cycle, not the end of an old one.
As of April 10, 2026, the 10Y-2Y spread has recovered to +0.50% — firmly positive for the first time in years.[1] That is not a trivial development. A positively-sloped yield curve, alongside a recovering manufacturing sector, has historically been the backdrop against which cyclical equity sectors — Energy, Materials, Industrials — generate their most powerful relative returns. The chart below tracks this normalization from its depths.
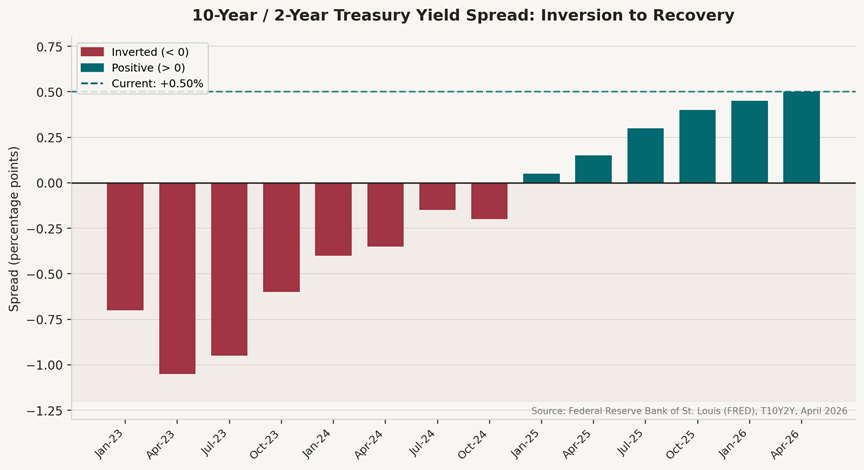
Chart 1: 10Y-2Y Treasury Yield Spread, Jan 2023–Apr 2026. Source: Federal Reserve Bank of St. Louis (FRED).
MANUFACTURING WAKES UP — AND THE MARKET FOLLOWS
The ISM Manufacturing PMI is one of the purest leading indicators I follow. It is a survey-based diffusion index — readings above 50 indicate expansion, below indicate contraction. For most of 2022 through mid-2025, manufacturing was in a grinding contractionary phase that the consensus chose to largely ignore, focused instead on the AI-driven narrative in technology stocks.
March 2026’s ISM reading of 52.7 is consequential.[2] It is not just a number above 50 — it represents a sustained multi-quarter recovery from the 46–48 range that characterized the contraction. When manufacturing expands alongside a normalizing yield curve, the historical playbook is clear: capital rotates into the sectors that power industrial activity — energy producers, raw material suppliers, transportation networks, domestic manufacturers. This is precisely the rotation we are watching unfold in real time.
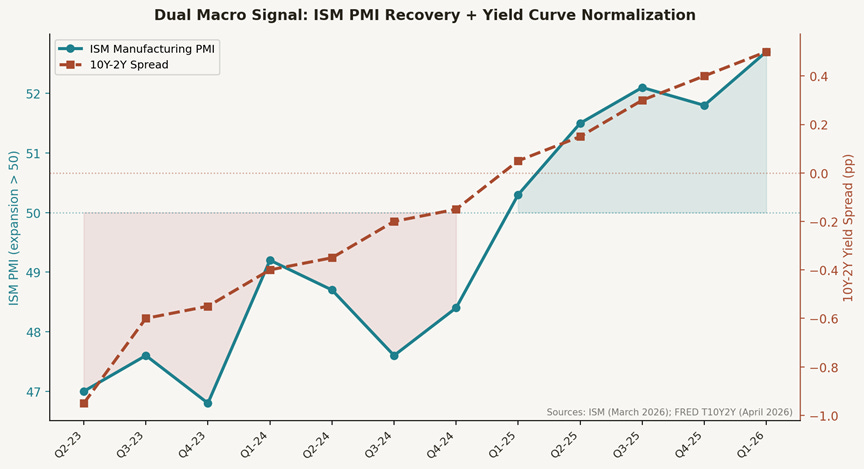
Chart 2: ISM Manufacturing PMI vs. 10Y-2Y Yield Spread, Q2 2023–Q1 2026. Sources: ISM; Federal Reserve Bank of St. Louis (FRED).
THE GREAT ROTATION IS NOT A THEORY — IT IS A DATA POINT
Let me be direct about what has happened in equity markets year-to-date in 2026. The S&P 500 fell more than 5% in March — its worst month since March 2025.[5] If you only watched the index, you might conclude the market is weak. But that conclusion would be profoundly misleading.
Beneath the cap-weighted surface, a completely different story is playing out. Energy is up approximately 21% YTD. Materials are up 17%. Industrials have gained 12%. Consumer Staples — another classic defensive rotation play — are up 15%.[3] Meanwhile, Information Technology — the sector that accounted for roughly 29% of the S&P 500’s weight — is down approximately 14% YTD. The Magnificent Seven, those mega-cap technology companies that dominated portfolio returns for three consecutive years, are underperforming in ways that are becoming impossible to dismiss as temporary.
The Dow Jones Industrial Average crossing 50,000 in February 2026 is the exclamation point.[4] The Dow — which is price-weighted and includes industrial stalwarts like Caterpillar, Chevron, and Boeing — reached that milestone in just 431 trading days after hitting 40,000. That pace of acceleration reflects a market that is broadening, not narrowing. The equal-weight S&P 500 (RSP) has consistently outperformed the cap-weighted version in this environment. This is what genuine market health looks like.
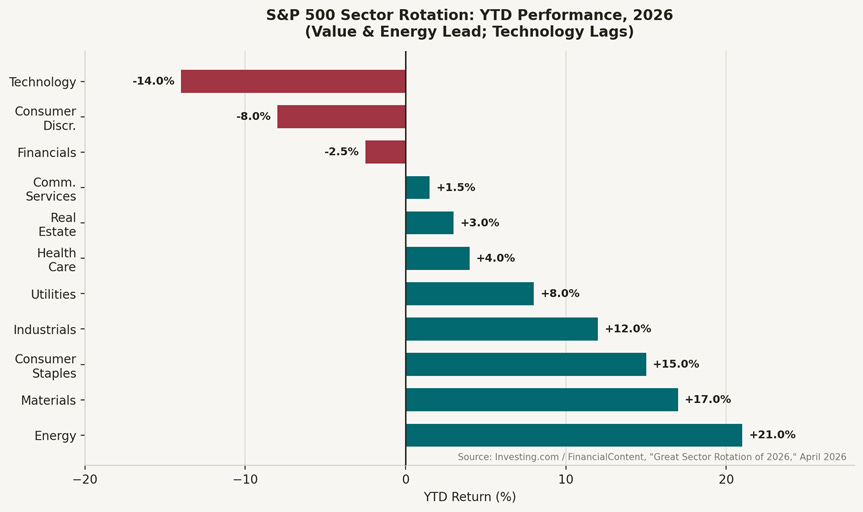
Chart 3: S&P 500 Sector YTD Returns, 2026. Sources: Investing.com; FinancialContent.
WHAT THE MARKET IS MISSING: DEREGULATION AS AN INTERMARKET SIGNAL
I want to offer a slightly different frame for what is driving this rotation — one that goes beyond the standard “reflation trade” narrative. Yes, energy prices are elevated. Yes, manufacturing is recovering. But there is a third factor at work that I think the market has not fully priced: the systematic deregulatory shift reshaping the operating environment for entire swaths of the U.S. economy.
Healthcare, financial services, and energy — sectors long burdened by regulatory complexity, compliance costs, and policy uncertainty — are seeing that burden lifted in meaningful ways. This is not a political observation. It is an economic one. When companies face lower compliance overhead, reduced barriers to entry, and clearer operational rules, their margins expand and their capital allocation improves. That is a fundamental earnings driver, and earnings drive stock prices.
The market is beginning to reprice this reality. Regional banks — freed from certain post-2008 regulatory constraints — outperformed dramatically in the early weeks of 2026.[4] Energy producers are accelerating capital programs. Healthcare companies operating in newly deregulated segments are seeing multiple expansion. These are not coincidences. They are intermarket signals that a new leadership cycle has begun.
FMKT: BUILT FOR THE CYCLE WE ARE ACTUALLY IN
The Free Markets ETF (Ticker: FMKT) was designed with precisely this kind of environment in mind. FMKT is a tactically managed equity ETF that dynamically rotates across sectors and asset classes based on intermarket signals — the same class of signals I have been discussing throughout this piece: yield curve behavior, sector relative strength, macroeconomic regime shifts.
The fund targets companies expected to benefit from deregulatory tailwinds — explicitly in healthcare, financial services, and energy. These are not random sector bets. They are the sectors where the gap between intrinsic value and current market pricing is being closed by a structural change in the operating environment. The fund is managed by Tactical Rotation Management (TRM), a registered investment adviser whose approach is grounded in intermarket analysis.
I will be honest about what FMKT is and is not. It is a new fund — launched June 2026 — with a limited operating history.[6] As of April 12, 2026, it trades at approximately $20.90, with a YTD return of approximately -3.1%.[7] The broader market has been difficult, and FMKT has not been immune to that. The fund’s expense ratio is 0.76%.[6] These are facts investors deserve to know upfront.
What I can tell you is this: the fund’s sector focus — healthcare, financials, energy — represents three of the four best-performing sectors in 2026 by YTD return. The systematic, signal-based rotation approach means FMKT can adapt as the cycle evolves. I am not suggesting past intermarket performance guarantees future results. I am suggesting that the signals underpinning this strategy are the same signals that have historically preceded the kind of sustained sector leadership we are now seeing play out.
The broader market may feel uncertain in April 2026. The S&P 500 is trading below its 50-day and 200-day moving averages.[5] Inflation is running at 3–4% and the Fed is navigating a difficult balance.[5] But uncertainty and opportunity are not opposites — they are partners. The sectors that FMKT targets are among the few places in this market that are working. And the intermarket signals suggest they may continue to work.
THE CYCLE DOES NOT WAIT FOR CONSENSUS
Here is the difficult truth about major market rotations: by the time they appear in the financial press as confirmed trends, much of the early-cycle gains have already been captured. The yield curve began normalizing months before it hit +0.50%. Manufacturing PMI crossed 50 before the consensus acknowledged a recovery. Energy stocks began outperforming while analysts were still writing about the era of cheap capital.
I ask you to consider where we are in that sequence today. The signals have been firing for months. The data — yield curve, PMI, sector performance — is now confirming what the intermarket relationships suggested earlier. The question is whether investors who are still positioned for the previous cycle are prepared to adapt, or whether they will continue to fight the tape.
Tactical rotation is not about being clever. It is about being honest with what the data is telling you. Right now, the data is telling me that cyclical, deregulation-sensitive sectors are in the early stages of a multi-year leadership cycle. FMKT was built to participate in exactly that.
Michael A. Gayed, CFA
ENDNOTES
1. Federal Reserve Bank of St. Louis, “10-Year Treasury Constant Maturity Minus 2-Year Treasury Constant Maturity (T10Y2Y),” FRED, accessed April 13, 2026, https://fred.stlouisfed.org/series/T10Y2Y
2. Trading Economics, “United States ISM Manufacturing PMI,” accessed April 13, 2026, https://tradingeconomics.com/united-states/business-confidence
3. Lance Roberts, “Sector Rotation Intensifies: Value Outperforms Growth in 2026 Market Split,” Investing.com, February 16, 2026, https://www.investing.com/analysis/sector-rotation-intensifies-value-outperforms-growth-in-2026-market-split-200675093
4. “The Great Rotation: Market Breadth Surges as Dow Hits 50,000 Milestone,” FinancialContent / MarketMinute, April 7, 2026, https://markets.financialcontent.com/stocks/article/marketminute-2026-4-7-the-great-rotation-market-breadth-surges-as-dow-hits-50000-milestone
5. “S&P 500 Technical Outlook April 2026: Navigating the Moving Average Resistance,” Valley City Times-Record / MarketMinute, April 7, 2026, https://business.times-online.com/times-online/article/marketminute-2026-4-7-s-and-p-500-technical-outlook-april-2026-navigating-the-moving-average-resistance
6. The Free Markets ETF, Fund Overview and Disclosures, accessed April 13, 2026, https://freemarketsetf.com
7. The Free Markets ETF (FMKT), Yahoo Finance, accessed April 13, 2026, https://finance.yahoo.com/quote/FMKT/performance/
DISCLOSURES
The Free Markets ETF (FMKT) invests in equity securities of companies that the fund’s investment sub-advisers expect to benefit from shifts in the regulatory environment that are supportive of free market dynamics. These investments may include companies operating in segments of the economy currently burdened by high levels of regulation, such as the healthcare, financial services, and energy sectors, where the Sub-Advisers anticipate regulatory relief.
Investing involves risk, including possible loss of principal. The Fund’s strategy of investing in companies that may benefit from deregulatory measures entails significant risks, including those stemming from the unpredictable nature of regulatory trends. Deregulation is influenced by political, economic, and social factors, which can shift rapidly and in unforeseen directions.
The Fund invests in equity securities which may be more volatile than other asset classes. The Fund is actively managed and may experience high portfolio turnover. The Fund is new with limited operating history. Although its principal has significant experience managing ETFs and other investment companies, TRM is a newly registered investment adviser and has not previously served as an adviser or sub-adviser to an investment company.
The Fund may invest up to 5% of its net assets in U.S.-listed exchange-traded products seeking exposure to Bitcoin or Ether. The Fund does not invest directly in Bitcoin, Ether, or any other Digital Assets.
As with all ETFs, Fund shares may be bought and sold in the secondary market at market prices. The market price normally should approximate the Fund’s net asset value per share (NAV), but the market price sometimes may be higher or lower than the NAV. There are a limited number of financial institutions authorized to buy and sell shares directly with the Fund, and there may be a limited number of other liquidity providers in the marketplace. Low trading activity may result in shares trading at a material discount to NAV.
The performance data quoted represents past performance and is no guarantee of future results. Investment return and principal value of an investment will fluctuate so that an investor’s shares, when redeemed, may be worth more or less than their original cost. Current performance may be lower or higher than the performance data quoted.
Holdings are subject to change.
Investors should consider the investment objectives, risks, charges and expenses carefully before investing. For a prospectus or summary prospectus with this and other information about the Fund, please call 855-994-4004 or visit our website at www.freemarketsetf.com. Read the prospectus or summary prospectus carefully before investing.
The Free Markets ETF is distributed by Foreside Fund Services, LLC.
Lead-Lag Publishing, LLC is not an affiliate of Tidal/Toroso or ACA/Foreside.
Learn more about $FMKT at https://freemarketsetf.com