
The Inflection Point Nobody Wants to Call
Signals are split evenly between offense and defense, pointing to a market at an inflection point.

Today’s Lead-Lag Report post is sponsored by GraniteShares

Volatility has been anything but linear this year, and advisors are increasingly asking the same question: how do you generate income when the fixed-income playbook keeps rewriting itself and covered-call yields keep compressing?
In that environment, autocallable strategies have moved from a niche structured-product corner of the market into something advisors are actively studying and allocating to — and that’s why I’m sitting down tomorrow with Matt Lamb, CAIA, Portfolio Consultant at GraniteShares, for a live conversation on what these strategies actually do, where they fit, and where they don’t.
Register here → https://us06web.zoom.us/webinar/register/WN_0PuKp0TuQtyT2Kiq_lEL7Q
What we’ll cover
· How autocallable structures actually work — the mechanics behind the yield, in plain English
· The tradeoff matrix — autocallables vs. covered calls, buffered ETFs, and traditional fixed income
· GraniteShares’ YieldBOOST autocallable lineup, including ANV and TLA
· Regime fit — positioning autocallables across different volatility and rate environments
· Live Q&A with Matt Lamb
The details
· When: Tomorrow, Wednesday, July 15 · 2:00–3:00 PM ET
· Where: Live Zoom Webinar (registration required)
· Cost: Free
· CE Credit: CFP Board approved · 1.0 hour — CFP® professionals attending live can earn CE. CFP IDs will be collected post-webinar for batch submission.
· Format: 60 minutes, live, with audience Q&A
Reserve your spot → https://us06web.zoom.us/webinar/register/WN_0PuKp0TuQtyT2Kiq_lEL7Q
Can’t make it live? Register anyway — we’ll send the replay to every registrant.
DISCLAIMER — PLEASE READ: This is sponsored advertising content for which Lead-Lag Publishing, LLC is being paid a fee. The information provided is solely the creation of Figure. Lead-Lag Publishing, LLC does not guarantee the accuracy or completeness of the information provided or make any representation as to its quality. All statements and expressions provided are the sole opinion of Figure and Lead-Lag Publishing, LLC expressly disclaims any responsibility for action taken in connection with the information provided.
The Inflection Point Nobody Wants to Call
SIGNAL SUMMARY
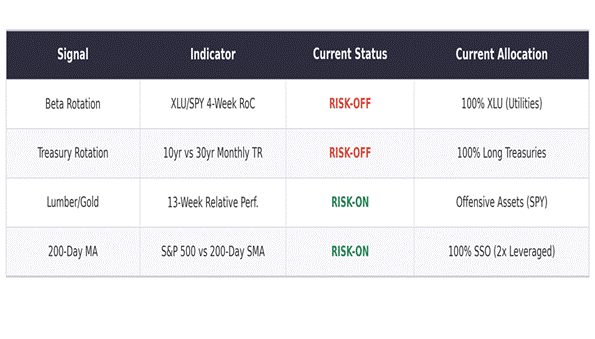
COMPOSITE: TILT RISK-ON (+16 on a -100/+100 conviction-weighted scale)
2-of-4 RISK-ON · 2-of-4 RISK-OFF
Inflection alert: the four signals are evenly split. Mixed readings historically precede sharper resolutions in either direction — watch the next two signals to flip for the cleaner read.
Key Takeaways:
• Signal 1 (Beta Rotation) now Risk-Off with the XLU/SPY 4-week RoC at 0.19%. Utilities are outperforming the S&P 500 over the past four weeks, a defensive rotation signature. The allocation remains 100% XLU (Utilities).
• Signal 2 (Treasury Rotation) is RISK-OFF on the latest May month-end reading. TLT returned 0.16% in May versus IEF at -0.35%. Long-duration bonds outperformed intermediate maturities, a defensive risk-appetite indicator. The signal will hold this reading through the end of June. The current allocation tilts toward long-duration Treasuries (VLGSX/TLT).
• Signal 3 (Lumber/Gold) is RISK-ON on the latest 13-week relative-performance reading. Lumber’s 13-week return of 10.86% exceeds gold’s -13.24%. All seven sub-strategies are positioned offensively, with cyclical exposures favored over defensive bond pairs.
• The S&P 500 at 7,575.39 sits +8.8% above its 200-day SMA of 6,965.14. Signal 4 remains Risk-On, with the allocation set to SSO (2x leveraged S&P 500). Trend remains intact even after Thursday’s broad equity selloff.
MARKET COMMENTARY
The framework reads 2-2 Risk-On this week. 2 of four signals favor risk-on positioning and 2 signals flag defense. The S&P 500 closed at 7,575.39 on July 10, 2026, +8.8% above its 200-day moving average of 6,965.14.
The week ending July 10, 2026 closed with the S&P 500 at 7,575.39. The index continues to sit above its 200-day moving average, keeping the trend structure intact that has framed the year to date. Beneath the headline price action, defensive equity leadership has emerged — utilities are outperforming the broad market over the trailing four weeks, a rotation signature that often precedes broader risk-off behavior, and long-duration Treasury bids picked up versus intermediate maturities — a pattern consistent with this week’s Treasury Rotation reading. Earnings season has wound down with broadly stable forward guidance, and macro data continues to trace a soft-landing path, but valuations, positioning, and concentration risk all argue for tactical respect of the framework’s defensive readings.
At 7,575.39, the index sits +8.8% above its 200-day SMA of 6,965.14. That spread is comfortable enough to keep Signal 4 on the offensive 2x leveraged allocation. The technical setup remains constructive in the aggregate — price above a rising 200-day — but the divergence between the trend signal and the Beta Rotation and Treasury Rotation signals is the kind of split that historically precedes either a pause in the trend or a stronger rotation into defense.
The Beta Rotation signal is RISK-OFF with the XLU/SPY 4-week Rate of Change at 0.19%. Utilities are outperforming the broad market over the trailing four weeks, with the positive RoC reflecting persistent flows into defensive equity sectors. This rotation signature often emerges ahead of broader risk-off behavior and warrants attention. The framework’s allocation shifts to XLU (Utilities).
The Treasury Rotation signal is RISK-OFF on the latest May month-end reading. TLT returned 0.16% in May versus IEF at -0.35%, with the long bond outperforming the intermediate — a classic defensive risk-appetite signature. The signal will hold this May reading through the end of June. Long-duration outperformance during a backdrop of generally rising equity tells a story of yield-curve flattening pressure and creeping recessionary positioning at the long end. Combined with Signal 1’s utilities-led rotation, defensive positioning is broadening across multiple corners of the framework. A persistent Risk-Off Treasury signal alongside a Risk-On 200-day reading is the kind of divergence that historically signals an inflection point: either the equity trend resolves the divergence by following Treasuries lower, or Treasuries reconverge upward.
The Lumber/Gold signal is RISK-ON on the latest 13-week reading. Lumber’s 13-week return of 10.86% exceeds gold’s -13.24%. All seven Lumber/Gold sub-strategies are positioned offensively, with cyclical and growth-tilted pairs favored over defensive bond pairs. Lumber has held its bid as housing demand expectations firm, while gold has paused its rally near record levels. The relative dynamic stays Risk-On but the spread has narrowed week-over-week, and a re-acceleration in gold would flip the signal quickly.
The 2-2 Risk-On reading sits evenly split, an inflection-point posture where the framework offers neither full offense nor full defense. Mixed readings often precede broader pivots in either direction — either the defensive signals reconverge to risk-on, or the risk-on signals follow defense lower. The current setup demands tactical respect: maintain offensive allocations where signals call for them, recognize defensive allocations where they apply, and treat the disagreement among indicators as meaningful. The risks worth watching are an acceleration of the long-Treasury bid, further utilities outperformance that deepens the Beta Rotation defensive reading, equity selloffs that compress the cushion above the 200-day, or a flip of the Lumber/Gold spread back to gold-favored.
SIGNAL 1: BETA ROTATION
Based on: “An Intermarket Approach to Beta Rotation: The Strategy, Signal, and Power of Utilities” (SSRN 2417974)
Target Investor: Self-directed investors who want to capture relative strength between equity market segments. This signal uses the 4-week rate of change of the Utilities-to-S&P 500 price ratio to determine whether the market favors offense (broad equity) or defense (Utilities).
CURRENT INDICATOR: RISK-OFF
Conviction: 51/100 · Regime age: 2 weeks (14 days) · Whipsaw alert: 3 flips in last 12 readings
What would flip this signal: Signal flips RISK-ON when the XLU/SPY 4-week rate of change crosses zero (currently +0.19%). That requires the XLU/SPY ratio to fall to 0.06003 from today’s 0.06015.
Prior RISK-OFF regimes: Jun 2026 (1d), Feb 2026–Apr 2026 (56d), Jan 2026 (1d).
XLU/SPY 4-Week Rate of Change: 0.19%
Current Allocation: 100% SPY (S&P 500)
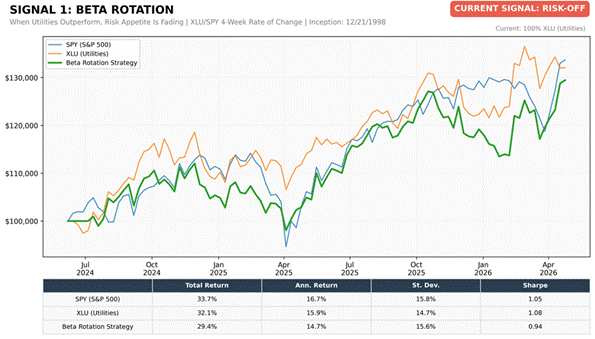
Growth of $100,000 | YTD from January 3, 2025 | Data: Lead-Lag Publishing, LLC
Reading the chart: XLU/SPY 4-week RoC currently 0.19%. Flip threshold: 0.00%. Distance to flip: 0.19 percentage points.
SIGNAL 2: TACTICAL RISK ROTATION
Based on: “A Quantitative Approach to Tactical Asset Allocation” (SSRN 2431022)
Target Investor: Conservative to moderate investors seeking a tactical overlay between equities and long-duration Treasuries. This signal compares the prior month total return of 10-year versus 30-year Treasury bonds to identify shifts in the yield curve’s risk appetite signal.
CURRENT INDICATOR: RISK-OFF
Conviction: 59/100 · Regime age: 740+ days · Whipsaw alert: 6 flips in last 12 readings
What would flip this signal: Signal flips RISK-ON when next month’s IEF return exceeds TLT. Current spread: TLT +0.16% vs IEF -0.35% (+0.51 pp).
Prior RISK-OFF regimes: May 2026–Jun 2026 (30d), Jan 2026–Feb 2026 (28d), Sep 2025–Oct 2025 (31d).
30yr Treasury (TLT) May Return: 0.16%
10yr Treasury (IEF) May Return: -0.35%
Current Allocation: 100% Long-Duration Treasuries (VLGSX/TLT)
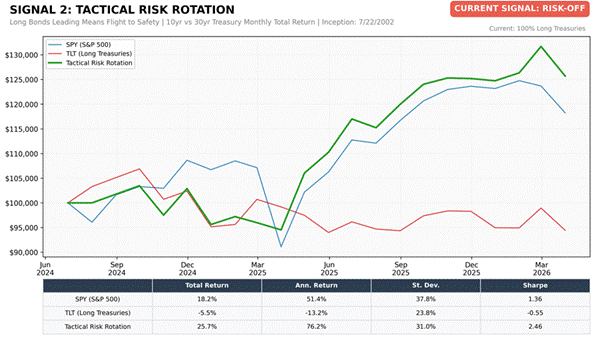
Growth of $100,000 | Monthly Data from January 2025 | Data: Lead-Lag Publishing, LLC
Reading the chart: TLT-minus-IEF May return spread +0.51%. Flip threshold: spread crosses 0%. Distance to flip: 0.51 percentage points.
SIGNAL 3: LUMBER/GOLD RATIO
Based on: “Lumber: Worth Its Weight in Gold” (SSRN 2604248)
Target Investor: Active investors seeking to rotate between offensive and defensive exposures across multiple asset class pairings. This signal uses the 13-week relative performance of Lumber futures versus Gold spot to determine the market’s risk appetite. When Lumber outperforms Gold, the economy is likely strengthening (Risk-On). When Gold outperforms, investors should favor defensive positioning (Risk-Off).
CURRENT INDICATOR: RISK-ON
Conviction: 88/100 · Regime age: ~2 months (77 days)
What would flip this signal: Signal flips RISK-OFF when gold overtakes lumber on a 13-week return basis. Current spread: lumber +10.9% vs gold -13.2% (+24.1 pp gap).
Prior RISK-ON regimes: Mar 2026–Apr 2026 (21d), Aug 2025 (1d), Jul 2025–Aug 2025 (28d).
Lumber 13-Week Return: 10.86%
Gold 13-Week Return: +-13.24%
Lumber now outperforming Gold over 13 weeks. All 7 sub-strategies have rotated to offensive positioning.
Lumber/Gold Bond Rotation (SPY vs GOVT)
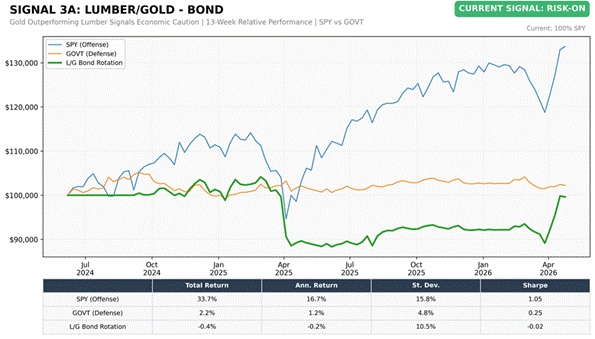
Growth of $100,000 | YTD from January 3, 2025 | Data: Lead-Lag Publishing, LLC
Lumber/Gold Buy-Write (SPY vs PBP)
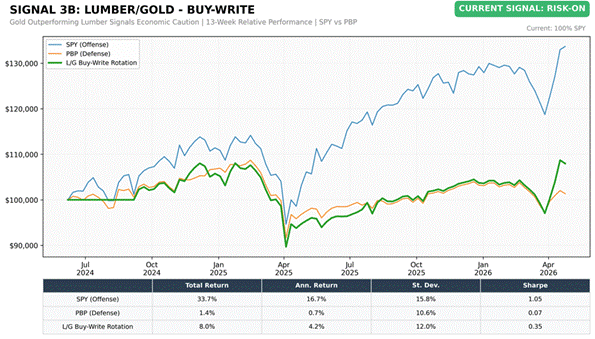
Growth of $100,000 | YTD from January 3, 2025 | Data: Lead-Lag Publishing, LLC
Lumber/Gold Low Volatility (SPY vs SPLV)
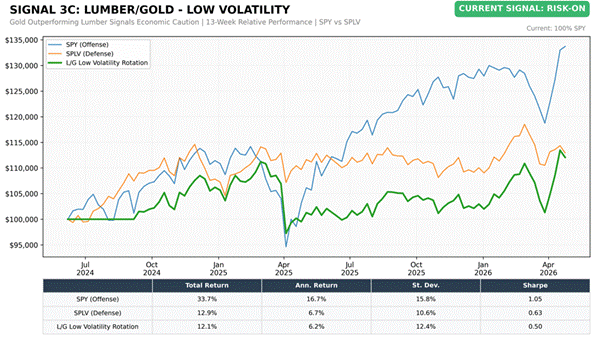
Growth of $100,000 | YTD from January 3, 2025 | Data: Lead-Lag Publishing, LLC
Lumber/Gold Small-Cap (SPY vs VSMAX)
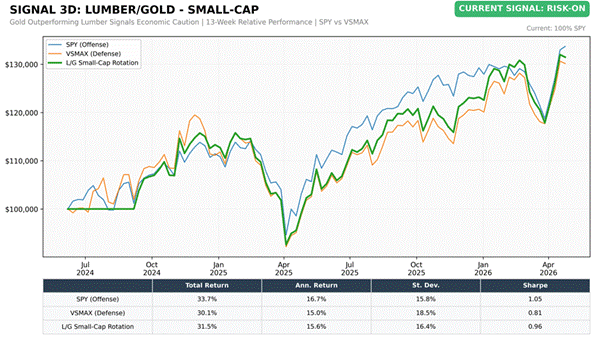
Growth of $100,000 | YTD from January 3, 2025 | Data: Lead-Lag Publishing, LLC
Lumber/Gold High Beta (SPY vs SPHB)
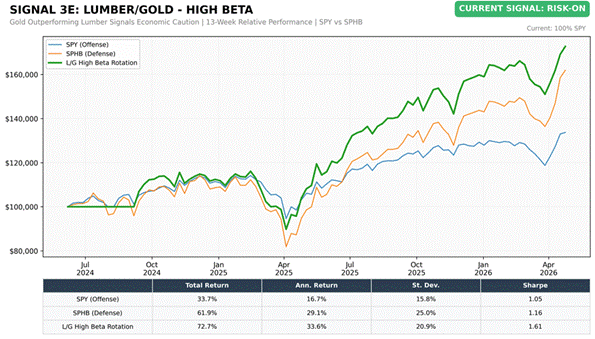
Growth of $100,000 | YTD from January 3, 2025 | Data: Lead-Lag Publishing, LLC
Lumber/Gold Cyclical Growth (SPY vs VUG)
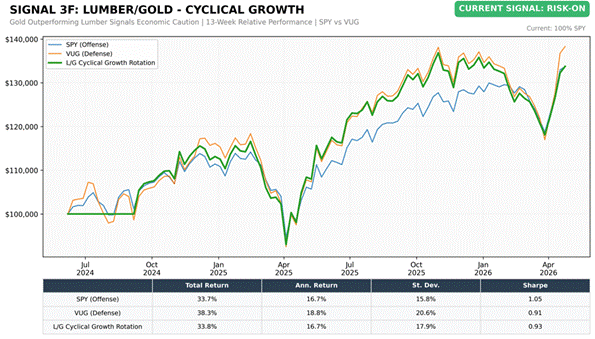
Growth of $100,000 | YTD from January 3, 2025 | Data: Lead-Lag Publishing, LLC
Lumber/Gold Cyclical Bond (GOVT vs VUG)
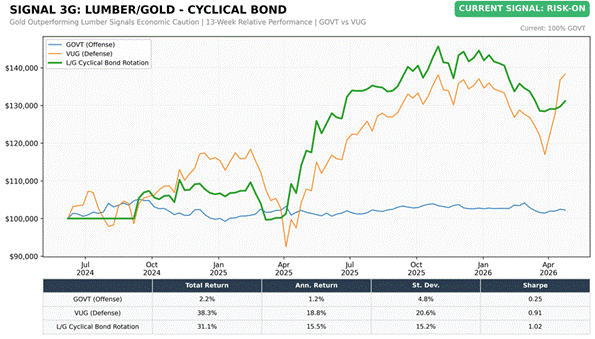
Growth of $100,000 | YTD from January 3, 2025 | Data: Lead-Lag Publishing, LLC
SIGNAL 4: LEVERAGE FOR THE LONG RUN
Based on: “Leverage for the Long Run” (SSRN 2741701)
Target Investor: Aggressive investors with a long time horizon who are comfortable with leveraged equity exposure. This signal uses the S&P 500’s position relative to its 200-day simple moving average to determine whether to employ 2x leveraged exposure (SSO) or standard exposure (SPY).
CURRENT INDICATOR: RISK-ON
Conviction: 88/100 · Regime age: ~3 months (93 days)
What would flip this signal: Signal flips RISK-OFF when the S&P 500 closes below its 200-day SMA of 6,965 (today 7,575, +8.8%).
Prior RISK-ON regimes: May 2025–Mar 2026 (310d), Mar 2025 (1d).
S&P 500 Close: 7,575.39
200-Day SMA: 6,965.14
Spread: +8.76% above the 200-day moving average
Current Allocation: 100% SSO (ProShares Ultra S&P500, 2x leveraged)
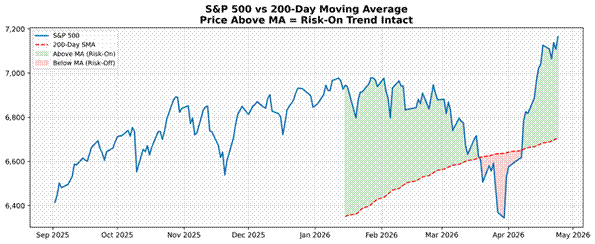
S&P 500 Index vs 200-Day Simple Moving Average | Sep 2025 - Apr 2026
Reading the chart: S&P 500 at 7575.39. 200-day SMA at 6965.14. Flip threshold: SPX closes below SMA. Current cushion: +8.76 percentage points.
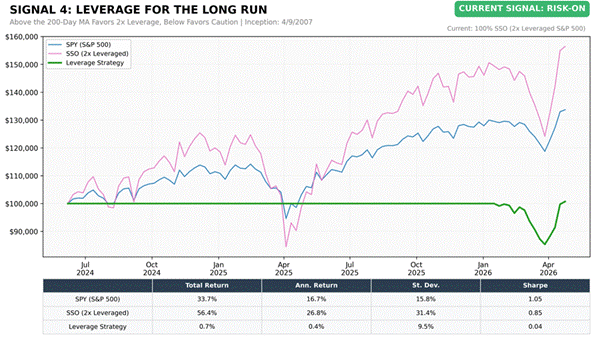
Growth of $100,000 | YTD from January 3, 2025 | Data: Lead-Lag Publishing, LLC
CONCLUSION & ALLOCATION GUIDANCE
The framework reads 2-2 Risk-On this week. 2 of four signals favor risk-on positioning and 2 flag defense. The S&P 500 at 7,575.39 sits +8.8% above its 200-day SMA. An evenly split reading is an inflection-point posture that demands tactical respect for both the offensive and defensive calls within the framework.
Bottom Line: Maintain the framework’s allocations as called this week. Signal 4 (RISK-ON) calls for 100% SSO (2x leveraged S&P 500). Signal 1 (RISK-OFF) rotates to XLU (Utilities) over broad equity. Signal 2 (RISK-OFF) favors long-duration Treasuries (VLGSX/TLT) over equity for the conservative sleeve through end of June. Signal 3 (RISK-ON) favors offensive sub-strategies across all seven Lumber/Gold pairs. The 2-2 split reading is an inflection-point posture. The framework’s message this week is to honor each individual signal’s allocation call while recognizing that the disagreement among indicators — trend and lumber/gold on offense, beta rotation and treasuries on defense — argues for sizing with awareness. Risks worth watching: deeper utilities outperformance that broadens the defensive reading, a flip of the Lumber/Gold spread back to gold-favored, or equity selloffs that compress the cushion above the 200-day.
Deep Dive: 200-day Moving Average — Trend’s Final Word
The 200-day MA signal is the simplest of the four — and one of the most studied in market history. Above the 200-day MA, the framework allocates to SSO (2x leveraged S&P 500). Below, it goes to unleveraged SPY. The leverage decision is binary because the 200-day cleanly separates two regimes with very different historical risk/reward profiles: above-200 environments have produced positive average forward returns with shallower drawdowns; below-200 environments have produced flat-to-negative returns with materially deeper drawdowns. The signal is slow on purpose. False breaks happen, but the cost of staying with the trend through false breaks has historically been smaller than the cost of catching falling knives.
This Deep Dive rotates across all four signals on a 4-week cycle. Next week’s spotlight: Beta Rotation — Why Utilities Lead Defense.
The Lead-Lag Report is provided by Lead-Lag Publishing, LLC. All opinions and views mentioned in this report constitute our judgments as of the date of writing and are subject to change at any time. Information within this material is not intended to be used as a primary basis for investment decisions and should also not be construed as advice meeting the particular investment needs of any individual investor. Trading signals produced by the Lead-Lag Report are independent of other services provided by Lead-Lag Publishing, LLC or its affiliates, and positioning of accounts under their management may differ. Please remember that investing involves risk, including loss of principal, and past performance may not be indicative of future results. Lead-Lag Publishing, LLC, its members, officers, directors and employees expressly disclaim all liability in respect to actions taken based on any or all of the information on this writing.