

The labor market looks like it’s finally beginning to feel the effects of the Fed’s aggressive interest rate hiking cycle, easing to more of a neutral and balanced state from the big supply/demand mismatch that led to the great resignation. The August ADP employment report came in below expectations, adding the fewest jobs in 5 months. Job openings hit their lowest level in more than 2 years. The Challenger job cuts number tripled in August compared to the prior month and the unemployment rate hit its highest mark since early 2022. Non-farm payrolls and jobless claims still look good, so it’s not bad news across the board, but there’s a very defined shift towards a cooling labor market that’s happening here. Since the labor market is a big driver of just about everything that happens in the economy, the groundwork for an economic slowdown is being laid.
How To Interpret the Signals: Within each strategy, there is a risk-on and risk-off investment recommendation, with the risk-off option being the more conservative of the two. When a particular signal indicates that investors should be risk-off, for example, subscribers should consider investing in the risk-off option and avoiding the risk-on option. The opposite, therefore, would be true when the signal flips to risk-on. In each strategy, you’d always be invested in one option or the other.
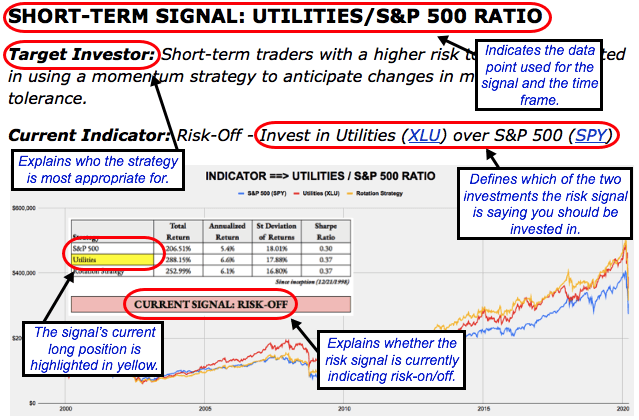
Here’s how to read the scorecard for each strategy:
Some of the strategies will be more aggressive than others. The “Leverage For The Long Run” strategy, for example, uses the S&P 500 and 2x-leveraged S&P 500. The more conservative “Lumber/Gold Bond” strategy, however, uses intermediate-term Treasuries and the S&P 500. In every case, a risk-off signal indicates that you should be invested in the more conservative of the two options, while a risk-on signal indicates you should be invested in the more aggressive one.
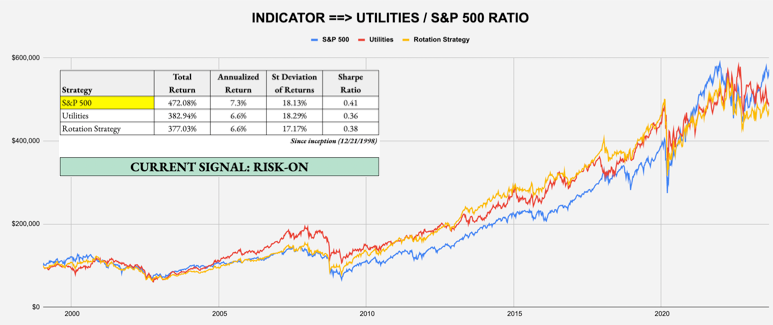
SHORT-TERM SIGNAL: UTILITIES/S&P 500 RATIO
Target Investor: Short-term traders with a higher risk tolerance interested in using an equity momentum strategy to anticipate changes in market risk tolerance.
Current Indicator: Risk-On
Strategy: Beta Rotation - Example: Invest in S&P 500 (SPY) over Utilities (XLU)
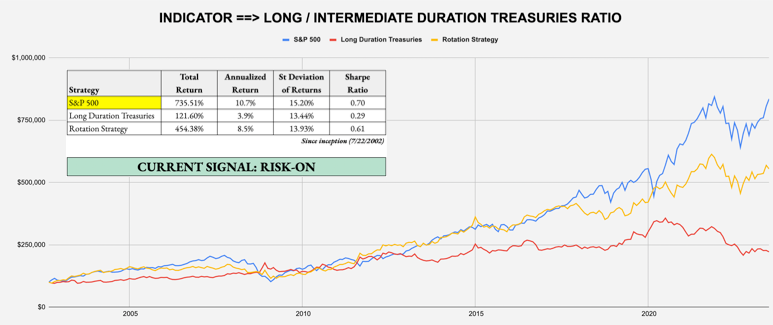
SHORT-TERM SIGNAL: LONG DURATION/INTERMEDIATE DURATION TREASURIES RATIO
Target Investor: Short-term traders with a higher risk tolerance who want to use the activity in the U.S. Treasury market to judge overall risk levels.
Current Indicator: Risk-On
Strategy: Tactical Risk Rotation - Example: Invest in S&P 500 (SPY) over Long-Duration Treasuries (VLGSX)
INTERMEDIATE-TERM SIGNAL: LUMBER/GOLD RATIO
Target Investor: Short- and long-term investors willing to trade more frequently using the classic cyclical vs. defensive asset comparison.
