The Memory Behind the AI Trade: SK Hynix Comes to Nasdaq
What the dominant HBM supplier's Nasdaq debut means — and the new 2x daily long/short ETFs (SKUU, SKDD) that trade around it starting today.

For the past two years, the AI story has been told through GPUs — Nvidia’s, mostly, with sidebars on custom silicon at the hyperscalers. That framing is incomplete. Every one of those accelerators sits next to a stack of high-bandwidth memory, and the company that supplies most of those stacks now has a U.S.-listed ticker, a fresh $26.5 billion balance sheet, and a leveraged single-stock ETF pair going live on Nasdaq tomorrow.
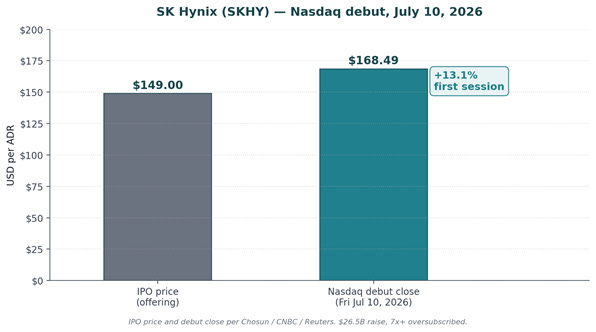
SK Hynix began trading on Nasdaq as SKHY on July 10, 2026, closing its first session at $168.49 — up 13.1% from the $149 IPO price (Chosun; CNBC). The $26.5 billion offering ranks as the second-largest U.S. share sale on record and was reportedly more than seven times oversubscribed (Reuters; Fortune). Today — GraniteShares lists the first U.S.-listed 2x long and 2x short daily ETFs on SK Hynix, ticker SKUU and SKDD, both trading on Nasdaq (GraniteShares; GraniteShares press). For active traders who have a defined, short-duration view on where SK Hynix goes next — up or down — the pair offers a leveraged way to track SKHY’s daily move without borrowing shares, posting collateral, or opening an options position.
The AI capex trade is not a bet on hyperscaler intent. It is a bet on the physical bottleneck sitting between compute and memory. That bottleneck has a name, a market share, and — as of July 14 — two directional ETFs.
The setup: a dominant franchise, a stretched tape, and an unusually divided Street
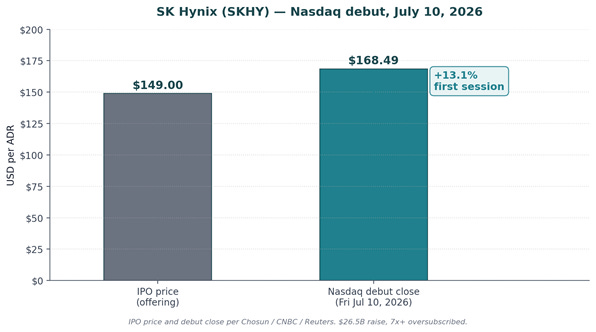
SK Hynix ADR (SKHY) — Nasdaq debut, July 10, 2026.
SK Hynix enters its U.S. life as the incumbent leader in high-bandwidth memory, the specialized DRAM that sits alongside Nvidia’s GPUs in every AI training and inference system. First-quarter 2026 HBM market share by revenue was 58% for SK Hynix, 21% for Samsung, and 21% for Micron, according to Counterpoint Research (Gate.com). The company signed a multi-year memory partnership with Nvidia on June 7, 2026, and shipped 12-layer HBM4E samples on June 18 — a full generation ahead of where most competitors are qualified (Servola). Full-year 2025 operating profit surpassed Samsung’s for the first time in the company’s history, cementing HBM as the profit engine rather than a specialty product (CNBC).
The tape reflects that dominance. On the Korea Exchange the stock has climbed roughly 290% year-to-date through late June 2026, trading recently near KRW 2.6 million and only about 12% below its June 25 all-time high (NewsCase). Analyst 12-month price targets span an unusually wide range — from KRW 1,200,000 on the low end to KRW 4,700,000 on the high end across 37 estimates, with a KRW 3,258,502 average (Investing.com). That kind of dispersion around a single name is precisely what tends to produce outsized single-session moves as new information — a Samsung HBM4 qualification headline, an Nvidia order revision, a monthly DRAM price print — is absorbed into the price. NH Investment & Securities raised its target on July 2, 2026, ahead of the ADR listing, citing the ongoing AI-memory upcycle (Chosunbiz).
The bull-versus-bear split around the name is not academic — it is the direct output of one franchise that is simultaneously (a) the closest thing to a pure-play on Nvidia’s AI-memory roadmap, and (b) trading at a valuation that many analysts describe as “priced as if the cycle had been abolished” (FactorsToday). SKUU is built for traders who want a magnified way to participate on the upside of that debate for a single trading session. SKDD is built for traders who want a magnified way to participate on the downside of it, for the same single session.
Bull case: HBM leadership, structural AI capex, and a Nasdaq re-rating
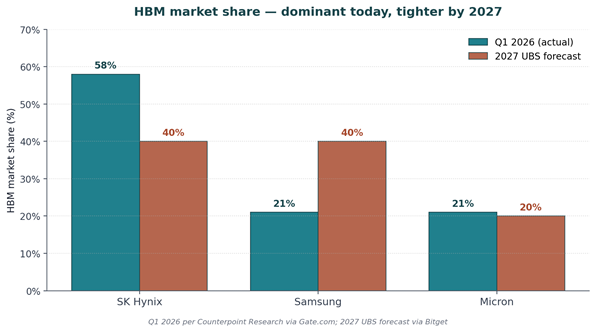
HBM market share: Q1 2026 actuals vs UBS 2027 forecast.
The bull case begins with market structure. HBM is not commodity DRAM — customer qualification for Nvidia’s Blackwell and Rubin platforms is measured in years, not quarters, and the qualification process itself creates switching costs that traditional memory does not carry (Zero One Investment Research). SK Hynix commercialized MR-MUF advanced packaging ahead of peers, delivered 12-layer HBM4 samples first, and is currently the only supplier inside Nvidia’s Blackwell-class production with multi-generation continuity (Deep Research Global). HBM commands a 5-10x price premium per bit over conventional DRAM, and qualification status is the primary determinant of who captures that margin (Zero One Investment Research).
Second, the AI capex tape has not softened. TrendForce and Counterpoint both project SK Hynix retains roughly 50-54% HBM share through 2026, with Samsung near 28% and Micron around 22% — a structural three-supplier oligopoly that constrains supply flexibility across the entire AI hardware stack (Gate.com; PatSnap). HBM revenue moved from roughly 40% of SK Hynix DRAM sales in Q4 2024 to more than half in 2025, and the mix continues to shift upward — a fundamental change to the company’s earnings quality that a pure DRAM-cycle framing misses (Hated Moats).
Third, the Nasdaq listing itself is a re-rating catalyst. SK Hynix historically traded at a 5.5x forward P/E versus Micron’s 6.66x, a discount analysts commonly attribute to the Korean-listing structure and limited U.S. institutional access (Reuters). HSBC has flagged that Micron has traded at a 35% average premium to SK Hynix over the past 13 years, and the ADR listing directly attacks that gap (LineVest). Post-listing, Jupiter Asset Management publicly flagged the potential for a “revaluation of SK Hynix’s lower P/E ratio compared to Micron” (Chosun). For a trader with a same-session view that this multiple compression is not yet fully priced in, SKUU offers 2x daily-reset participation in a beat, a positive supply update, or a stronger-than-expected first weeks of ADR trading.
Bear case: valuation, competitive catch-up, and cyclical memory
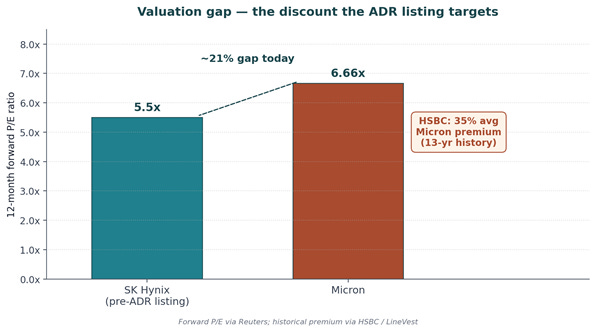
Forward P/E of SK Hynix vs Micron, and the historical 13-yr Micron premium (HSBC).
The bear case starts with valuation. The KOSPI-listed shares are up roughly 290% year-to-date and trade at roughly 20.6x trailing earnings, a level that assumes the AI capex cycle continues at the current pace with no meaningful moderation (StockAnalysis; NewsCase). Some analysts have flagged that the stock is “no longer low-risk near KRW 1.6 million” and that further upside depends specifically on tight HBM supply, high margins, and a sustained multiple re-rating — a stack of assumptions in which any single failure can drive multi-day drawdowns (EBC Financial).
Second, competitive catch-up is now measurable rather than theoretical. Samsung mass-produced HBM4 in February 2026, and UBS projects Samsung’s HBM bit share reaches 40% by 2027, tying SK Hynix at 40% each with Micron at 20% (Bitget). Micron has been chosen as a primary HBM supplier for Nvidia’s Blackwell GPUs and the Vera Rubin AI platform, with HBM4 for Vera Rubin shipping since March 2026 (Gate.com). Some independent analyst work estimates Samsung is already pricing HBM roughly 30% below SK Hynix to reclaim share, a structural threat to pricing power in a business where a single-percentage-point ASP move flows almost directly to segment margin (YouTube analysis).
Third, memory is cyclical, and the DRAM story does not begin and end with HBM. Samsung reclaimed the overall DRAM market lead in Q4 2025 with 36% share versus SK Hynix at 32.1% — the first time Samsung had held that title since Q1 2025 (Qazinform). If the AI investment wave decelerates even modestly, or if multiple suppliers add capacity simultaneously into a softening demand tape, oversupply and margin compression become near-term risks rather than tail risks (NewsCase). Sharp profit-taking after the Nasdaq debut is already visible in the Korean tape: SK Hynix shares fell as much as 4.4% in Seoul on July 13, one session after the strong ADR pricing (The Star). For a trader with a same-session view that valuation risk, Samsung’s qualification progress, or memory cyclicality are underappreciated, SKDD offers -2x daily-reset participation in a downside session — without the operational friction of locating shares to short a newly listed ADR.
How SKUU and SKDD actually work — and the daily reset that defines both
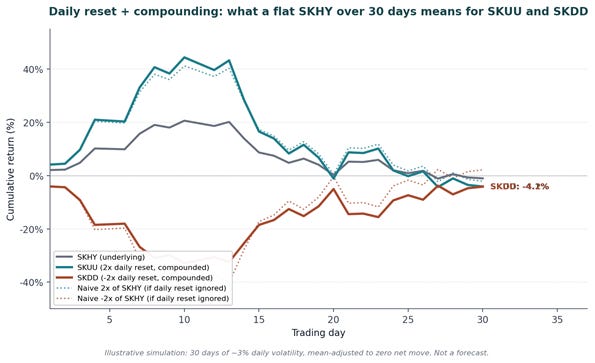
Hypothetical illustrative simulation — not a forecast and does not represent actual fund performance: even when the underlying goes nowhere, a choppy tape can decay both a 2x long and a -2x short position.
SKUU and SKDD are actively managed, single-stock leveraged ETFs. Neither fund holds SK Hynix shares directly. Both construct their target daily profile using swaps and options on SK Hynix, seeking to provide 2 times (200%) the daily percentage change of SKHY for SKUU and -2 times (-200%) the daily percentage change of SKHY for SKDD, before fees and expenses (GraniteShares; Prospectus). SKUU’s expense ratio is 1.50%; SKDD’s is 2.20% (GraniteShares).
The single most important mechanical fact for anyone using either product is that both funds reset their target multiple every trading day. SKUU is engineered to deliver 2x SKHY’s return for one trading session — not 2x SKHY’s return over a week, a month, or through the launch window. If SKHY rises 3% on a given session, SKUU is designed to rise approximately 6% that day, before fees and financing costs. What happens on any following session is an entirely separate daily calculation, not a continuation of a fixed multiple applied to the pre-move price. The same mechanic applies in reverse to SKDD: a 3% down day in SKHY targets approximately +6% for SKDD that session, before fees. Traders holding either fund through multiple sessions are holding a chain of independent daily bets, not a single leveraged position across the whole move.
Risk framing: compounding decay, single-stock concentration, and leverage
The daily reset is not a technicality — it is the source of the funds’ central risk. Because returns compound day over day rather than accumulating linearly, the return of SKUU or SKDD over any period longer than a single trading day will diverge from the stated daily multiple applied to SKHY’s cumulative move, and that divergence tends to widen with volatility. In a choppy, headline-driven stretch — up one day, down the next, roughly flat over a couple of weeks — the compounding math works against the holder in either direction. It is entirely possible for SKUU to lose money over a two-week window in which SKHY finishes higher than it started, and equally possible for SKDD to lose money over a two-week window in which SKHY finishes lower than it started. The illustrative simulation on the previous page shows that path dependency: even with SKHY finishing at roughly the same level after 30 sessions of assumed 3% daily volatility, both the compounded +2x and compounded -2x returns land measurably below what a naive multiple of the cumulative move would suggest. The illustrative simulation shown on the previous page is hypothetical only, is not a forecast, and does not represent actual fund performance.
Layered on top of that mechanical risk is single-stock concentration. Both funds’ fortunes are tied to a single company operating in a single, cyclical, geographically concentrated industry. SK Hynix’s own results are sensitive to hyperscaler capex, DRAM and HBM pricing cycles, Nvidia qualification status, Samsung and Micron competitive positioning, U.S.–China semiconductor export policy, Korean regulatory posture toward capital markets, and won-dollar dynamics. Neither fund is diversified by design.
Leverage risk is straightforward: a 2x daily instrument moves twice as fast in both directions, and a sharp adverse session can erode principal quickly with no floor beyond the loss of the full investment (GraniteShares). Both funds also carry counterparty risk on the swap agreements used to construct the daily profile, and rebalancing risk tied to the daily trading required to reset the multiple each session. Shares are bought and sold on an exchange at market price rather than being redeemed at net asset value, so bid-ask spread and intraday liquidity are additional considerations on any entry or exit — particularly in the first weeks of trading for a newly listed pair.
What I am watching
I do not think the SK Hynix debut is best understood as a pure IPO trade. It is a re-pricing event on a franchise that was already the dominant AI-memory supplier before the ticker changed. Three things will matter more than the opening print.
First, whether the Micron valuation gap actually closes. HSBC’s observation that Micron has traded at a 35% average premium to SK Hynix over 13 years is the concise statement of what the ADR listing is engineered to attack. If U.S. institutional access alone re-rates the multiple, that is a durable, single-direction move. If it does not — if the market decides Korean-listing structure was not the real reason for the discount — the entire “listing catalyst” thesis collapses back into cyclical memory. Same tape, opposite trade.
Second, whether Samsung’s HBM4 qualification progress starts showing up in Nvidia allocation, not just in press releases. The UBS 2027 forecast of a 40/40/20 HBM market — Samsung tied with SK Hynix — is far from the 58/21/21 print for Q1 2026. Every incremental datapoint on Samsung Blackwell or Rubin qualification is a datapoint that either accelerates or delays that convergence. The 2026 tape is going to trade around that flow.
Third, cyclicality. Memory has always been cyclical. HBM’s profile is different — customer qualification, multi-year contracts, and a three-supplier oligopoly change the shape of the cycle — but they do not eliminate it. Samsung reclaiming the overall DRAM market lead in Q4 2025 is the reminder that the base business under HBM is still commodity memory subject to commodity dynamics. Any softening in hyperscaler capex commentary, any coincident capacity add across all three suppliers, and the entire complex re-rates lower.
For traders who want to express a same-session directional view on any of the above, SKUU and SKDD are built for that specific job — magnified participation in a single daily result on the world’s dominant AI memory supplier, mechanically delivered, for exactly as many sessions as the position is actively managed. What they are not is a set-it-and-forget-it substitute for owning SK Hynix stock. The daily reset means both positions need active monitoring, a defined exit plan, and a clear-eyed acknowledgment that holding period, not just direction, determines the outcome.
The AI trade has always been about the bottleneck, not the buyer. Today, that bottleneck has two new tickers.
RISK FACTORS AND IMPORTANT DISCLOSURES
This material must be preceded or accompanied by a Prospectus. Carefully consider the Fund’s investment objectives, risk factors, charges and expenses before investing. Please read the prospectus before investing.
The Fund is not suitable for all investors. The investment program of the Fund is speculative, entails substantial risks and includes asset classes and investment techniques not employed by most ETFs and mutual funds. Investments in the ETF are not bank deposits and are not insured or guaranteed by the Federal Deposit Insurance Corporation or any other government agency. The Fund is designed to be utilized only by knowledgeable investors who understand the potential consequences of seeking daily leveraged (2X) investment results, understand the risks associated with the use of leverage and are willing to monitor their portfolios frequently. For periods longer than a single day, the Fund will lose money if the Underlying Stock’s performance is flat, and it is possible that the Fund will lose money even if the Underlying Stock’s performance increases over a period longer than a single day. An investor could lose the full principal value of his/her investment within a single day.
The Fund seeks daily leveraged investment results and is intended to be used as a short-term trading vehicle. This Fund attempts to provide daily investment results that correspond to the respective long leveraged multiple of the performance of its underlying stock (a Leverage Long Fund).
Investors should note that such Leverage Long Fund pursues daily leveraged investment objectives, which means that the Fund is riskier than alternatives that do not use leverage because the Fund magnifies the performance of its underlying stock. The volatility of the underlying security may affect a Fund’s return as much as, or more than, the return of the underlying security.
Because of daily rebalancing and the compounding of each day’s return over time, the return of the Fund for periods longer than a single day will be the result of each day’s returns compounded over the period, which will very likely differ from 200% of the return of the Underlying Stock over the same period. The Fund will lose money if the Underlying Stock’s performance is flat over time, and as a result of daily rebalancing, the Underlying Stock volatility and the effects of compounding, it is even possible that the Fund will lose money over time while the Underlying Stock’s performance increases over a period longer than a single day.
Shares are bought and sold at market price (not NAV) and are not individually redeemed from the ETF. There can be no guarantee that an active trading market for ETF shares will develop or be maintained, or that their listing will continue or remain unchanged. Buying or selling ETF shares on an exchange may require the payment of brokerage commissions and frequent trading may incur brokerage costs that detract significantly from investment returns.
An investment in the Fund involves risk, including the possible loss of principal. The Fund is non-diversified and includes risks associated with the Fund concentrating its investments in a particular industry, sector, or geographic region which can result in increased volatility. The use of derivatives such as futures contracts and swaps are subject to market risks that may cause their price to fluctuate over time.
Risks of the Fund include:
· Effects of Compounding and Market Volatility Risk
· Leverage Risk
· Market Risk
· Counterparty Risk
· Rebalancing Risk
· Intra-Day Investment Risk
· Other Investment Companies (including ETFs) Risk
· Risks specific to the securities of the Underlying Stock and the sector in which it operates
These and other risks can be found in the prospectus.
This information is not an offer to sell or a solicitation of an offer to buy shares of any Funds to any person in any jurisdiction in which an offer, solicitation, purchase or sale would be unlawful under the securities laws of such jurisdiction. Please consult your tax advisor about the tax consequences of an investment in Fund shares, including the possible application of foreign, state, and local tax laws. You could lose money by investing in the ETFs. There can be no assurance that the investment objective of the Funds will be achieved. None of the Funds should be relied upon as a complete investment program.
An investor should consider the investment objectives, risks, charges and expenses of the Funds carefully before investing. To obtain a prospectus containing this and other information, please call 1-844-476-8747. Read the prospectus carefully before you invest.
THE FUND IS DISTRIBUTED BY ALPS DISTRIBUTORS, INC. GRANITESHARES IS NOT AFFILIATED WITH ALPS DISTRIBUTORS, INC.
GRS002398
DISCLAIMER – PLEASE READ: This is a sponsored article for which Lead-Lag Publishing, LLC has been paid a fee. Lead-Lag Publishing, LLC does not guarantee the accuracy or completeness of the information provided in the article or make any representation as to its quality. All statements and expressions provided in this article are the sole opinion of GraniteShares and Lead-Lag Publishing, LLC expressly disclaims any responsibility for action taken in connection with the information provided in the discussion. The content in this writing is for informational purposes only. You should not construe any information or other material as investment, financial, tax, or other advice. A participant may have taken or recommended any investment position discussed, but may close such position or alter its recommendation at any time without notice. Nothing contained in this article constitutes a solicitation, recommendation, endorsement, or offer to buy or sell any securities or other financial instruments in any jurisdiction. Please consult your own investment or financial advisor for advice related to all investment decisions.