The Quiet Unwind: EEM/XLK/Financials Reclaim Leadership, Defensive Extreme Fades, Fed Watch Looms
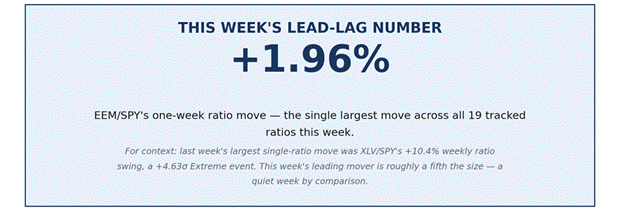
EEM/SPY +1.96% Leads; XLV/SPY -1.94% Worst Laggard; No Z-Scores Above |1.0|; JNK/GOVT Narrows +0.17%; FOMC Jul 29

Today’s Lead-Lag Report post is sponsored by WisdomTree

Today’s Lead-Lag Report is brought to you by our friends at WisdomTree. Many investors are interested in exposure to gold in their portfolio, but the harder part is deciding how to get there without tying up too much portfolio capital. WisdomTree’s capital-efficient gold suite offers three distinct approaches: GDE combines gold futures with U.S. large-cap equities, GDMN combines gold futures with gold miners equities, and GDT blends TIPS with a gold futures overlay for a different kind of inflation-aware exposure. Learn more about GDE. GDMN and GDT here.
Disclaimer
DISCLAIMER — PLEASE READ: This is sponsored advertising content for which Lead-Lag Publishing, LLC is being paid a fee. The information provided is solely the creation of WisdomTree, Inc. Lead-Lag Publishing, LLC does not guarantee the accuracy or completeness of the information provided or make any representation as to its quality. All statements and expressions provided are the sole opinion of WisdomTree Investments, Inc. and Lead-Lag Publishing, LLC expressly disclaims any responsibility for action taken in connection with the information provided.
Important information from WisdomTree: Investors should carefully consider the investment objectives, risks, charges and expenses of the Fund before investing. For a prospectus or, if available, the summary prospectus containing this and other important information about the fund, call 866.909.9473 or visit WisdomTree.com/investments. Read the prospectus or, if available, the summary prospectus carefully before investing.
There are risks involved with investing, including possible loss of principal.
WisdomTree Funds are distributed by Foreside Fund Services, LLC, in the U.S.
The Quiet Unwind: EEM/XLK/Financials Reclaim Leadership, Defensive Extreme Fades, Fed Watch Looms
Below is an assessment of the performance of some of the most important sectors and asset classes relative to each other.
See this week’s Weekly Signals for the full 4-signal framework reading. Does the sector rotation below confirm or contradict this signal?
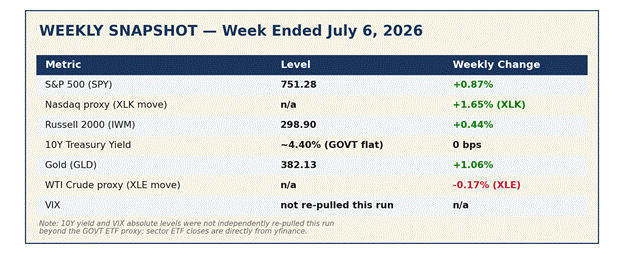
WEEKLY SNAPSHOT — Week Ended July 6, 2026
“Every ratio that printed an Extreme |Z|>2.0 signal a week ago reversed direction this week — and not one of them reached even Notable significance on the way back. That is either the cleanest mean-reversion unwind this framework has logged, or the calm before the next leg.”
24-ASSET MASTER SUMMARY TABLE
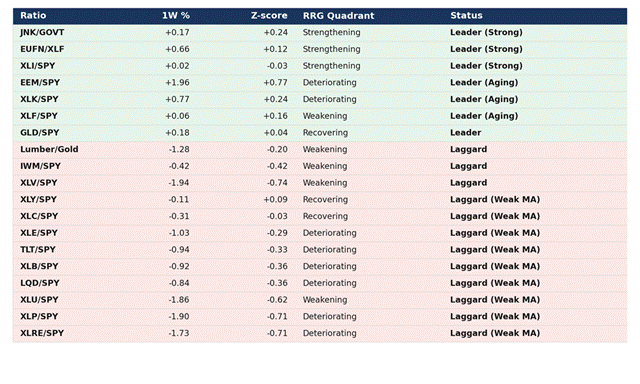
Sorted by status — strong leaders first, weak laggards last (never alphabetical). “Weak MA” denotes a ratio trading below both its 20-week and 52-week moving averages.
LEADERS: Emerging Markets and Tech Reclaim the Top, Financials Confirm, Industrials Barely Hang On
Emerging Markets (EEM) – Deteriorating RRG — Aging Leader
EEM/SPY: -1.46% one-month, 1.17% three-month, 9.24% six-month, 17.2% one-year (Signal strength: +0.77σ — Weak)
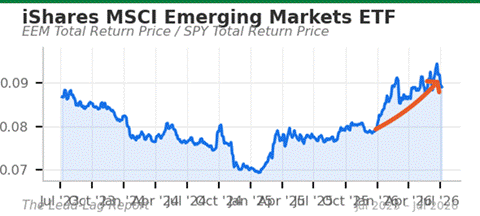
EEM/SPY posted the largest single-ratio move of the week at +1.96%, reclaiming the top of the leaderboard after last week’s -1.61σ divergence warning failed to extend into a deeper unwind. The move is tactical, not yet structural — the ratio remains in a Deteriorating RRG quadrant, meaning the 4-week rate of change is still decelerating even as the 1-week print jumped. A weaker dollar into month-end appears to be the proximate driver. Whether this is noise or signal depends on whether EM can hold this bid through a second consecutive week; one strong print inside a decelerating quadrant is not yet a trend change.
Technology (XLK) – Deteriorating RRG — Aging Leader
XLK/SPY: -2.06% one-month, 16.25% three-month, 15.71% six-month, 18.43% one-year (Signal strength: +0.24σ — Background)
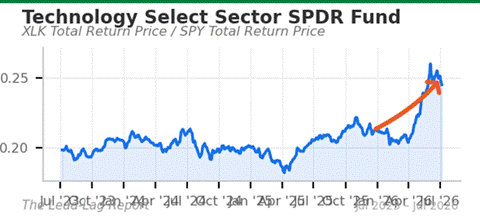
Technology’s +1.65% weekly bounce is the mirror image of last week’s -2.01σ reversal call that specifically failed to materialize — the sector deepened its losses into Run #21, and this week’s bounce only partially claws that back. The RRG quadrant remains Deteriorating, and the 1-month horizon is still negative at -2.06%, so this reads as a relief bounce inside a structurally strong 3-month/1-year uptrend (+16.25% and +18.43% respectively) rather than a fresh leadership signal. Tactical bounce, structural trend intact.
Credit vs. Treasuries (JNK/GOVT) – Strengthening RRG
JNK/GOVT: 0.19% one-month, 1.24% three-month, 1.33% six-month, 2.6% one-year (Signal strength: +0.24σ — Background)
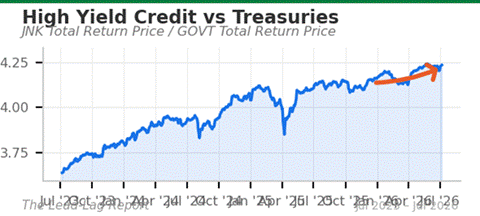
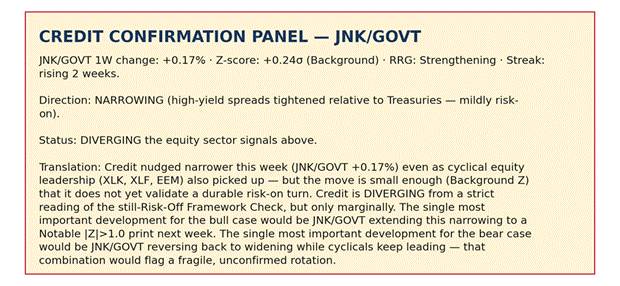
Credit spreads narrowed modestly this week (JNK/GOVT +0.17%), the second consecutive week of narrowing after last week’s -1.53σ widening call flagged a divergence risk that did not extend. This is the credit-side confirmation the equity leadership board needs to sustain — see the Credit Confirmation panel below for the full read.
Financials (XLF) – Weakening RRG — Aging Leader
XLF/SPY: 4.01% one-month, 0.1% three-month, -6.63% six-month, -10.27% one-year (Signal strength: +0.16σ — Background)
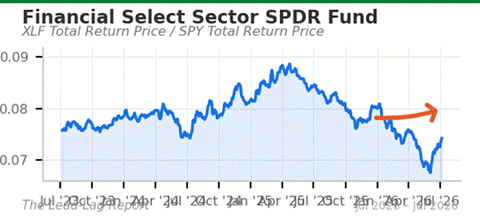
Financials extended a 3-week rising streak, now the longest active streak on the board, even as the RRG quadrant reads Weakening — the ratio is still rising but decelerating. Growth-vs-value axis: XLF’s quiet strength alongside XLK’s bounce suggests this week’s rotation is broad rather than concentrated in a single style factor.
European Banks vs. US Banks (EUFN/XLF) – Strengthening RRG
EUFN/XLF: 1.68% one-month, 0.67% three-month, 10.8% six-month, 21.79% one-year (Signal strength: +0.12σ — Background)
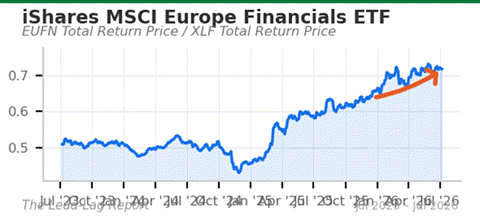
European banks continue to outpace their US counterparts on a 1-year view (+21.79%), and this week’s +0.66% move keeps that structural trend intact on a 2-week rising streak. Global vs. domestic axis: European financials remain one of the cleanest multi-month leadership signals in the entire universe, largely undisturbed by the domestic defensive-to-cyclical whipsaw of the last two weeks.
Gold (GLD) – Recovering RRG
GLD/SPY: -2.65% one-month, -21.14% three-month, -15.27% six-month, 1.48% one-year (Signal strength: +0.04σ — Background)
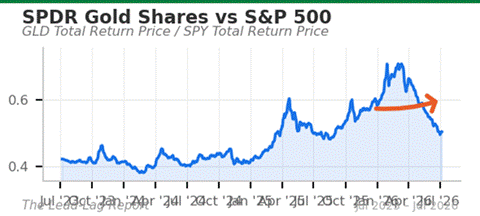
Gold’s relative ratio ticked up +0.18% this week, but the signal is essentially noise (+0.04σ) and sits inside a still-negative 3-month (-21.14%) and 6-month (-15.27%) trend. Last week’s “trend is the trade” call on gold’s falling streak holds — one quiet week inside a 9-plus week decline is not a reversal.
Industrials (XLI) – Strengthening RRG — marginal
XLI/SPY: 3.98% one-month, -2.17% three-month, 5.86% six-month, 2.73% one-year (Signal strength: -0.03σ — Background)
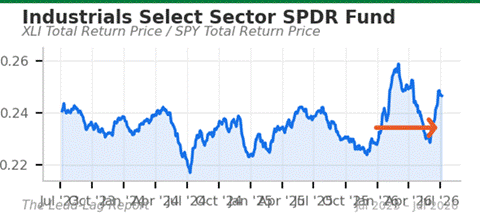
Industrials barely qualify as a leader this week — the Z-score is effectively flat (-0.03σ) and the ratio is up only 0.02% on the week. It earns its spot on the strength of a Strengthening RRG read and a positive 1-month (+3.98%) and 6-month (+5.86%) trend, but this is the weakest leader on the board and worth watching for a possible flip next week.
LAGGARDS: Defensive Extreme Unwinds Across the Board, Utilities Lead the Fade, Small Caps Quietly Slip
Healthcare (XLV) – Weakening RRG — 2-week falling streak
XLV/SPY: 4.15% one-month, -0.38% three-month, -4.58% six-month, 0.07% one-year (Signal strength: -0.74σ — Weak)
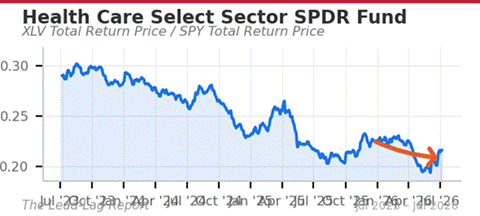
Healthcare is the week’s biggest laggard by weekly move (-1.94%) and the most dramatic single reversal on the board — this is the same ratio that printed a +4.63σ Extreme leadership signal just one week ago in Run #21. The entire move has round-tripped from Extreme leader to Weak laggard in seven trading days, the cleanest evidence yet that last week’s defensive spike was a shock, not a structural rotation. Whether this is noise or signal depends entirely on next week’s print: a second consecutive negative Z-score would confirm the unwind as real; a snap-back toward positive would suggest last week’s spike still has legs.
Consumer Staples (XLP) – Deteriorating RRG — 2-week falling streak
XLP/SPY: -2.83% one-month, -7.26% three-month, -1.25% six-month, -12.19% one-year (Signal strength: -0.71σ — Weak)
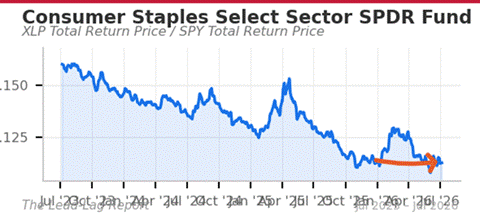
Staples fell -1.90% this week, reversing sharply from last week’s +2.27σ Extreme defensive signal. The 4-week rate of change flipped from +1.04% to -2.83%, a full deceleration reversal that puts the ratio in a Deteriorating quadrant for the first time in several weeks. Seasonal context: XLP is entering its historically weak May–October window, which is broadly consistent with this fade.
Real Estate (XLRE) – Deteriorating RRG — 2-week falling streak
XLRE/SPY: -3.0% one-month, -5.88% three-month, 2.06% six-month, -9.51% one-year (Signal strength: -0.71σ — Weak)
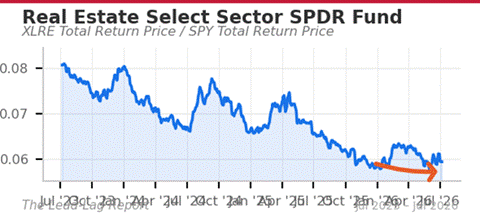
Real estate’s -1.73% weekly move continues the unwind of last week’s +3.38σ Extreme print, one of the largest positive signals on the board just seven days ago. The 4-week ROC swing from +4.56% to -3.0% is one of the sharpest deceleration reversals in this week’s data, reinforcing the “one-week shock” interpretation of Run #21’s defensive cluster.
Utilities (XLU) – Weakening RRG — 2-week falling streak
XLU/SPY: 0.82% one-month, -12.43% three-month, -0.76% six-month, -7.27% one-year (Signal strength: -0.62σ — Weak)
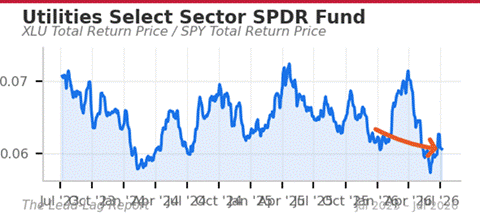
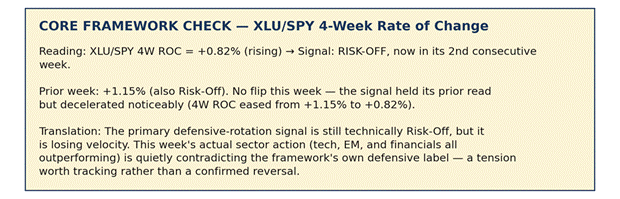
Utilities — the Core Framework Check ratio — fell -1.86% this week, the second consecutive weekly decline after peaking at +2.42σ in Run #21. Critically, the underlying 4-week ROC that drives the Framework signal is still positive (+0.82%, decelerating from +1.15%), meaning the Risk-Off framework reading has NOT flipped despite the sharp weekly-level fade. This is the tension at the heart of this week’s report: the framework says Risk-Off, the tape says something closer to Risk-On.
Small Caps / Russell 2000 (IWM) – Weakening RRG — 2-week falling streak
IWM/SPY: 0.72% one-month, 3.43% three-month, 5.99% six-month, 11.84% one-year (Signal strength: -0.42σ — Background)
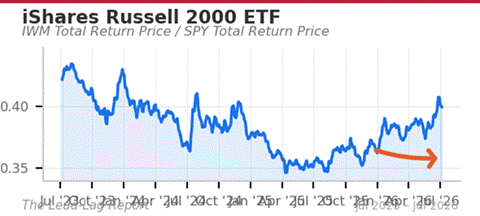
Small caps slipped -0.42% on the week and fall to laggard status for the first time in several editions, but the signal is background noise (-0.42σ) inside a still-strong 1-year uptrend (+11.84%). This looks more like digestion after a multi-week run than a genuine leadership change.
Materials (XLB) – Deteriorating RRG — 2-week falling streak
XLB/SPY: -1.53% one-month, -9.42% three-month, -0.21% six-month, -5.04% one-year (Signal strength: -0.36σ — Background)
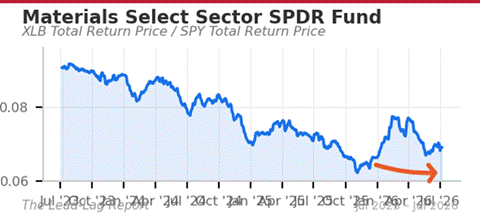
Materials continued lower (-0.92% weekly), extending a 2-week falling streak and now trading below both its 20-week and 52-week moving averages. Cyclical-vs-defensive axis: materials’ weakness alongside industrials’ marginal leadership is a mixed cyclical signal this week, not a clean read in either direction.
Investment Grade Bonds (LQD) – Deteriorating RRG — 2-week falling streak
LQD/SPY: -1.48% one-month, -9.56% three-month, -8.04% six-month, -13.99% one-year (Signal strength: -0.36σ — Background)
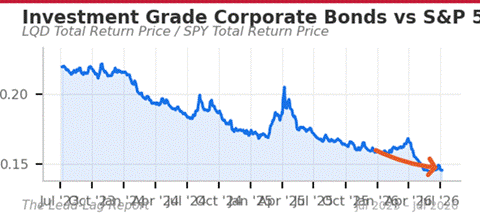
Investment-grade credit fell -0.84% this week, unwinding part of last week’s +2.12σ Extreme defensive signal. Combined with JNK/GOVT’s narrowing, the overall credit complex is sending a mixed message: high-yield is confirming the risk-on equity move while investment-grade duration is still fading.
Long-Duration Treasuries (TLT) – Deteriorating RRG — 2-week falling streak
TLT/SPY: -1.53% one-month, -10.22% three-month, -9.03% six-month, -14.84% one-year (Signal strength: -0.33σ — Background)
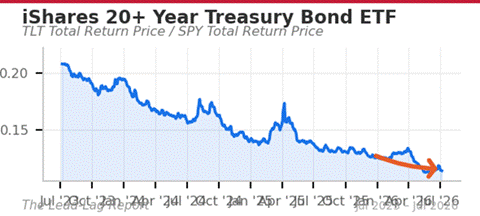
Long bonds fell -0.94% this week, extending a 2-week losing streak and remaining well below both moving averages. Inflationary-vs-deflationary axis: TLT’s persistent weakness alongside a still-elevated FOMC hike probability (see Three Things below) suggests duration risk remains a live concern heading into the July 29 decision.
Energy (XLE) – Deteriorating RRG — 2-week falling streak
XLE/SPY: -8.43% one-month, -15.22% three-month, 6.06% six-month, 0.93% one-year (Signal strength: -0.29σ — Background)
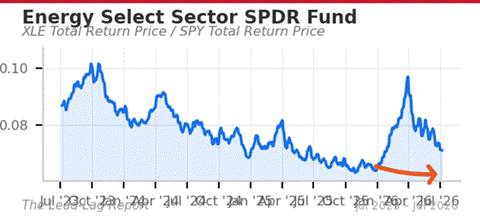
Energy remains the weakest sector on a 1-month (-8.43%) and 3-month (-15.22%) basis, though this week’s -1.03% move is background noise on the weekly Z-score. Both energy and utilities lagging together is a slightly unusual combination — typically an inflationary-vs-deflationary tell worth watching if it persists.
Communication Services (XLC) – Recovering RRG
XLC/SPY: -2.54% one-month, -12.53% three-month, -13.61% six-month, -13.58% one-year (Signal strength: -0.03σ — Background)
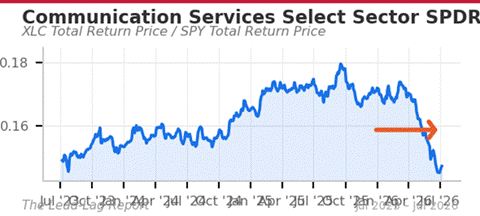
Communication services fell -0.31% this week — essentially flat on a Z-score basis — but the RRG quadrant has improved to Recovering as the 4-week ROC decelerated its decline (-4.15% to -2.54%). This is the earliest-stage signal on the board and not yet actionable, but worth tracking for a potential flip to leader.
Consumer Discretionary (XLY) – Recovering RRG
XLY/SPY: -0.13% one-month, -5.51% three-month, -12.48% six-month, -11.81% one-year (Signal strength: +0.09σ — Background)
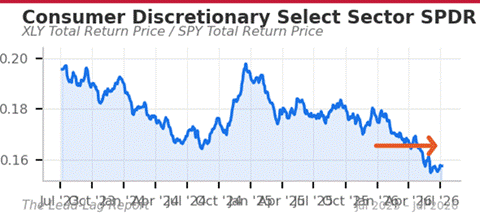
Consumer discretionary’s Z-score is technically positive (+0.09σ) but the ratio fell -0.11% on the week and remains below both moving averages, so it lands in the laggard camp on trend despite the marginally positive signal strength — a genuine edge case this week.
Lumber/Gold Macro Scenario
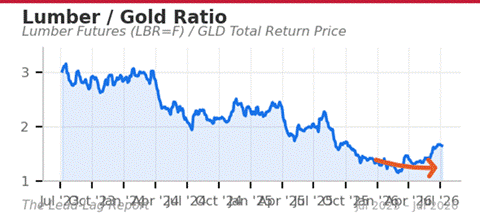
Lumber/Gold is currently in the “Both Falling” configuration (Lumber 4-week ROC -0.24%, Gold 4-week ROC -1.14%). Historically this favors watching JNK/GOVT for credit stress confirmation over favoring either cyclical or defensive sectors outright. The sector ratios above partially confirm this reading: credit (JNK/GOVT) is narrowing rather than stressing, which argues against the deflationary-pressure interpretation carrying much weight this week — a genuine cross-asset tension rather than a clean confirmation.
PREVIOUSLY ON LEADERS-LAGGARDS
Run #20 (June 23): “Streak Broken” edition — EEM, IWM, XLK, XLI, EUFN, TLT, XLF, and XLB led; XLE, XLV, XLC, XLRE, GLD, XLU, XLY, and XLP lagged. Extreme signals: EEM/SPY +1.81σ, XLE/SPY -1.95σ. Outcome: The XLC/SPY reversal call (7th week of underperformance, expecting a 3-5% bounce within 2 weeks) was partially correct — XLC did bounce, but only +0.32%, far short of the 3-5% target. Direction right, magnitude wrong.
Run #21 (June 30): “Defensive Sweep” edition — the most violent single-week reversal in the framework’s recent history. XLV, XLRE, IWM, XLU, XLP, LQD, XLF, XLI, TLT, and XLB led; XLK, EEM, GLD, XLC, XLY, EUFN, XLE, and JNK/GOVT lagged. Seven ratios printed Extreme |Z|>2.0 signals in a single week (XLV/SPY +4.63σ the largest). Outcome: two of three scored forward calls from this run were incorrect — the XLK/SPY reversal call missed (tech deepened -4.23% instead of bouncing) and the JNK/GOVT acceleration call missed (credit strengthened instead of widening further). The Quarterly Scorecard fired this morning and confirmed only 20% of evaluable Run #20-21 calls were fully correct.
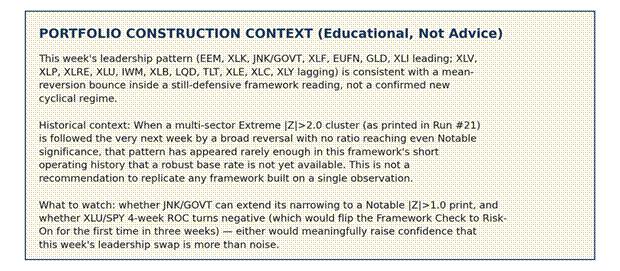
Run #22 (this issue, July 7): Nearly the entire Run #21 Extreme cluster reversed direction this week, with none of the seven ratios reaching even Notable significance on the way back — the cleanest single-week unwind logged in this framework’s history to date.
WHAT WOULD CHANGE MY VIEW
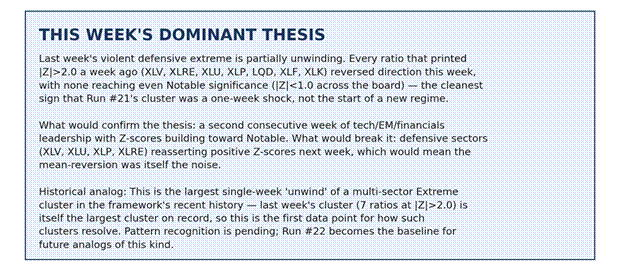
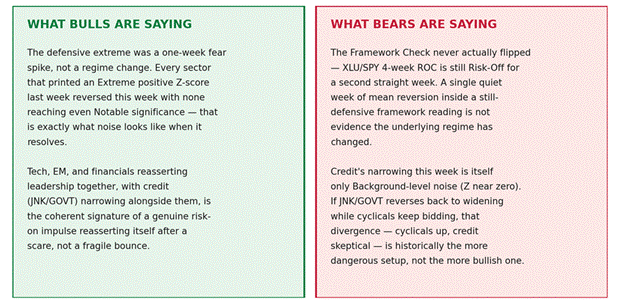
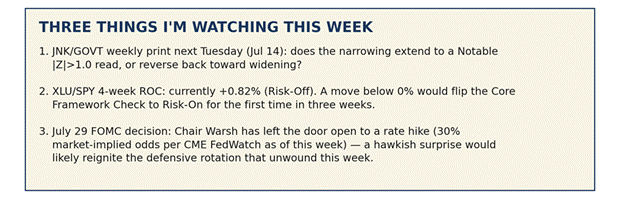
This week’s dominant thesis — that Run #21’s defensive extreme was a one-week shock now unwinding — would be confirmed by a second consecutive week of tech/EM/financials leadership with Z-scores building toward Notable (|Z|>1.0). It would be broken by defensive sectors (XLV, XLU, XLP, XLRE) reasserting positive Z-scores next week, which would mean this week’s mean-reversion was itself the noise, not the signal. On the framework side, a move in XLU/SPY 4-week ROC below 0% would flip the Core Framework Check to Risk-On for the first time in three weeks — a meaningful confirmation the rotation beneath the surface is now catching up to the sector-level tape. And on credit: JNK/GOVT reversing back to widening while cyclicals keep leading would be a warning sign, not a footnote — that divergence pattern has preceded prior defensive snapbacks in this framework’s short history.
THE WEEK IN CONTEXT
The dominant regime signal this week is an unwind, not a new trend: the framework’s Core Check still reads Risk-Off (its second straight week), even as tech, EM, and financials quietly reclaimed sector leadership and the prior week’s violent defensive extreme fully round-tripped without a single ratio reaching Notable significance in either direction. The macro driver is a market pausing to digest a one-week shock rather than confirming a new cyclical impulse, with the July 29 FOMC decision — where CME FedWatch was pricing roughly a 30% chance of a hike as of July 1, up sharply from just 6% a month earlier — standing as the next real catalyst that could either validate this week’s quiet reversal or reignite the defensive rotation outright. Watch JNK/GOVT and XLU/SPY 4-week ROC most closely over the next two weeks; both are the tightest, most falsifiable signals this framework has in play right now.
DISCLAIMER
The Lead-Lag Report is provided by Lead-Lag Publishing, LLC. All opinions and views mentioned in this report constitute our judgments as of the date of writing and are subject to change at any time. Information within this report is for informational purposes only and should not be considered as investment advice. This is not a solicitation to buy or sell securities.
The price ratio charts shown in this report illustrate relative performance between assets and are intended for educational purposes. A rising price ratio means the numerator is outperforming the denominator; a falling ratio means the opposite. Past relative performance is not indicative of future results. All investments involve risk, including the possible loss of principal.
© 2026 Lead-Lag Publishing, LLC