The Reverse Carry Trade That Broke 2008
How the Unwinding of a Trillion-Dollar Yen Position Turned a Subprime Loss Into a Global Crash

Today’s Lead-Lag Report post is sponsored by GroundFloor
Inflation Is Working Hard Against Your Cash. Groundfloor Notes Offer Real-Estate-Backed Returns Designed To Stay Ahead.
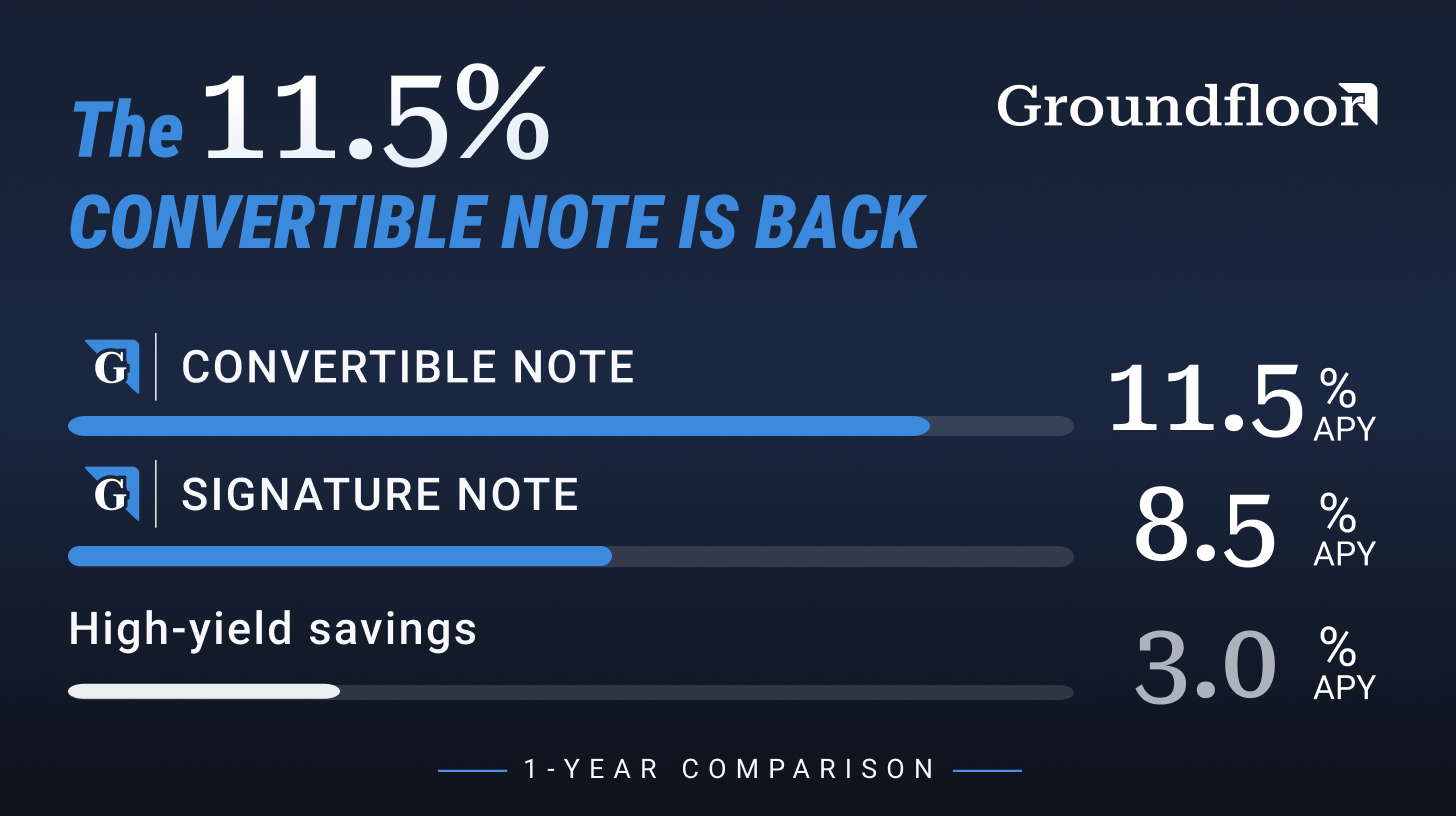
Stop letting inflation chip away at your savings. Earn up to 8.5% with the Signature Note or explore the limited-time 11.5% Convertible Note for accredited investors. Backed by real estate and a perfect payment track record since launch. Use NOTES100 to get $100 when you invest $1,000.
DISCLAIMER — PLEASE READ: This is sponsored advertising content for which Lead-Lag Publishing, LLC is being paid a fee. The information provided is solely the creation of GroundFloor. Lead-Lag Publishing, LLC does not guarantee the accuracy or completeness of the information provided or make any representation as to its quality. All statements and expressions provided are the sole opinion of GroundFloor and Lead-Lag Publishing, LLC expressly disclaims any responsibility for action taken in connection with the information provided.
The Reverse Carry Trade That Broke 2008
KEY HIGHLIGHTS
• The Bank of Japan ended its zero-interest-rate policy on March 9, 2006, but kept the policy rate at 0.25 percent through 2007. That gap against a 5.25 percent US federal funds rate created the largest documented borrow-cheap-lend-dear opportunity in modern financial history, funding an estimated one trillion dollars of leveraged positioning.
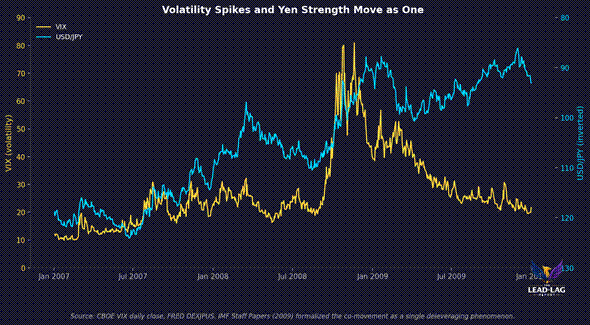
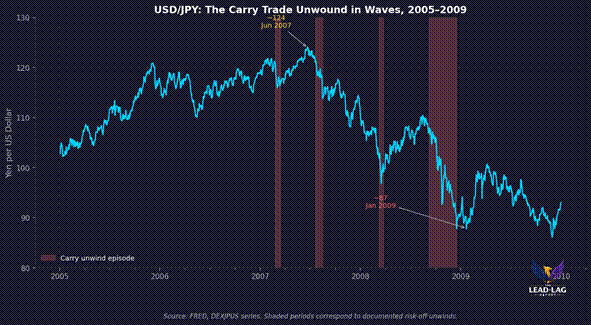
• USD/JPY peaked near 124 in June 2007 and fell to roughly 87 by January 2009, a 30 percent appreciation of the yen against the dollar. Each acute unwind episode — February 2007, August 2007, March 2008, and September through December 2008 — coincided with a synchronized drop in global equities, credit spread widening, and a volatility spike.
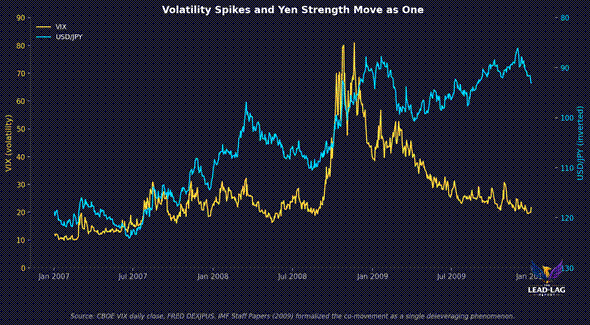
• The IMF’s 2009 staff analysis argued that the dollar’s post-Lehman rally and subprime deleveraging were, in the authors’ words, two sides of the same coin, both manifestations of financial intermediaries shrinking their balance sheets. The yen appreciation was the funding-currency mirror of that same shrinkage.
• The February 27, 2007 sell-off, triggered by a China stock plunge, produced one of the largest single-day yen moves on record and sent the S&P 500 down 3.5 percent. Consensus described it as a China story. It was the first stress test of the carry trade unwind.
• The lesson is not that the yen caused 2008. The lesson is that risk assets were held together by a single funding trade. When that trade turned, the value destruction was mechanical, correlated, and global. The same architecture is still in place today. Understanding what happened in 2008 is understanding what the next unwind will look like.
The received history of the 2008 crash goes something like this. Subprime mortgages defaulted. Banks holding mortgage-backed securities took losses. Lehman Brothers went bankrupt. Credit markets froze. Equity markets collapsed. It is a clean narrative in which US housing was the trigger and everything downstream was consequence.
That story is not wrong. It is incomplete. It leaves out the mechanism by which a domestic US credit event became a synchronized global asset-price collapse in which Japanese exporters fell more than American banks, emerging-market equities fell harder than the S&P 500, and every risk asset on the planet started moving as if driven by the same hidden variable. The mechanism was the reverse carry trade.
For most of 2005 through mid-2007, the yield gap between the Japanese and American policy rates was wide enough to make a specific transaction irresistible. Borrow yen at effectively zero cost. Convert to dollars. Buy anything with yield or growth exposure. Repeat with leverage. The Bank for International Settlements later estimated that this trade, in its various forms, had reached roughly one trillion dollars by 2007.[1] That estimate is speculative because the trade left no central registry. What is not speculative is the price path of USD/JPY between 2007 and 2009, and what happened to every other risk asset when that path reversed.
What the Carry Trade Actually Was
The setup was structural, not speculative. On March 9, 2006, the Bank of Japan formally ended the quantitative easing program that had held its policy rate at zero since 2001.[2] The overnight rate rose to 0.25 percent in July 2006 and stayed there through most of 2007. Across the Pacific, the Federal Reserve had lifted the federal funds rate seventeen consecutive times, from 1.00 percent in June 2004 to 5.25 percent in June 2006, where it held through mid-2007.
The interest differential between borrowing costs in yen and lending rates in dollars was five hundred basis points and stable. Add three to five turns of prime-brokerage leverage and the trade earned twenty to forty percent annualized in nominal yen terms, before any capital appreciation on whatever asset the borrowed dollars purchased. Hedge funds, prop desks, and Japanese retail investors — the so-called Mrs. Watanabe accounts — participated in scale. The Amro Analytical Note on JPY documents that by mid-2007, Japanese retail margin accounts alone held short JPY positions worth tens of billions of dollars.[3]
The trade worked as long as three conditions held. First, the yield gap had to stay wide. Second, the yen had to remain weak or continue depreciating. Third, financing had to remain available. Every one of those conditions broke between mid-2007 and late 2008. When they broke, the unwinding was mechanical.
Why It Was the Perfect Amplifier
Ordinary trades unwind gradually. Investors who took losses in a diversified equity portfolio in 2008 sold what they had to sell, absorbed the mark-to-market, and often stayed invested through the drawdown. The carry trade could not do that. The moment the yen strengthened, the borrower’s dollar-denominated asset was worth fewer yen. The moment the asset lost value, the loss compounded against a shrinking yen-value collateral base. Margin calls arrived in both currencies simultaneously.
The natural response to a margin call is to close the position. Closing a carry position means selling the risk asset for dollars, then buying yen to repay the loan. That mechanical yen purchase drove the currency higher. The higher yen went, the more expensive it became to hold any remaining short-yen position, which forced additional buying, which drove yen higher still. This is a feedback loop, not a market.
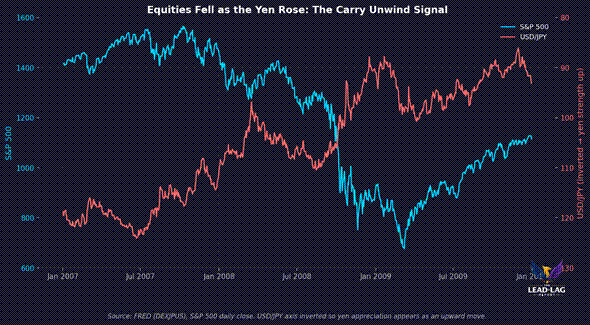
The IMF staff paper published in 2009 formalized this dynamic and reached a conclusion consensus has still not fully absorbed. Studying the daily co-movement of the dollar and financial variables through the crisis, the authors argued that the dollar’s post-Lehman rally and the deleveraging visible in credit spreads and equity drawdowns were, in their words, two sides of the same coin, both being the manifestations of the deleveraging of financial intermediaries.[4] The yen appreciation was the mirror image. Both currencies were funding currencies for global leveraged positions. Both strengthened as those positions unwound.
The Four Unwind Episodes
Look at what actually happened, one episode at a time. The first stress test came on February 27, 2007. The Shanghai composite fell nine percent in a single session on tax rumors and profit-taking. Bloomberg carried a China story that morning. By midday New York time, the S&P 500 was down 3.5 percent, USD/JPY had moved more than one and a half yen in a matter of hours, and the VIX had spiked from 11 to 18. The New York Fed’s Q1 2007 markets report catalogued the episode as a rapid unwind of yen-financed carry positions coinciding with the Shanghai selloff, not as a Chinese equity story.[5] Consensus called it a one-day event and moved on.
The second stress test was August 9, 2007. BNP Paribas suspended withdrawals from three funds citing an inability to price certain US mortgage-backed positions. Within two hours, dollar Libor spreads widened by 12 basis points, USD/JPY sold off two full yen, and the S&P 500 opened down 2.8 percent the following session. The carry trade did not fully close, but the participants who could exit did. Position sizes shrank measurably in the weeks that followed. This was the funding-cost condition breaking, not the yield-gap condition.
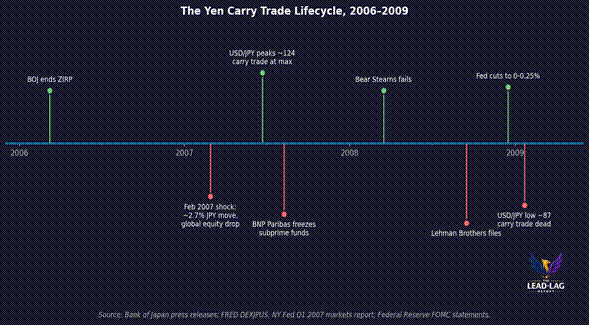
The third episode was March 2008. Bear Stearns was rescued by JPMorgan on March 16 in a deal engineered by the Federal Reserve. Between the failure signal in early March and the deal announcement, USD/JPY fell from 105 to 96, a nine percent move in ten trading sessions. The Bank of International Settlements documents that on October 7, 1998 — during the LTCM unwind — USD/JPY moved 7 percent in a single trading day, the largest one-day yen move ever recorded.[6] March 2008 approached that magnitude across a compressed window. This was not a Bear Stearns story. It was a carry-unwind story with Bear Stearns as the trigger.
The fourth and largest episode ran from September 15, 2008, when Lehman Brothers filed, through December of that year. USD/JPY fell from 108 the day before Lehman to below 90 by mid-December. Every major risk asset in the world moved in coordinated fashion. The S&P 500 fell 34 percent between the Lehman filing and the March 2009 low. The MSCI Emerging Markets index, tracked by the EEM ETF, fell 46 percent from its Lehman-eve level and 67 percent from its 2007 peak. Japanese exports fell 45 percent from 2008 peak to 2009 trough.[7] The correlation was not coincidence. It was the same trade being unwound in the same direction by the same participants.
What the Numbers Look Like Peak to Trough
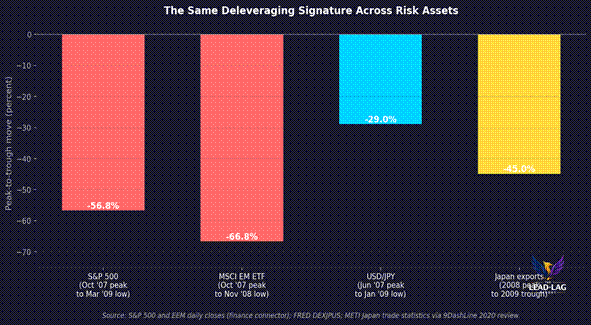
Consider the aggregate scale. USD/JPY moved from a June 2007 peak near 124 to a January 2009 low near 87, a 29 percent appreciation of the yen.[8] Over roughly the same window, US equities lost 57 percent from October 2007 peak to March 2009 trough. Emerging-market equities lost 67 percent from October 2007 peak to November 2008 trough. Japanese exports fell 45 percent from 2008 peak to their 2009 trough, more than half of that in the six months after Lehman.
These are not four separate events. They are four projections of the same event onto four different asset classes. When leveraged funding is withdrawn from a global position, the mark-to-market is imposed simultaneously on every asset that was held in that position, and on every asset held by counterparties to that position, and on every asset held by anyone who has to sell to meet a margin call on the first two. That is why the correlations spike in exactly the moments when diversification is supposed to help.
The Precedent Nobody Wanted to Study
The 2008 unwind was not the first of its kind. It was the second. The 1998 LTCM crisis was preceded by a similar structure, in which the yen carry trade had funded emerging-market and fixed-income arbitrage positions. When Russia defaulted in August 1998 and LTCM’s exposures required unwinding, USD/JPY collapsed by more than 15 percent in eight weeks, with the single-day 7 percent move on October 7. The pattern repeated in 2006, when the BOJ’s initial exit from quantitative easing triggered what one University of Pennsylvania paper documented as approximately seven trillion dollars of combined global equity and bond value destruction in the five weeks following the announcement.[9] Berkeley economist Maurice Obstfeld, in his March 2009 assessment of Japan’s economy from 1985 through 2008, described the yen’s behavior across the crisis as consistent with the country’s ongoing role as the world’s largest external creditor, whose currency strengthens on every episode of global risk withdrawal.[10]
The relevant point is not history. The relevant point is that the same structural setup exists today. The Bank of Japan has spent years slowly stepping away from yield curve control. The yield gap between yen borrowing costs and dollar returns has again been wide enough to support enormous leveraged positioning. The August 2024 mini-crisis, in which USD/JPY fell nearly ten percent in three weeks and dragged the Nikkei down twenty percent in a single week, was documented by the Bank for International Settlements as a modern-scale carry unwind, smaller than 2008 but structurally identical.[11] The precedent is not decorative.
What the Precedent Means for Positioning
The reverse carry trade is not itself a positioning recommendation. It is a lens for reading risk correlations. When funding currencies strengthen violently, diversification stops working. When Japanese equities and US equities and emerging-market equities all fall on the same day for the same reason, that reason is almost never a single-country story. It is almost always a global funding-condition story.
Portfolios that were structured for 2008 on the assumption that US housing was the risk failed. Portfolios that were structured for the underlying yen-funding correlation held. That distinction is worth preserving. Anti-beta positioning, treasury duration in the acute deleveraging window, and gold or yen exposure itself have historically absorbed the correlated shock better than any diversified equity allocation. The falsification condition for that view is straightforward. If the next global risk-off event produces yen weakness rather than yen strength, the correlation is broken and the framework needs revision. Until then, the yen remains the single most useful barometer of when leveraged positions are being unwound at the fund and prime-broker level, regardless of what story the headlines attach to the day.
The 2008 crash was not caused by subprime. It was catalyzed by subprime and amplified beyond all local proportion by the collapse of a funding trade that had grown to a scale nobody was tracking. That trade did not disappear after 2008. It reformed. It grew again. The same architecture that turned a housing loss into a global crash is still in place, waiting for the next credible trigger. The professionals who understood this in 2008 outperformed. The professionals who understood it as a China story or a bank story or a housing story got wrecked. Understanding the mechanism is not optional.
Few understand this.
— — —
Notes
[1] Bank for International Settlements. Estimates on the scale of yen-funded carry trade circa 2007. Cited in AMRO Analytical Note on JPY, 2022. https://www.amro-asia.org/wp-content/uploads/2022/09/AMRO-Analytical-Note-on-JPY_final.pdf
[2] Bank of Japan. Monetary policy decision, March 9, 2006, announcing end of quantitative easing program. https://www.boj.or.jp/en/announcements/release_2006/mpo0603a.htm
[3] ASEAN+3 Macroeconomic Research Office. “Analytical Note on the JPY: Anomaly of Recent JPY Depreciation.” September 2022. Section on retail carry positioning. https://www.amro-asia.org/wp-content/uploads/2022/09/AMRO-Analytical-Note-on-JPY_final.pdf
[4] International Monetary Fund. “The Dollar in the Crisis.” IMF Staff Papers, 2009. Two-sides-of-the-coin framing appears in the conclusion. https://www.elibrary.imf.org/view/journals/024/2009/002/article-A007-en.xml
[5] Federal Reserve Bank of New York. “Treasury and Federal Reserve Foreign Exchange Operations, Q1 2007.” Section on February 27 unwind. https://www.newyorkfed.org/medialibrary/media/newsevents/news/markets/2007/fxq107.pdf
[6] Curcuru, Sergio. “The Sensitivity of the U.S. Dollar Exchange Rate to Changes in Monetary Policy Expectations.” Bank for International Settlements IFC Conference, October 7, 1998 case study. https://www.bis.org/ifc/events/5ifcconf/curcuru.pdf
[7] 9DashLine. “The Japanese Yen in a Turbulent Global Economy.” Retrospective on 2008 export collapse. https://www.9dashline.com/article/the-japanese-yen-in-a-turbulent-global-economy
[8] Federal Reserve Economic Data. “Japanese Yen to One U.S. Dollar Spot Exchange Rate” (DEXJPUS), daily series 2005-2009. https://fred.stlouisfed.org/series/DEXJPUS
[9] University of Pennsylvania. “The Great Wall of Money and Its Discontents” (working paper archived by Penn ScholarlyCommons). Documentation of the 2006 BOJ exit and subsequent global value destruction. https://repository.upenn.edu/server/api/core/bitstreams/2f655559-7a06-4eb7-b8f3-ea387b8b4f02/content
[10] Obstfeld, Maurice. “Time of Troubles: The Yen and Japan’s Economy, 1985-2008.” University of California, Berkeley, March 2009. https://eml.berkeley.edu/~obstfeld/paper_march09.pdf
[11] Bank for International Settlements. “BIS Bulletin No. 90: The Market Turbulence and Carry Trade Unwind of August 2024.” https://www.bis.org/publ/bisbull90.pdf
The Lead-Lag Report is provided by Lead-Lag Publishing, LLC. All opinions and views mentioned in this report constitute our judgments as of the date of writing and are subject to change at any time. Information within this material is not intended to be used as a primary basis for investment decisions and should also not be construed as advice meeting the particular investment needs of any individual investor. Trading signals produced by the Lead-Lag Report are independent of other services provided by Lead-Lag Publishing, LLC or its affiliates, and positioning of accounts under their management may differ. Please remember that investing involves risk, including loss of principal, and past performance may not be indicative of future results. Lead-Lag Publishing, LLC, its members, officers, directors and employees expressly disclaim all liability in respect to actions taken based on any or all of the information on this writing.