
The Signals Saw It Coming
Three of four risk-off signals front-ran the geopolitical shock. The US-Iran conflict and resulting oil spike were the event risk that Utilities, Treasuries, and Gold had been pricing in for weeks.

MARKET COMMENTARY
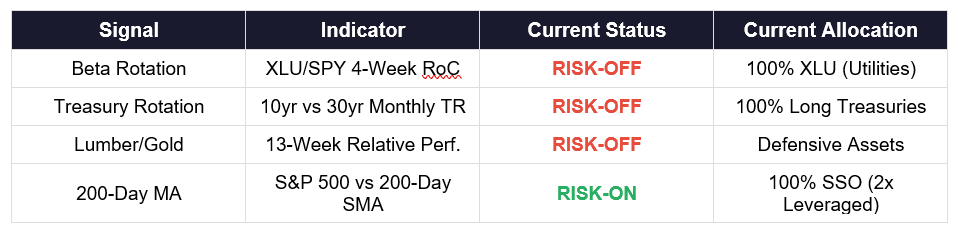
As we enter March, three of our four primary intermarket signals are flashing Risk-Off — and this time, the signals proved prescient. The escalating US-Iran conflict and the resulting spike in crude oil prices were precisely the kind of exogenous shock that our intermarket indicators had been warning about for weeks. The rotation into Utilities, the bid for long-duration Treasuries, and Gold’s relentless ascent were not noise. They were the market quietly positioning for a geopolitical event that has now arrived.
The sole holdout remains the 200-Day Moving Average signal, which stays Risk-On as the S&P 500 trades 4.9% above its 200-day simple moving average at 6,878.89 versus 6,559.93. But the divergence between a still-intact price trend and the deteriorating intermarket backdrop is itself the story: the headline index held up even as the internals rotated aggressively toward defense.
The most notable development continues to be the strength in Utilities relative to the broader S&P 500. The XLU/SPY ratio’s 4-week rate of change surged to +11.32%, a decisive Risk-Off reading that suggests institutional capital had already been rotating toward defensive, income-oriented sectors well before the oil shock made front-page news. Historically, Utilities outperformance of this magnitude has preceded periods of market weakness or consolidation — and in this case, the catalyst is now clear.
The Treasury signal confirms the flight to safety. Long-duration Treasuries (TLT) returned +4.24% in February, sharply outperforming intermediate-duration bonds (IEF) at +2.14%. Investors bidding up the safest duration assets is a classic risk-aversion response, and the US-Iran escalation only reinforces the bid for quality. When geopolitical risk rises, the long end of the Treasury curve tends to outperform, and that is exactly what we are seeing.
Perhaps most telling is the Lumber/Gold divergence. Gold has returned +25.03% over the past 13 weeks while Lumber has returned just +7.08%. Gold’s surge to record highs near $5,278/oz reflects a confluence of safe-haven demand, fears of energy-driven inflation, and the geopolitical premium now being priced into the commodity complex following the US-Iran confrontation. Meanwhile, Lumber — a cyclically-sensitive commodity tied to housing and construction — has lagged badly, signaling that the real economy may bear the brunt of higher energy costs. All seven Lumber/Gold sub-strategies are currently positioned defensively.
The oil spike is the connective tissue across all three Risk-Off signals. Rising crude prices act as a tax on consumers and corporations alike, compressing margins, dampening growth expectations, and driving capital toward safe havens. The intermarket framework captured this risk rotation weeks before the geopolitical flashpoint, which is precisely what these signals are designed to do: lead, not lag.
SIGNAL 1: BETA ROTATION
Based on: “Opposing Behavioral Forces: Beta Rotation” (SSRN 2417974)
Target Investor: Self-directed investors who want to capture relative strength between equity market segments. This signal uses the 4-week rate of change of the Utilities-to-S&P 500 price ratio to determine whether the market favors offense (broad equity) or defense (Utilities).
CURRENT INDICATOR: RISK-OFF
XLU/SPY 4-Week Rate of Change: 11.32%
Current Allocation: 100% XLU (Utilities Select Sector SPDR)
