
The Warsh Regime Meets Day 130
A Fed that refuses to guide runs headlong into a Hormuz supply shock, and the market must price both at once.

Today’s Lead-Lag Report post is sponsored by Tuttle Capital

If you have not registered yet, the link is below.
The recording goes to registered attendees only.
What you will get on the call:
● The permanent portfolio framework walked through end to end, conceptually
● Where Browne’s original assumptions hold up and where they break
● How to think about forecast-independent allocation in the current regime
● Live Q and A with Matt, Porter and Frances
● CE credit submission for anyone holding the CFP, CIMA, or equivalent designation
DISCLAIMER — PLEASE READ: This is sponsored advertising content for which Lead-Lag Publishing, LLC is being paid a fee. The information provided is solely the creation of Tuttle Capital. Lead-Lag Publishing, LLC does not guarantee the accuracy or completeness of the information provided or make any representation as to its quality. All statements and expressions provided are the sole opinion of Tuttle Capital and Lead-Lag Publishing, LLC expressly disclaims any responsibility for action taken in connection with the information provided.
The Warsh Regime Meets Day 130
Key Highlights
· WTI’s +5.2% jump into Wednesday broke the week-long “Hormuz reopening” story precisely on Day 130, validated in real time by tanker strikes and a revoked U.S. Iranian-oil license.
· Warsh’s refusal to give forward guidance has left the bond market to do the Fed’s work: 2s10s steepened toward roughly 78–80bp as September-hike odds ran a wide 55–70% band — near 70% right after Warsh’s July 1 Sintra remarks (Fed funds futures, Jul 2), then compressing to ~55% by Tuesday’s payrolls (CME FedWatch, Jul 7).
· Samsung’s 19-fold profit guide became a sell trigger, not a buy signal — KOSPI’s Tuesday circuit breaker (its sixth of 2026) dragged the SOX down about 5% even as the VIX barely twitched.
Let me lead with the contradiction that defines this week: the Federal Reserve that promised to stop telling you what comes next just watched a supply-side shock detonate on its doorstep, and the market now has to price two regimes at once. On Jul 2 we put “The Warsh Regime” on the record — a chair who has pledged fewer meetings, less dot-plot theater, and no hand-holding forward guidance. The wager underneath that thesis was always that a Fed which refuses to guide forces the bond market to guide itself. This week the wager collided with the one variable no central banker controls: a barrel of oil moving on a projectile fired near the Strait of Hormuz. WTI’s better-than-5% jump into Wednesday, matching Tuesday’s tanker strikes and the U.S. Treasury’s revocation of the Iranian-oil license, is not a separate story from the rate path. It is the Warsh regime playing out in real time.
Start with the U.S. tape, because the surface calm is doing a lot of lying. Monday was an AI-and-comms melt-up: the S&P 500 rose 0.72% to 7,537.43, the Nasdaq Composite added 1.12% to 26,121.16, and the Dow Jones Industrial Average reclaimed the 53,000 level to close at 53,055.91, its 21st record close of the year, per the AP’s closing wire and the WSJ live coverage. I want to be precise about that Dow print — it reclaimed and extended a record run that first crossed 50,000 back in February, not some virgin milestone; the index has been reclaiming round numbers all year. Chart 1 tells the real story of 2026 in one frame: the Russell 2000, up 21.3% year to date, remains the leadership index, while the PHLX Semiconductor Index has been the manic-depressive of the group — the widest swings, the highest highs, and now the sharpest air pockets.
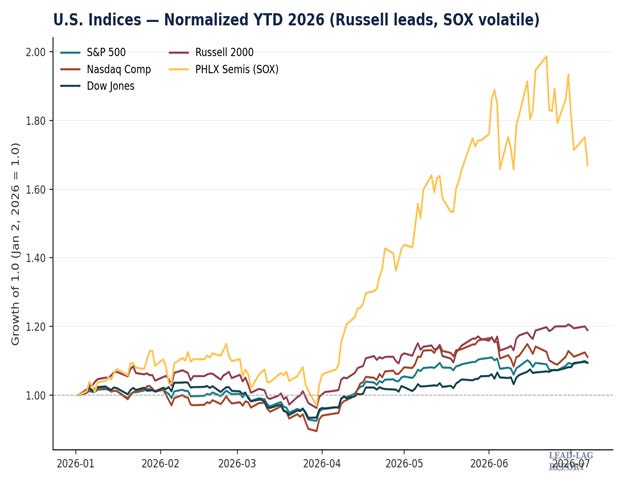
Because by Tuesday the melt-up curdled. The S&P slipped 0.4% to 7,503.85 and the Nasdaq gave back 1.2% to 25,818.69, but the index-level moves undersell the damage underneath. The SOX fell roughly 5% on the session, leaving it about 15% below the peak it set the prior Tuesday, with AMD off 6.5%, Intel down 9.7%, and Micron off 4.7% on AP’s wire. The trigger was not a miss — it was a beat. Samsung guided a roughly 19-fold surge in Q2 operating profit and its Seoul shares fell nearly 7% anyway, exporting the selloff straight into U.S. chip names. That is the tell: when a 19-fold profit guide becomes the reason to sell, the market is no longer trading earnings, it is trading the durability of the AI-capex cycle itself. Monday’s breadth agreed — decliners beat advancers 1.3-to-1 even as the index rose, with defensives like Health Care and Utilities leading while XLK fell.
And yet the VIX would not confirm any of it, closing 15.60 Tuesday against 15.57 Monday — a rounding error while the most important sector in the market convulsed. In my view that gap between a violent single-sector unwind and a comatose volatility complex is the divergence between price and perceived risk that always precedes a repricing. Either the options market is complacent about a genuine AI-durability reset, or the damage is narrow enough — a handful of megacap and semis names — that it isn’t yet systemic. I don’t think you get to stay agnostic on that question for long. Underneath, the ISM Services PMI printed 54.0 for June, a 24th straight month of expansion, and the funds rate sat at 3.50%–3.75% after the June hold. This is not a market with a growth problem. It is a market with a certainty problem, and the man who removed the certainty did so on purpose.
(Continued for paid subscribers)
Cross the oceans and the same fatigue shows up in the developed world, dressed as new records. Chart 2 normalizes the majors to Jan 2, and the Nikkei 225 is the standout — a parabola that touched all-time highs above 70,000 the prior week before this week’s reversal. On Tuesday the Nikkei fell 2.12% to 68,256.96, tracking the Korean contagion rather than any domestic catalyst. Europe’s picture is subtler: the DAX set an intraday record near 25,900 on Monday before sliding 1.24% to 25,497.83 Tuesday, and the Stoxx 600 sat essentially flat at 650.84, one point below its Jul 3 closing record. Verified against primary exchange data, these are records losing their leadership rather than extending it — Siemens Energy fell 5.5% on an AI-equipment downgrade while defense names like Saab climbed on a NATO-summit bid.
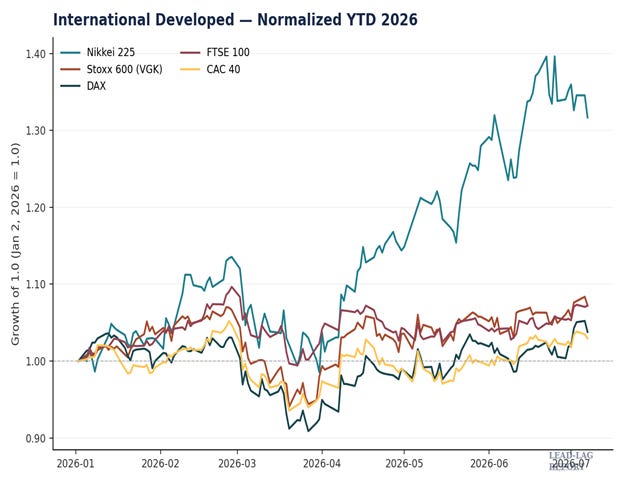
The yen is the other developed-market tell, and here I want to correct the reflex. USD/JPY closed Tuesday at 161.89, and the cycle low remains 162.83–162.84 set Jun 30 — the pair did not tag 165 this week, despite the intervention chatter. The entire week’s yen strength tracked dollar softness, not Tokyo action; the Ministry of Finance has disclosed no July intervention, and its last confirmed window closed Jun 26. OCBC put it bluntly to Reuters: verbal warnings and even outright intervention are unlikely to reverse the pair without a shift in underlying fundamentals, and large pools are buying short-dated dollar puts as insurance rather than de-risking their dollar longs. The dollar index itself, verified via yfinance, closed at 101.087, down 0.27% on the week. The market is treating MoF as a volatility event to hedge, not a directional threat — borrowed time for anyone short the dollar on intervention hopes alone.
Emerging markets is where the AI-durability question turned violent. Chart 3 shows the KOSPI’s staggering 2026 — up roughly 82% year to date even after this week — and its equally staggering break. Tuesday the KOSPI plunged 4.9% to 7,656.31 after falling as much as 8.2% intraday, triggering its second circuit breaker in two trading sessions and the sixth of 2026. Samsung’s blowout-guide-turned-selloff and LG Energy Solution’s warning of a 77% profit drop did the damage; Taiwan’s TAIEX fell 1.27% and Japan’s Kioxia dropped over 10% in sympathy. This is the same chip-durability skepticism that hit the SOX, only levered up by record Korean retail margin debt near 29.7 trillion won.
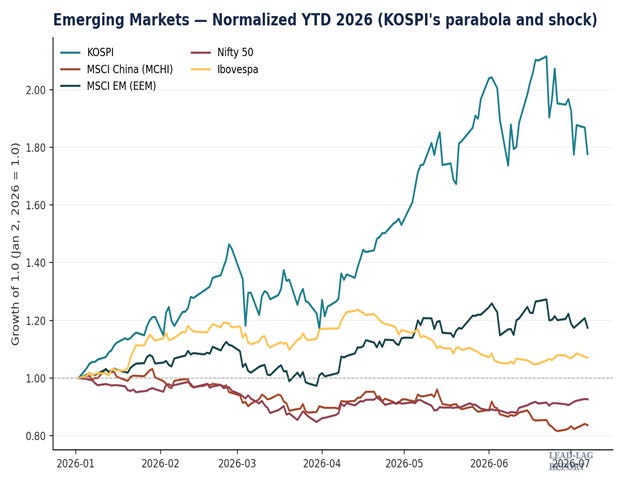
But the contrarian read is in the currency. The won firmed even as equities cratered, which tells you this was a sector-specific positioning shakeout in semiconductors, not capital flight from Korea. India confirmed the pattern in miniature — the Nifty 50 slipped 0.13% to 24,398.70 and the Sensex eased 0.13% to 78,180.72 as weak Asian cues offset a firm domestic open, with the RBI repo rate unchanged at 5.25%. China stayed the marquee non-event: MSCI China sits at roughly -14.65% year to date, essentially flat on the week, even as the PBoC injected a full trillion yuan via reverse repo on Jul 6. When a trillion-yuan liquidity add fails to move onshore equities, the “China divergence” story isn’t widening — it’s stalling. Note too that the MSCI EM benchmark reads +23.85% year to date on the Jun 30 USD-net factsheet, below the +26.35% our own baseline carried; the discrepancy is a return-series artifact worth standardizing, not a real move.
Which brings us to the asset class quietly screaming the whole thesis: oil. Chart 4 normalizes the dollar, yen, gold, Bitcoin, and Brent, and the crude line is the one that just changed direction. Front-month September Brent settled $71.99 Monday and NYMEX August WTI settled $68.55; by Tuesday, after UKMTO reported three tankers struck near Hormuz and the Treasury revoked the Iranian-oil license with a Jul 17 wind-down, Brent gained to $72.75 and WTI to $69.28 intraday, with the broader move topping 5% into Wednesday. This landed on Day 130 of the Hormuz closure — the exact checkpoint we flagged in the Jul 2 edition. Every headline from Jul 1 through Jul 6 treated the strait as normalizing, with OPEC+ adding 188,000 bpd for August into an emerging surplus. The reopening narrative broke in real time, on the day we said to watch.
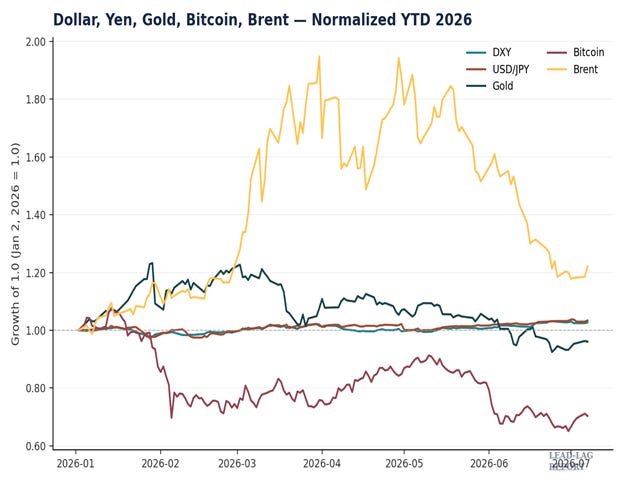
Gold, meanwhile, refuses to cooperate with either bull or bear. COMEX August futures eased 0.4% to $4,149.90 Tuesday after touching $4,186.80 Monday — a bounce off the Jun 24 quarter-low that leaves the metal well below its January all-time settlement near $5,318, roughly a 22% drawdown depending on the contract you cite. Here is the problem for the bounce: real 10-year TIPS yields rose from 2.25% to 2.26% even as nominal gold rallied, the opposite of the textbook relationship. The market is missing that gold’s move looks like short-covering into Wednesday’s FOMC minutes rather than genuine re-accumulation. Bitcoin held near $64,000, down roughly 28–30% on the year, and Ether languished near $1,800 — neither the inflation hedge nor the risk asset is behaving as advertised. The through-line across all four charts is a market that has lost its anchor because the Fed removed one on purpose, and a supply shock arrived to fill the vacuum.
Here is what I’m watching next week. First, the Jul 14 bank earnings — JPMorgan, Wells Fargo, Citigroup, and Bank of America kick off Q2 season, and after a quarter of AI-capex euphoria the tell will be loan-loss provisioning and net interest margin guidance, not headline beats. Second, the Jul 15 CPI (per current BLS release calendar) print, the single most important data point for whether the bond market’s self-directed steepening becomes self-fulfilling pressure before Warsh’s Jul 28–29 FOMC. Third, any Fed speaker willing to fill the guidance vacuum — in the Warsh regime, every off-hand remark now carries the weight the dot plot used to. And fourth, the Jul 17 Treasury wind-down deadline on Iranian oil: if Hormuz Day 130 was the break, Day 139 is the enforcement test, and the market will find out whether the risk premium that just returned to crude is a one-day spasm or the start of the supply-side regime the Warsh Fed cannot control.
The Lead-Lag Report is provided by Lead-Lag Publishing, LLC. All opinions and views mentioned in this report constitute our judgments as of the date of writing and are subject to change at any time. Information within this material is not intended to be used as a primary basis for investment decisions and should also not be construed as advice meeting the particular investment needs of any individual investor. Trading signals produced by the Lead-Lag Report are independent of other services provided by Lead-Lag Publishing, LLC or its affiliates, and positioning of accounts under their management may differ. Please remember that investing involves risk, including loss of principal, and past performance may not be indicative of future results. Lead-Lag Publishing, LLC, its members, officers, directors and employees expressly disclaim all liability in respect to actions taken based on any or all of the information on this writing.