

How To Interpret the Signals: Within each strategy, there is a risk-on and risk-off investment recommendation, with the risk-off option being the more conservative of the two. When a particular signal indicates that investors should be risk-off, for example, subscribers should consider investing in the risk-off option and avoiding the risk-on option. The opposite, therefore, would be true when the signal flips to risk-on. In each strategy, you’d always be invested in one option or the other.
Here’s how to read the scorecard for each strategy:

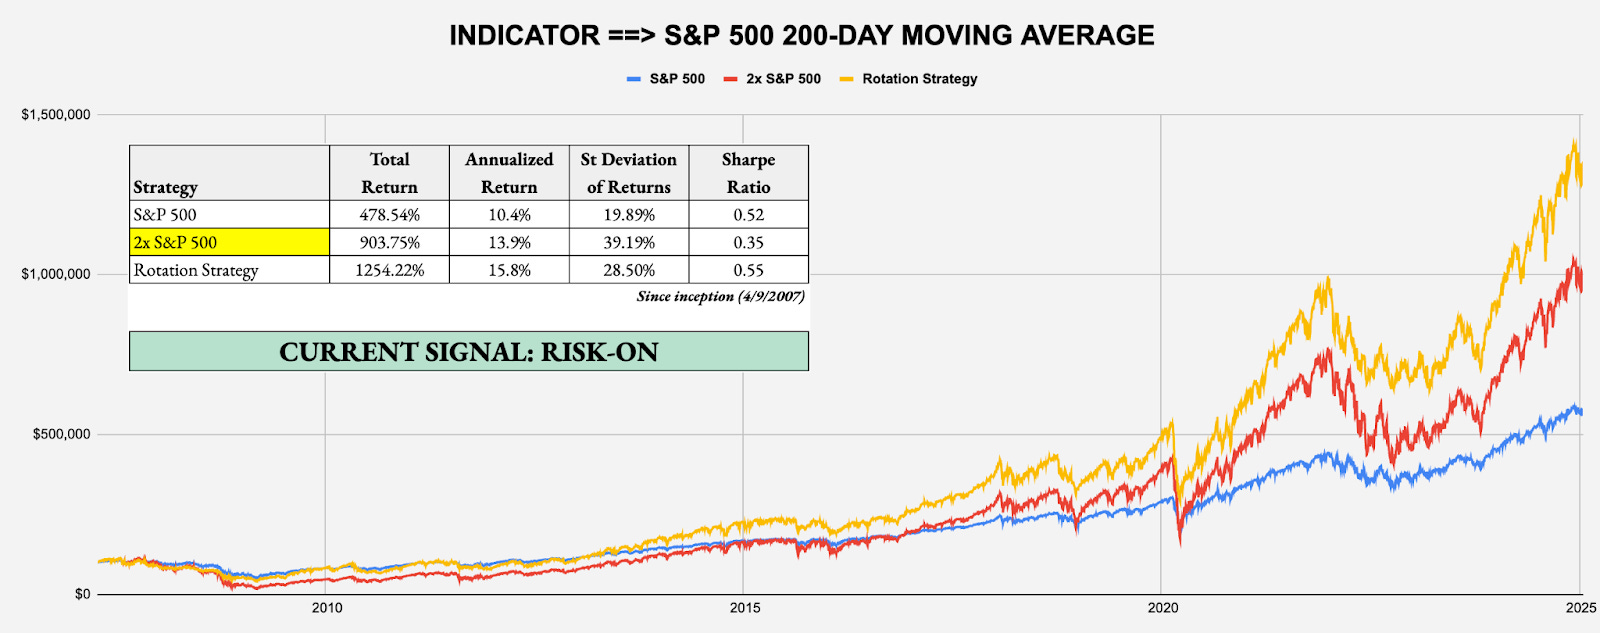
Some of the strategies will be more aggressive than others. The “Leverage For The Long Run” strategy, for example, uses the S&P 500 and 2x-leveraged S&P 500. The more conservative “Lumber/Gold Bond” strategy, however, uses intermediate-term Treasuries and the S&P 500. In every case, a risk-off signal indicates that you should be invested in the more conservative of the two options, while a risk-on signal indicates you should be invested in the more aggressive one.
For a full user's guide on how to interpret each of the signals and how to put them to work in your portfolio, please click HERE.
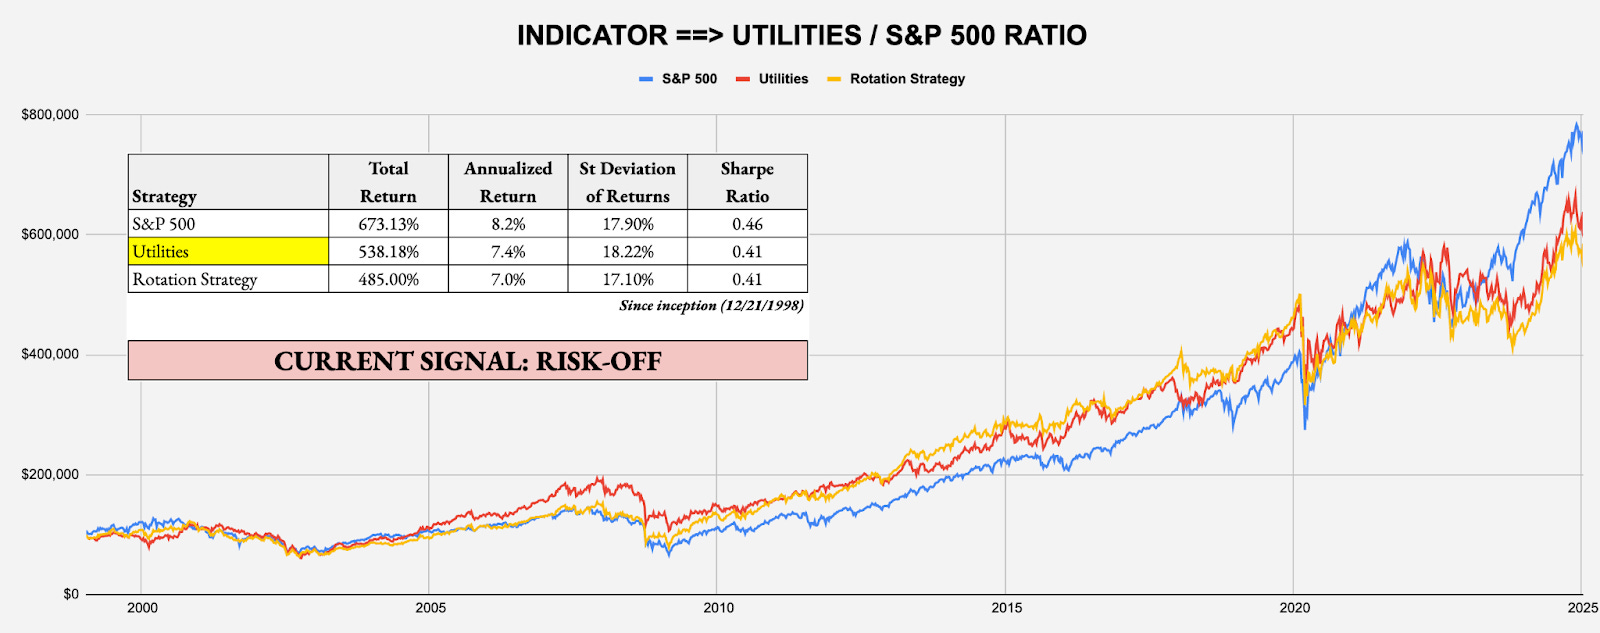
SHORT-TERM SIGNAL: UTILITIES/S&P 500 RATIO
Target Investor: Short-term traders with a higher risk tolerance interested in using an equity momentum strategy to anticipate changes in market risk tolerance.
Current Indicator: Risk-Off
Strategy: Beta Rotation - Example: Invest in Utilities (XLU) over S&P 500 (SPY)
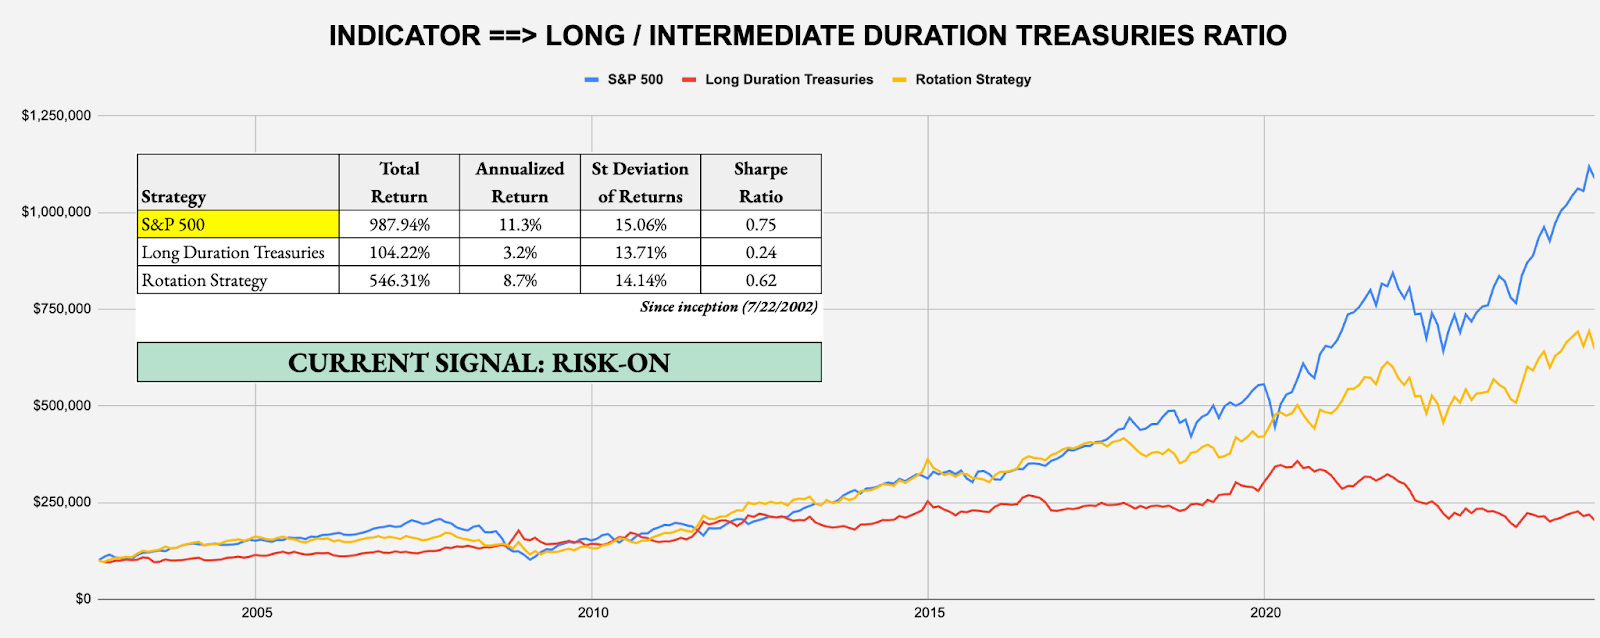
SHORT-TERM SIGNAL: LONG DURATION/INTERMEDIATE DURATION TREASURIES RATIO
Target Investor: Short-term traders with a higher risk tolerance who want to use the activity in the U.S. Treasury market to judge overall risk levels.
Current Indicator: Risk-On
Strategy: Tactical Risk Rotation - Example: Invest in S&P 500 (SPY) over Long-Duration Treasuries (VLGSX)
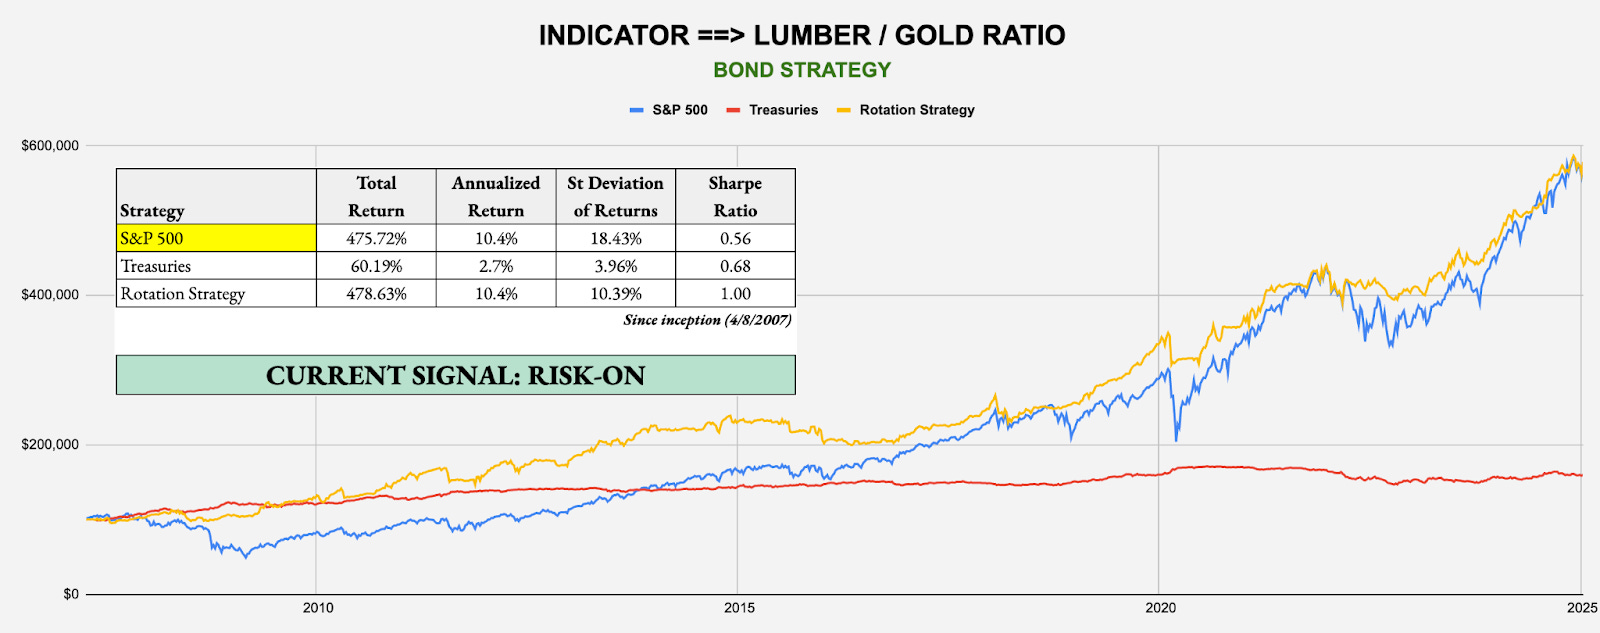
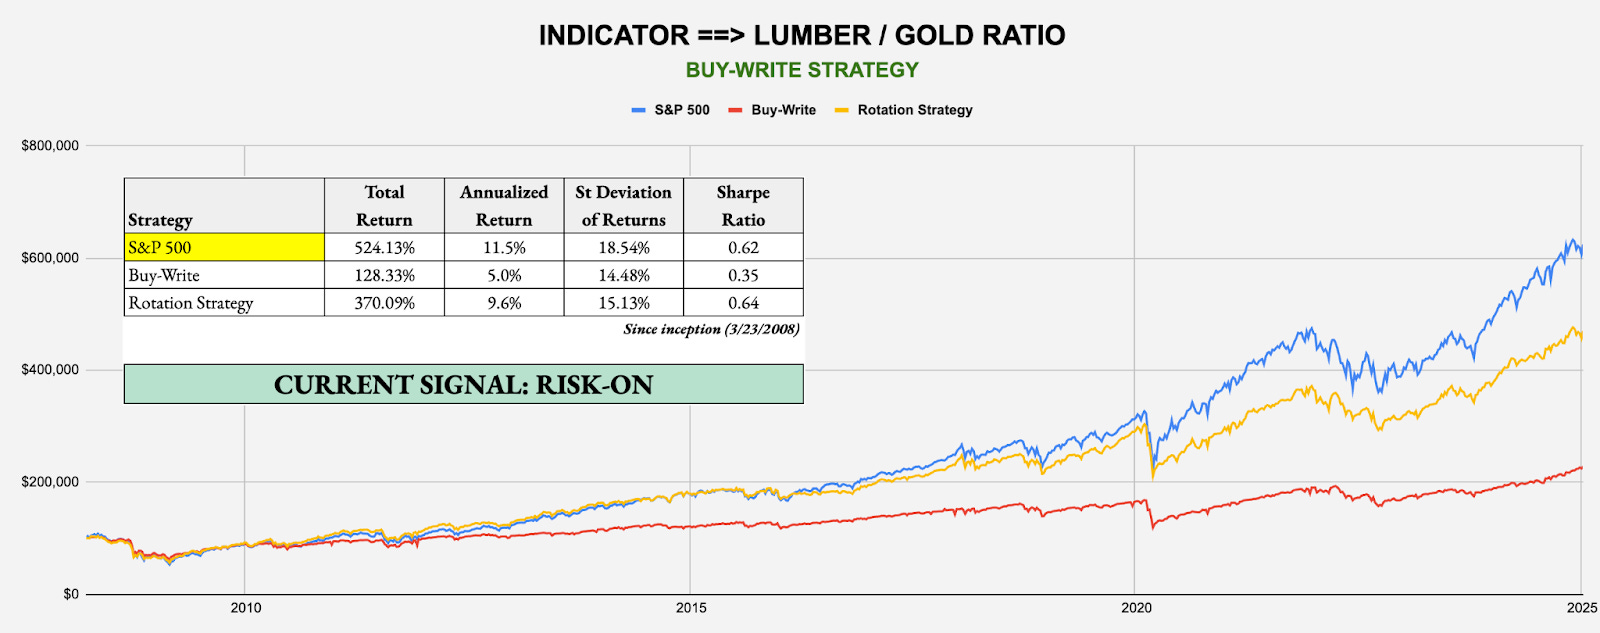
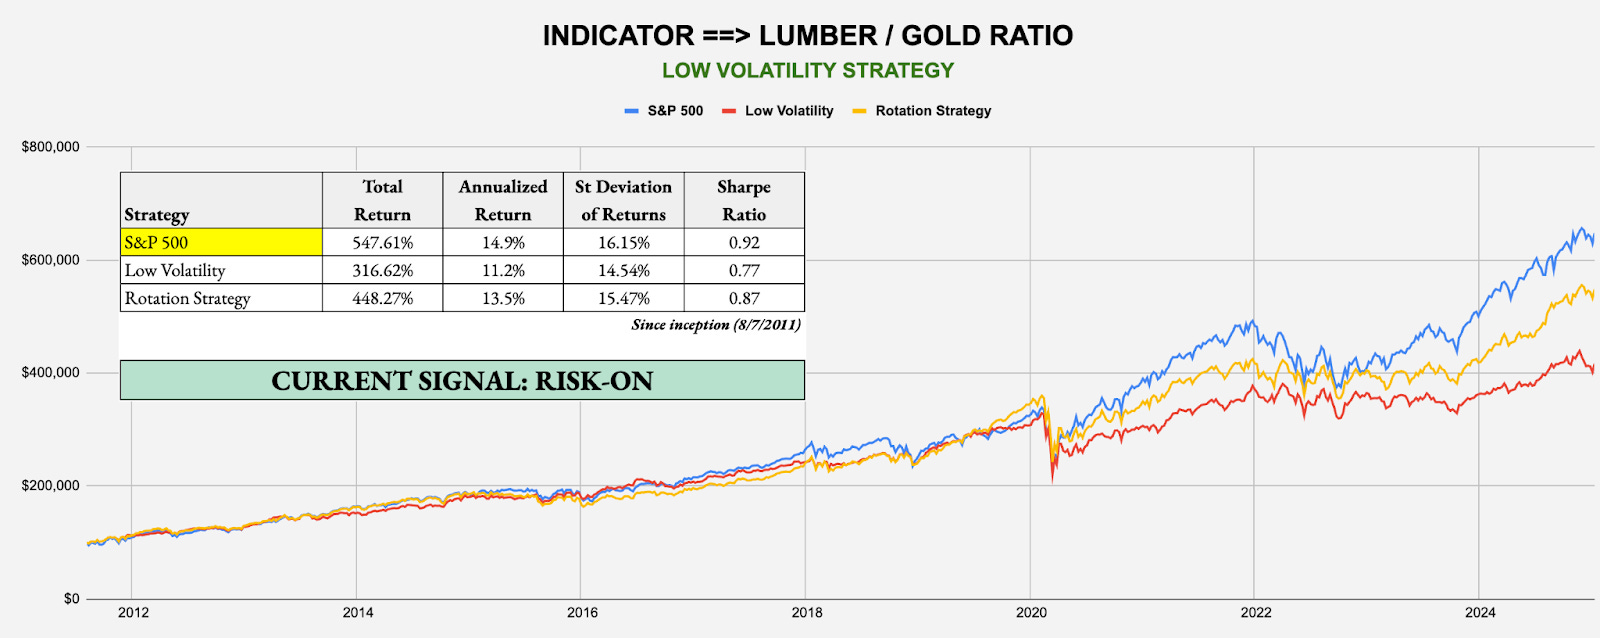
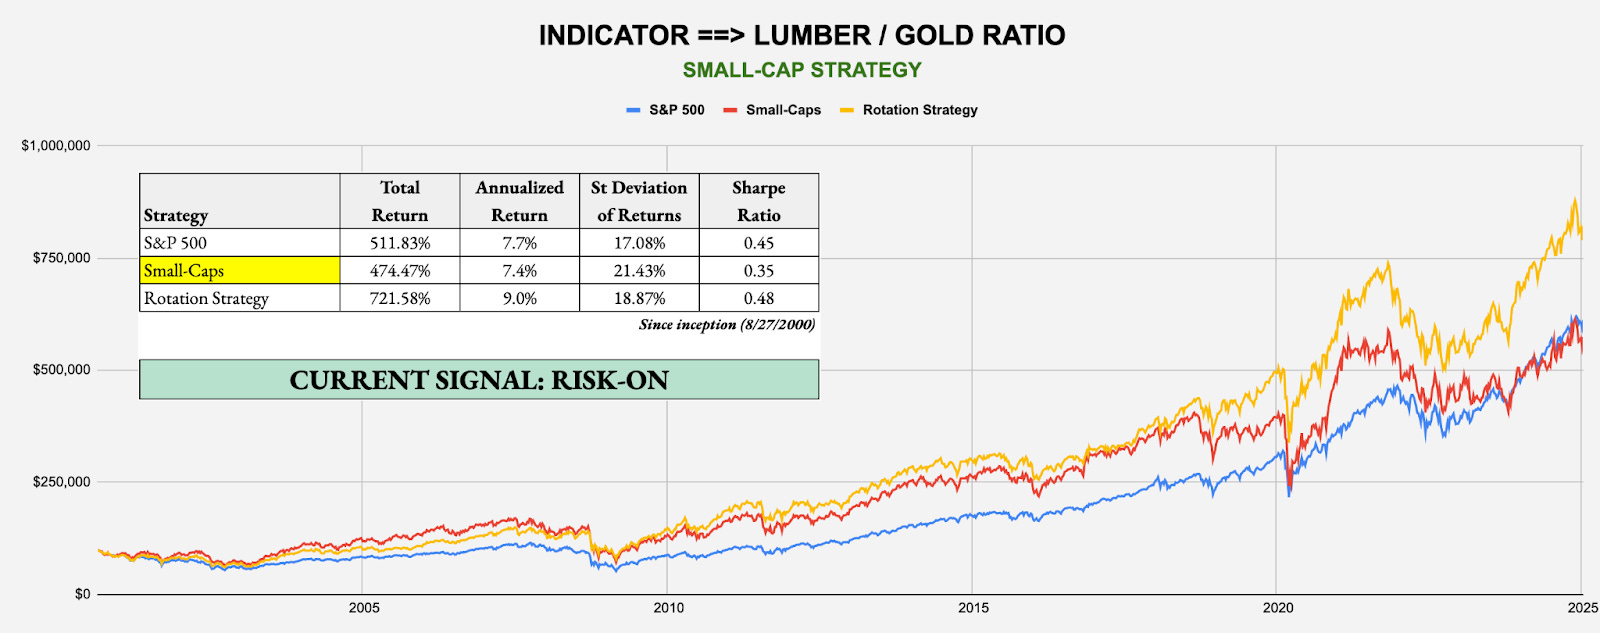
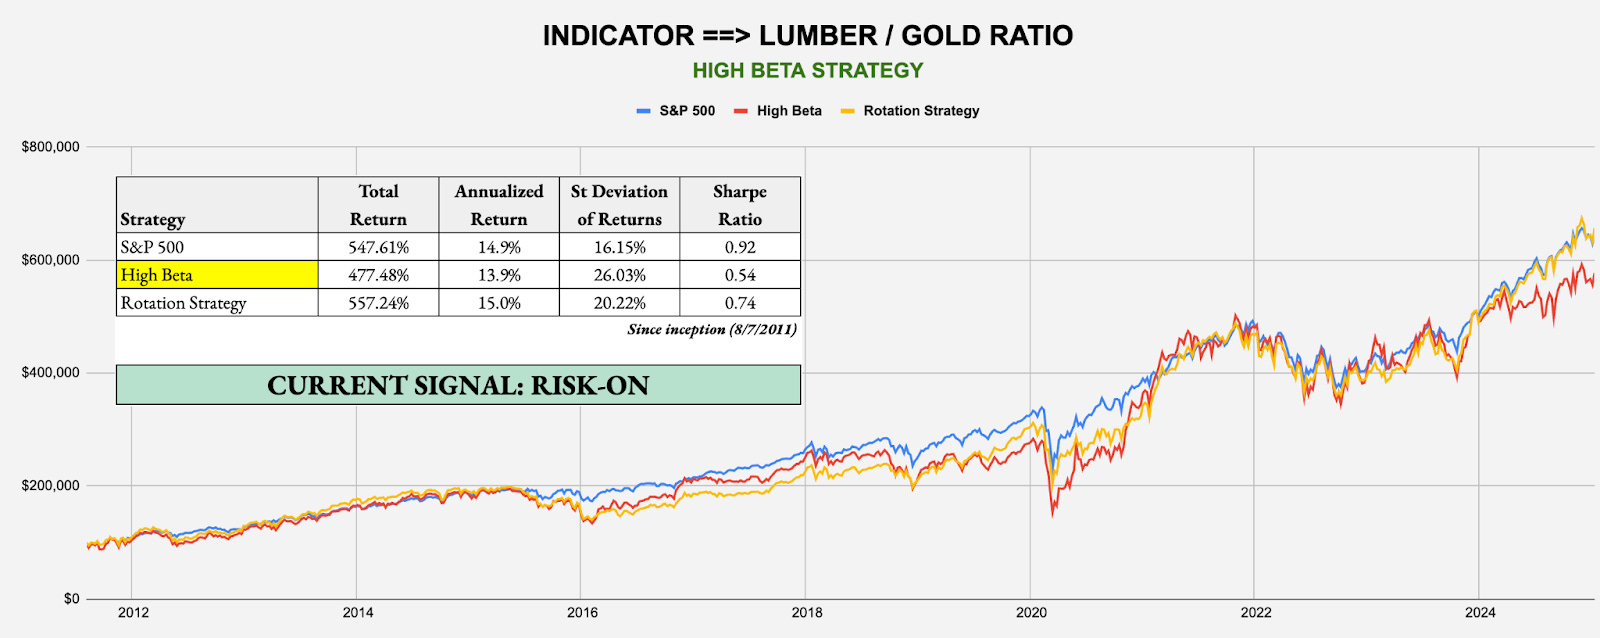
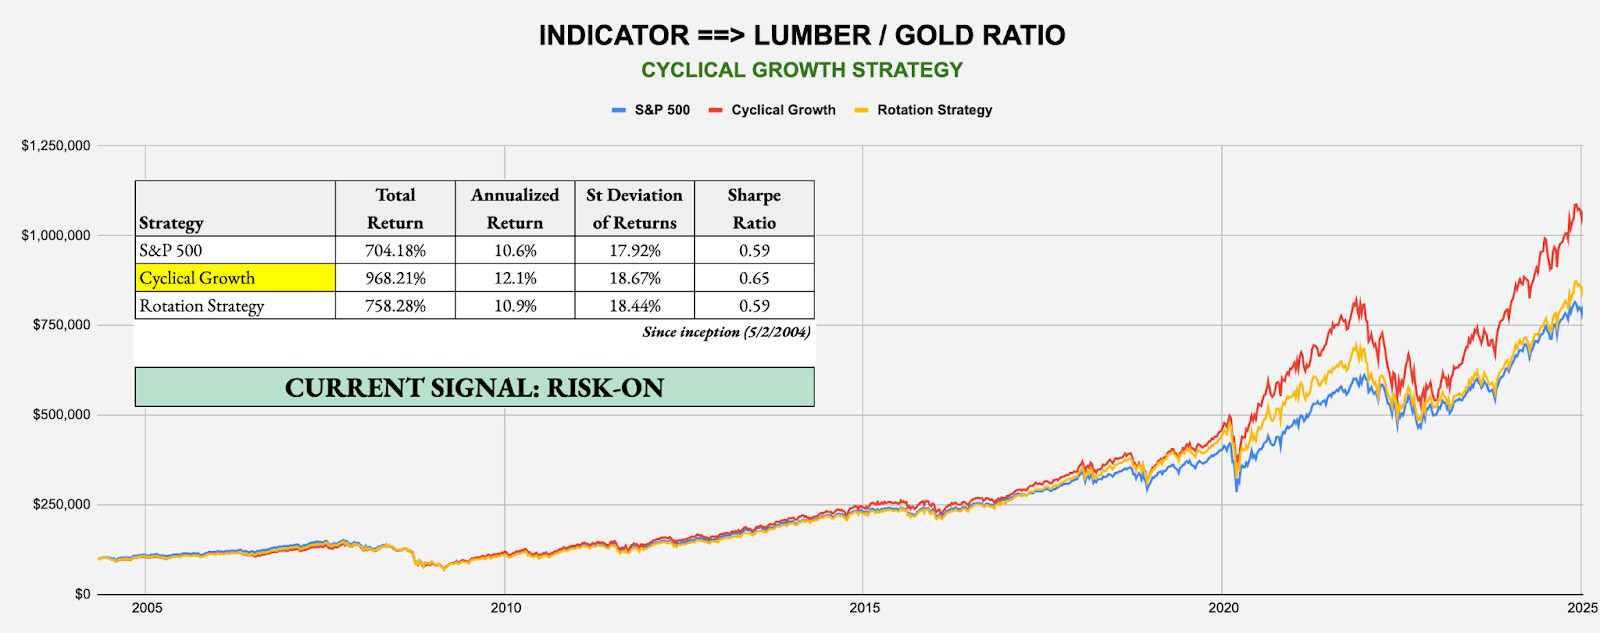
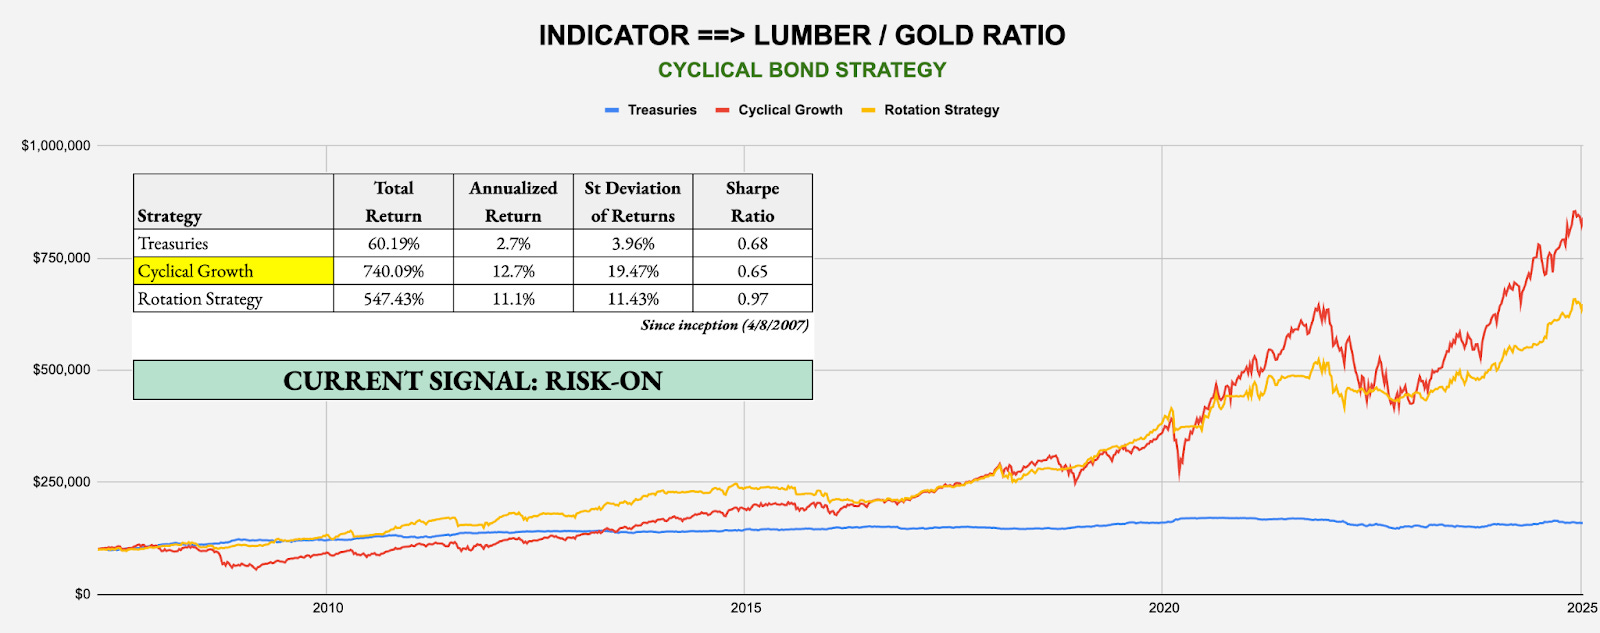
INTERMEDIATE-TERM SIGNAL: LUMBER/GOLD RATIO
Target Investor: Short- and long-term investors willing to trade more frequently using the classic cyclical vs. defensive asset comparison.
Current Indicator: Risk-On
Strategy: Lumber/Gold Bond - Example: Invest in S&P 500 (SPY) over Treasuries (GOVT)
Special Announcement
Mind the gap!
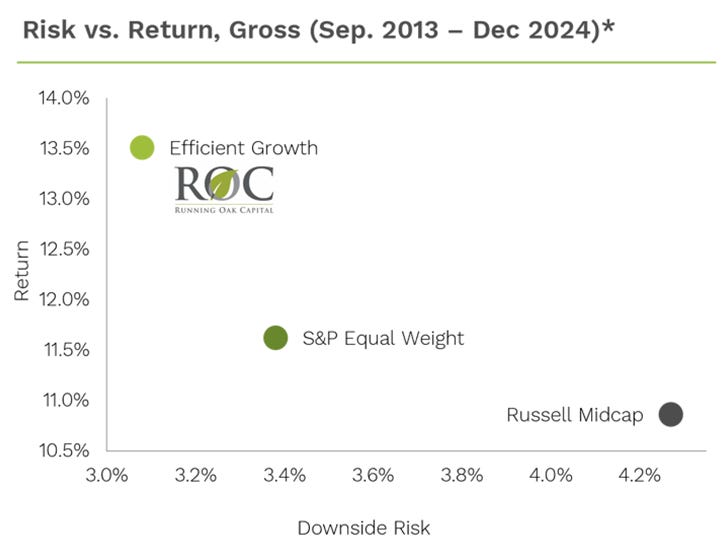
A substantial, oft-unnoticed gap currently exists in the center of the typical equity allocation. Running Oak's Efficient Growth strategy fills that hole like few do, providing significant value like even fewer do.
Why Invest in Efficient Growth:
Top 2-3 percentile: Running Oak’s Efficient Growth separate account has performed in the top 2 to 3% of all Mid Cap core funds in Morningstar's database over the last 10 years, net of fees.1
Since inception, Efficient Growth has provided 26% more return than the S&P 500 Equal Weight Index and 69% more return than the Russell Mid Cap Index, given the same level of downside risk, gross of fees. (Ulcer Performance Index) 1
Outperforming | Opportune – Mid Cap
The standard equity allocation leaves a large gap in upper Mid, lower Large Cap.2
Mid Cap companies have outperformed Large Cap by 0.54%, annualized, over the last roughly 33 years and outperformed Small by 1.85%.3
Mid Cap stocks are roughly 10% undervalued, per the asset class's CAPE ratio. Large Cap is overvalued by 50 to 100%, depending upon the source. 4
How to Invest
Efficient Growth is currently available as an SMA and ETF. (ETF specifics and audited historical performance can't be shared in the same note. Please reach out for the ticker or more information at seth@runningoak.com.)
In just 18 months, The ETF Which Shall Not Be Named has grown over 13,000% since launch – from 2 to 270mm.
All opinions expressed in this newsletter are those of Running Oak Capital’s and do not constitute investment advice.
1For additional data and context regarding the claims made within this email, please refer to the Disclosures and Additional Data document located here.
2Statements on the standard equity allocation are based on informal feedback and experience from interactions with investors and other financial professionals.
3Invesco: "Why Mid Caps Now"
4Ned Davis Research
Investment Advisory Services are offered through Running Oak Capital, a registered investment adviser.
*Past performance is no guarantee of future results. Performance expectations are no guarantee of future results; they reflect educated guesses that may or may not come to fruition. All indices are unmanaged and may not be invested into directly.
The Standard & Poor’s 500 Index is a capitalization weighted index of 500 stocks designed to measure performance of the broad domestic economy through changes in the aggregate market value of 500 stocks representing all major industries.
The opinions voiced in this material are for general information only and are not intended to provide specific advice or recommendations for any individual. To determine which investments and strategies may be appropriate for you, consult with us at Running Oak Capital or another trusted investment adviser.
Statements on the standard equity allocation are based on informal feedback and experience from interactions with investors and other financial professionals.
Stock prices and index returns provided by Standard & Poor’s.
DISCLAIMER – PLEASE READ: This is sponsored advertising content for which Lead-Lag Publishing, LLC has been paid a fee. The information provided in the link is solely the creation of Running Oak. Lead-Lag Publishing, LLC does not guarantee the accuracy or completeness of the information provided in the link or make any representation as to its quality. All statements and expressions provided in the link are the sole opinion of Running Oak and Lead-Lag Publishing, LLC expressly disclaims any responsibility for action taken in connection with the information provided in the link.
Strategy: Lumber/Gold Buy-Write - Example: Invest in S&P 500 (SPY) over Buy-Write (PBP)
Strategy: Lumber/Gold Low Volatility - Example: Invest in S&P 500 (SPY) over Low Volatility (SPLV)
Strategy: Lumber/Gold Small-Cap - Example: Invest in Small-Caps (VSMAX) over Large-Caps (SPY)
Strategy: Lumber/Gold High Beta - Example: Invest in High Beta (SPHB) over S&P 500 (SPY)
Strategy: Lumber/Gold Cyclical Growth - Example: Invest in Growth (VUG) over S&P 500 (SPY)
Strategy: Lumber/Gold Cyclical Bond - Example: Invest in Growth (VUG) over Treasuries (GOVT)
LONG-TERM SIGNAL: S&P 500 200-DAY MOVING AVERAGE
Target Investor: Long-term investors with a higher risk tolerance willing to move to an aggressive strategy when the signal flips to risk-on.
Current Indicator: Risk-On
Strategy: Leverage For The Long Run - Example: Invest in 2x-Leveraged S&P 500 (SSO) over S&P 500 (SPY)
About the Signals: The above trade signals and allocations are taken directly from each of the four award winning white papers I authored, which can be individually read at https://papers.ssrn.com/sol3/cf_dev/AbsByAuth.cfm?per_id=2224980. The underlying commonality across all risk-on/off signals and backtested strategies from these papers is the same: what matters isn’t being up more, but rather being down less. Each strategy historically has significantly outperformed through the avoidance of major drawdowns and volatile periods. The signals can change often from week to week, so it’s important to keep checking The Lead-Lag Report for updates. While not every trade and not every signal will be right, cumulatively over time, the identification of conditions that favor an accident in the stock market can help you slow down entering the storm, even if no one knows the exact mile marker where a crash might occur.
CONCLUSION
While market sentiment (including these signals) mostly remain positive and were no doubt boosted by last week’s tepid inflation data, this week has the potential to upend things again.
Perhaps the biggest event of the week has nothing to do with the markets at all and that’s the inauguration of president-elect Trump. This could be the week where he officially begins making policy announcements, including some having a market impact, such immigration and tariffs. The rhetoric surrounding tariffs has gone from aggressive to more measured in recent weeks, but expect it to get a lot of attention throughout the rest of this month and beyond.
The other big event is the BoJ meeting late in the week. The expectation is that it will raise rates by a quarter-point and that has the potential to create volatility not just in the forex market but in the risk asset markets as well. I’ve long argued that the reverse yen carry trade isn’t over, it just needs a catalyst to restart. A rate hike this week could be it. The yen has strengthened modestly over the past week, but not to the degree where a rate hike is fully priced in. I said before that the second half of January could be particularly challenging and I think this might be what makes it happen.
The Lead-Lag Report is provided by Lead-Lag Publishing, LLC. All opinions and views mentioned in this report constitute our judgments as of the date of writing and are subject to change at any time. Information within this material is not intended to be used as a primary basis for investment decisions and should also not be construed as advice meeting the particular investment needs of any individual investor. Trading signals produced by the Lead-Lag Report are independent of other services provided by Lead-Lag Publishing, LLC or its affiliates, and positioning of accounts under their management may differ. Please remember that investing involves risk, including loss of principal, and past performance may not be indicative of future results. Lead-Lag Publishing, LLC, its members, officers, directors and employees expressly disclaim all liability in respect to actions taken based on any or all of the information on this writing.