
The Yen, the BOJ, and the Global Liquidity Lever Everyone Forgets Until It Snaps
A Wide Rate Gap, a Yen Back at the 160 Line, and the One Episode From August 2024 the Consensus Has Already Filed Away

Today’s Lead-Lag Report post is sponsored by Tuttle Capital

Many advisors who’ve added semiconductor exposure to client portfolios over the last three years have done so through broad ETFs or large-cap single names. The thesis has generally been right. The returns, in many cases, have been strong.
But that exposure comes with a structural limitation: it generates limited to no income. The entire return profile is potential price appreciation, which is variable.
For clients who need regular distributions — retirees, those drawing from managed accounts, income-focused mandates — that’s not a portfolio solution. It’s a potential growth position with no yield.
There’s a different way to express a view on the memory semiconductor ecosystem.
The Tuttle Capital Memory Stack Income Blast ETF (ticker: DRMP) is an actively managed ETF that seeks current income through a combination of equity exposure to Memory Stack Companies and a systematic put credit spread overlay on semiconductor-linked reference instruments.
The strategy seeks to generate weekly distributions, funded primarily by net options premiums collected through the spread program — not from return of capital by default, and not from liquidating the equity sleeve.
That distinction matters. Income from options premium is structurally different from a distribution policy that depletes the portfolio.
Advisors evaluating DRMP for income-oriented sleeves should review the prospectus for full details on how distributions are sourced and the risks associated with the options strategy.
Discover DRMP here.
────────────────────────────────────────────────────────────────────────────────
DISCLOSURES (verbatim, must be included):
This communication is intended for investment professionals and institutional investors only and is not intended for, and should not be distributed to, retail investors.
Investors should carefully consider the investment objectives, risks, charges and expenses of the Tuttle Capital Memory Stack Income Blast ETF (DRMP) (the “Fund”) before investing. This and other important information about the Fund is contained in the prospectus and summary prospectus, which can be obtained by visiting the website or by calling (347) 852-0548. The prospectus and summary prospectus should be read carefully before investing.
Investing involves risk, including possible loss of principal. The Fund is a newly organized, non-diversified exchange-traded fund and has a limited operating history. The Fund invests primarily in equity securities of companies involved in the memory semiconductor ecosystem (“Memory Stack Companies”), including those focused on DRAM, NAND, high-bandwidth memory (HBM), advanced packaging, outsourced semiconductor assembly and test (OSAT), substrates, interconnects, and related equipment and materials. As a result, the Fund is subject to risks associated with the semiconductor and technology industries, which may be volatile and can be affected by rapid technological change, product cycles, supply-demand imbalances, significant capital expenditure requirements, and regulatory and geopolitical developments.
The Fund seeks current income in part by employing a systematic options strategy that sells put credit spreads on semiconductor-related reference instruments. The use of options and other derivatives involves additional risks and may result in losses that exceed the amount invested in those instruments. Derivatives may be illiquid, difficult to value, and sensitive to changes in market conditions. The Fund’s put spread strategy is subject to market risk, leverage risk, volatility risk, valuation risk, counterparty risk, liquidity risk, and the risk of substantial losses in the event of sharp or “gap” moves in the price of the underlying reference instruments. While the long put in each spread is intended to define the maximum loss on an individual spread, the Fund may still experience significant losses over short or extended periods.
The Fund’s focus on Memory Stack Companies means its performance may be closely tied to trends affecting the memory semiconductor market and related technologies and may be more volatile than that of funds with more diversified exposure across sectors or industries. The Fund may invest in securities of issuers located outside the United States, including in emerging markets, which involve additional risks such as currency fluctuations, political and economic instability, less developed legal and regulatory systems, and less transparent financial reporting.
The Fund may invest in other investment companies, including ETFs, which means shareholders will indirectly bear a proportionate share of the expenses of those underlying funds, in addition to the Fund’s own expenses. The Fund expects to effect creations and redemptions primarily for cash, which may cause it to realize capital gains and may result in less tax efficiency than an ETF that effects creations and redemptions in-kind. Shares of the Fund are bought and sold on an exchange at market price (not NAV) and are not individually redeemed from the Fund. Market price returns may differ from the Fund’s net asset value, may trade at a premium or discount to NAV, and may be more volatile than NAV.
There is no guarantee that the Fund will achieve its investment objective, generate income, or avoid losses. Distributions may vary over time and may include net investment income, realized capital gains, and return of capital. A return of capital reduces a shareholder’s tax basis in Fund shares and is not itself a return on investment.
Foreside Fund Services, LLC is the distributor of the Fund.
DISCLAIMER – PLEASE READ: This is sponsored advertising content for which Lead-Lag Publishing, LLC has been paid a fee. The information provided in the link is solely the creation of Tuttle Capital. Lead-Lag Publishing, LLC does not guarantee the accuracy or completeness of the information provided in the link or make any representation as to its quality. All statements and expressions provided in the link are the sole opinion of Tuttle Capital and Lead-Lag Publishing, LLC expressly disclaims any responsibility for action taken in connection with the information provided in the link.
The Yen, the BOJ, and the Global Liquidity Lever Everyone Forgets Until It Snaps
KEY HIGHLIGHTS
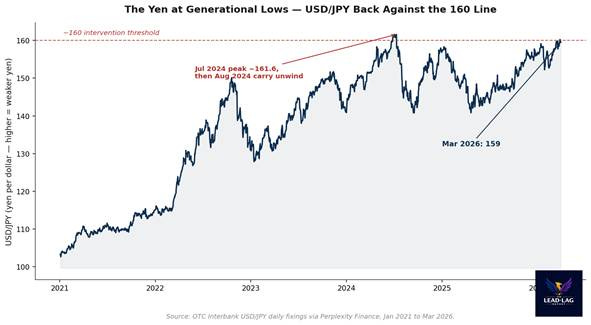
• USD/JPY pushed back to roughly 160 in the first quarter of 2026, the same politically uncomfortable line that has repeatedly invited official intervention. The yen has spent the period since 2021 sliding from near 103 to the high-150s and 160s.
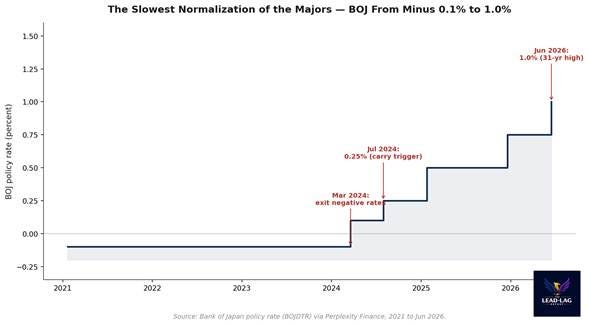
• The Bank of Japan raised its policy rate to 1.0% on June 16, 2026, the highest in about 31 years, by a 7-1 vote. Even after that move it remains the slowest of the major central banks to normalize, leaving a wide differential against US yields.
• Japan spent a record 11.73 trillion yen, roughly 73.6 billion dollars, supporting the yen between April 28 and May 27, 2026, the first confirmed intervention since 2024 and larger than the entire 2024 campaign.
• The canonical reference case is August 5, 2024, when a sudden yen surge forced a global deleveraging: the Nikkei 225 fell 12.4% in a single session, its worst day since 1987, and the VIX spiked above 60. That tail has not been retired; it has only been forgotten.
There is a particular kind of risk that markets are structurally bad at pricing. It does not announce itself with a deteriorating trend. It sits quietly inside a trade that works almost every day, generates small and consistent gains, and lulls everyone into treating leverage as if it were yield. Then a single variable moves the wrong way and the whole structure reprices in hours, not weeks. The yen carry trade is the largest living example of this pattern, and as of mid-2026 every ingredient that made it dangerous is back on the table.
Start with the price the entire world watches without admitting it. USD/JPY climbed back toward 160 in the first quarter of 2026, the same level that has triggered official intervention before and the same level Japanese officials describe, in careful language, as disorderly. [1] The yen has been on a multi-year slide, falling from roughly 103 per dollar at the start of 2021 to the high-150s and 160s by 2026. [2] That is not a quote on a screen. It is the mechanical output of a rate differential that refuses to close.
None of this is hidden. The exchange rate is published in real time, the intervention totals are confirmed by the Ministry of Finance, and the policy rate is set in public. The disagreement is not about the data. It is about whether a wide and persistent rate gap is a stable equilibrium or a coiled spring. Consensus has decided it is the former. The August 2024 episode is the reason that confidence should be held loosely.
The differential is the whole story
A carry trade is mechanically simple. Borrow in a currency where money is nearly free, convert, and hold a higher-yielding asset somewhere else. The yen has been the world’s preferred funding currency for a generation because Japanese rates sat at or below zero while the rest of the developed world paid real coupons. The profit is the interest differential, harvested daily, as long as the exchange rate does not move against the position faster than the carry accrues.
The engine of that trade is the gap between US and Japanese long yields. Through 2021 the US 10-year and the Japanese 10-year were both near the floor. Then the Federal Reserve tightened aggressively, the US 10-year ran toward 5%, and the Japanese 10-year stayed pinned near zero under yield curve control. [3] That blew the differential wide open and made yen funding extraordinarily attractive. The gap has narrowed somewhat as Japanese yields finally climbed toward the 2.3% area in early 2026, but it remains large enough that the funding-currency logic is fully intact.
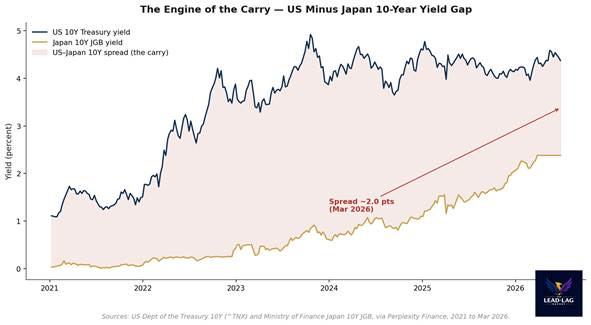
The narrowing matters less than it looks. A carry position does not unwind because the differential shrinks by a few tenths of a point. It unwinds because the funding currency suddenly strengthens, vaporizing months of accrued carry in a single move and triggering margin calls on the leverage that sat underneath. The differential determines how attractive the trade is. The exchange rate determines how violently it ends.
The slowest central bank in the room
The Bank of Japan has been the laggard of the major central banks by design. It exited negative interest rate policy only in March 2024, lifted the rate to 0.25% on July 31, 2024, and continued in measured steps to 0.75% by late 2025. [4] On June 16, 2026 the Policy Board raised the uncollateralized overnight call rate to around 1.0% by a 7-1 vote, the highest level in roughly 31 years, and signaled it would hold its monthly government bond purchases steady rather than continue tapering. [5] By the standards of the post-2021 tightening cycle, this is still glacial.
Here is the uncomfortable part for the comfortable view. The same 1.0% rate that looks like meaningful normalization to a domestic audience is, against a US 10-year still well above 4%, barely a dent in the funding advantage. The yen has been unable to push durably below the 160 area even as the BOJ hikes, precisely because the gap to the Fed remains wide. [6] That is the consensus comfort: differentials this large keep the carry alive and make a disorderly unwind unlikely. It is also exactly the reasoning that was in place in July 2024, days before the unwind arrived.
Officials are not relaxed. Between April 28 and May 27, 2026 Japan spent a record 11.73 trillion yen, about 73.6 billion dollars, to support the currency, the first confirmed intervention since 2024 and larger than the four-tranche 2024 campaign that had set the prior record. [7] Governments do not deploy that kind of reserve firepower against a market they believe is stable. The intervention is the tell. The 160 line is not a number, it is a policy boundary, and the authorities are spending real money to defend it.
August 2024 is the reference case, not a footnote
On July 31, 2024 the BOJ raised its rate to 0.25%. Two days later a soft US payrolls report reset Fed cut expectations and compressed the very differential the carry depended on. The yen, which had been near 161 in mid-July, surged toward 142 in a matter of days. [8] That move was not a slow grind. It was a stampede for the exit by leveraged positions that had been short the yen, and it cascaded into every asset those positions had funded.
On August 5, 2024 the Nikkei 225 fell 12.4% in a single session, its largest one-day drop since the 1987 Black Monday crash, erasing roughly 113 trillion yen, near 790 billion dollars, of market value from its July peak. [9] The Bank for International Settlements documented the mechanics directly: the TOPIX lost 12% on the day, the VIX briefly spiked above 60 in off-hours trading, and FX carry trades funded in yen were, in its words, the hardest hit. [10] The BIS put the rough scale of the yen carry book entering the event near 40 trillion yen, around 250 billion dollars, and noted that figure was probably biased low.
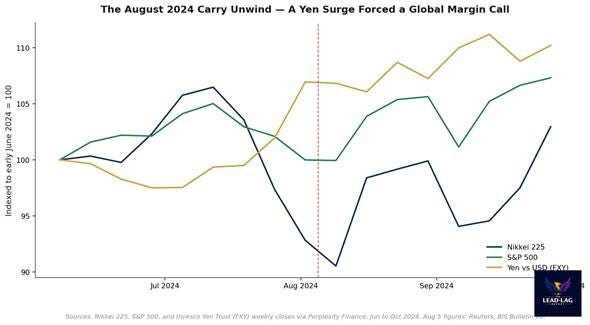
The chart above shows the signature of a carry unwind rather than an ordinary selloff: the yen and the equity indices move in opposite directions with unusual force. As the yen rallied, the Nikkei and, to a lesser degree, the S&P 500 fell together, because the same leveraged dollars that had been long risk were funded by short yen. When the funding leg reversed, the risk leg had to be liquidated. Markets stabilized within the week, which is precisely why the episode has been so easily filed away as a one-off.
It was not a one-off. It was a demonstration of how the plumbing behaves under stress. The structure that produced August 2024 is still in place: a wide differential, a heavily used funding currency, a yen pressed against an intervention line, and a Japanese central bank that must keep tightening to defend its own inflation mandate. The levers that matter now are knowable in advance. The next BOJ decision and its published reasoning, the Ministry of Finance intervention posture, and the US-Japan rate spread are the three dials. The BOJ has already told the market it expects to keep moving. [11]
What this regime is asking of positioning
The lesson is not a directional call on the yen or on Japanese equities. It is a statement about correlation and tail behavior. In calm periods, yen-funded leverage is invisible. It does not show up in any single asset’s volatility, and it makes diversified portfolios look better diversified than they are, because the same funding trade quietly sits beneath many of the positions an investor believes are independent. That is the asymmetry. The carry pays a little, steadily, until it costs a great deal, suddenly.
So the relevant question for exposure is not whether the carry will unwind on a particular date. It is whether a portfolio is implicitly relying on the yen staying weak and volatility staying low, without the holder having chosen that bet on purpose. A sudden yen strengthening of the kind seen in August 2024 is the scenario under which seemingly uncorrelated risk assets reprice together. Sizing, liquidity, and the willingness to hold through a fast deleveraging are what determine whether that scenario is survivable.
The consensus reading is that a 1.0% policy rate, a still-wide differential, and a year of relative calm since the last scare mean the carry is durable and the August 2024 event was an aberration. The contrarian reading is that durability and fragility are the same property viewed at different time horizons. A trade that works every day until it does not is not stable. It is quiet.
The yen carry trade is the global liquidity lever almost no one watches until it moves, and every condition that made it dangerous in the summer of 2024, a wide rate gap, a yen at the 160 line, and a central bank that must keep tightening, is present again in the summer of 2026.
Few understand this.
— — —
Notes
[1] Ministry of Finance, Japan, Foreign Exchange Intervention Operations, https://www.mof.go.jp/english/policy/international_policy/reference/feio/monthly/index.html. On the 160 area as the intervention threshold, see Reuters, May 31, 2024, https://www.reuters.com/markets/currencies/japanese-data-confirm-fx-intervention-yen-weakness-persists-2024-05-31/.
[2] USD/JPY daily fixings, OTC Interbank series via Perplexity Finance, January 2021 through March 2026. Levels: roughly 103 in early 2021 to the high-150s and 160s in early 2026.
[3] US 10-year Treasury yield (^TNX) and Japan 10-year government bond yield (Ministry of Finance, Japan), weekly and daily series via Perplexity Finance, 2021 through March 2026.
[4] CNBC, July 31, 2024, Japan confirms intervention as BOJ hikes rates to around 0.25%, https://www.cnbc.com/2024/07/31/japan-confirms-36point8-billion-yen-intervention-as-boj-hikes-rates.html.
[5] Bank of Japan, Change in the Guideline for Money Market Operations, June 16, 2026, https://www.boj.or.jp/en/mopo/mpmdeci/mpr_2026/k260616a.pdf; CNBC, June 16, 2026, https://www.cnbc.com/2026/06/16/boj-rate-hike-historic-inflation.html.
[6] Reuters, June 16, 2026, Bank of Japan raises rates to 31-year high, flags more to come, https://www.reuters.com/world/asia-pacific/bank-japan-set-raise-rates-31-year-high-vow-further-increases-2026-06-15/; Seoul Economic Daily, June 16, 2026, https://en.sedaily.com/international/2026/06/16/japan-resumes-rate-normalization-but-wide-us-gap-to-keep.
[7] Kyodo News, May 29, 2026, Japan spends record 11.73 tril. yen on forex intervention, https://english.kyodonews.net/articles/-/76981; Bloomberg, May 29, 2026, https://www.bloomberg.com/news/articles/2026-05-29/japan-used-record-73-6-billion-to-support-yen-in-past-month.
[8] MUFG Research, August 6, 2024, Will the great unwind continue, https://www.mufgresearch.com/fx/asia-fx-talk-will-the-great-unwind-continue-6-aug-2024/; Reuters via The Japan News, August 5, 2024, https://japannews.yomiuri.co.jp/news-services/reuters/20240805-202848/.
[9] Reuters via The Japan News, August 5, 2024, Japan’s Nikkei plummets in biggest rout since 1987 Black Monday, https://japannews.yomiuri.co.jp/news-services/reuters/20240805-202848/.
[10] Bank for International Settlements, BIS Bulletin No. 90, The market turbulence and carry trade unwind of August 2024, August 27, 2024, https://www.bis.org/publ/bisbull90.pdf.
[11] Bank of Japan, Monetary Policy Meeting schedule and decisions, https://www.boj.or.jp/en/mopo/mpmsche_minu/index.htm. The Summary of Opinions for the June 2026 meeting was scheduled for June 24, 2026, with minutes on August 5, 2026.
The Lead-Lag Report is provided by Lead-Lag Publishing, LLC. All opinions and views mentioned in this report constitute our judgments as of the date of writing and are subject to change at any time. Information within this material is not intended to be used as a primary basis for investment decisions and should also not be construed as advice meeting the particular investment needs of any individual investor. Trading signals produced by the Lead-Lag Report are independent of other services provided by Lead-Lag Publishing, LLC or its affiliates, and positioning of accounts under their management may differ. Please remember that investing involves risk, including loss of principal, and past performance may not be indicative of future results. Lead-Lag Publishing, LLC, its members, officers, directors and employees expressly disclaim all liability in respect to actions taken based on any or all of the information on this writing.