

Every week, we’ll profile a high yield investment fund that typically offers an annualized distribution of 6-10% or more. With the S&P 500 yielding less than 2%, many investors find it difficult to achieve the portfolio income necessary to meet their needs and goals. This report is designed to help address those concerns.
After a few weeks of turmoil around Liberation Day, junk bonds quickly regained their footing and began steadily outperforming Treasury bonds again. Treasuries have had their own set of issues to deal with, including the level of government debt being accumulated and global central banks adjusting their stockpiles in response to tariffs. Junk bonds, on the other hand, seemed to quickly mitigate any credit concerns that had been building and erased any losses that they experienced earlier this year.
Are junk bonds poised to continue the trend? Macro conditions and market sentiment would seem to work in their favor. The Western Asset High Income Opportunity Fund (HIO) takes a simple approach - focus on credit research, avoid the use of leverage and try to pick winners. In that sense, it could be a more straightforward approach to high yield investing without some of the extra risks that some leveraged funds take.
Fund Background
HIO provides a portfolio of primarily high-yield corporate debt securities. It seeks high current income with capital appreciation as a secondary objective. The fund emphasizes team management and extensive credit research expertise to identify attractively priced securities.
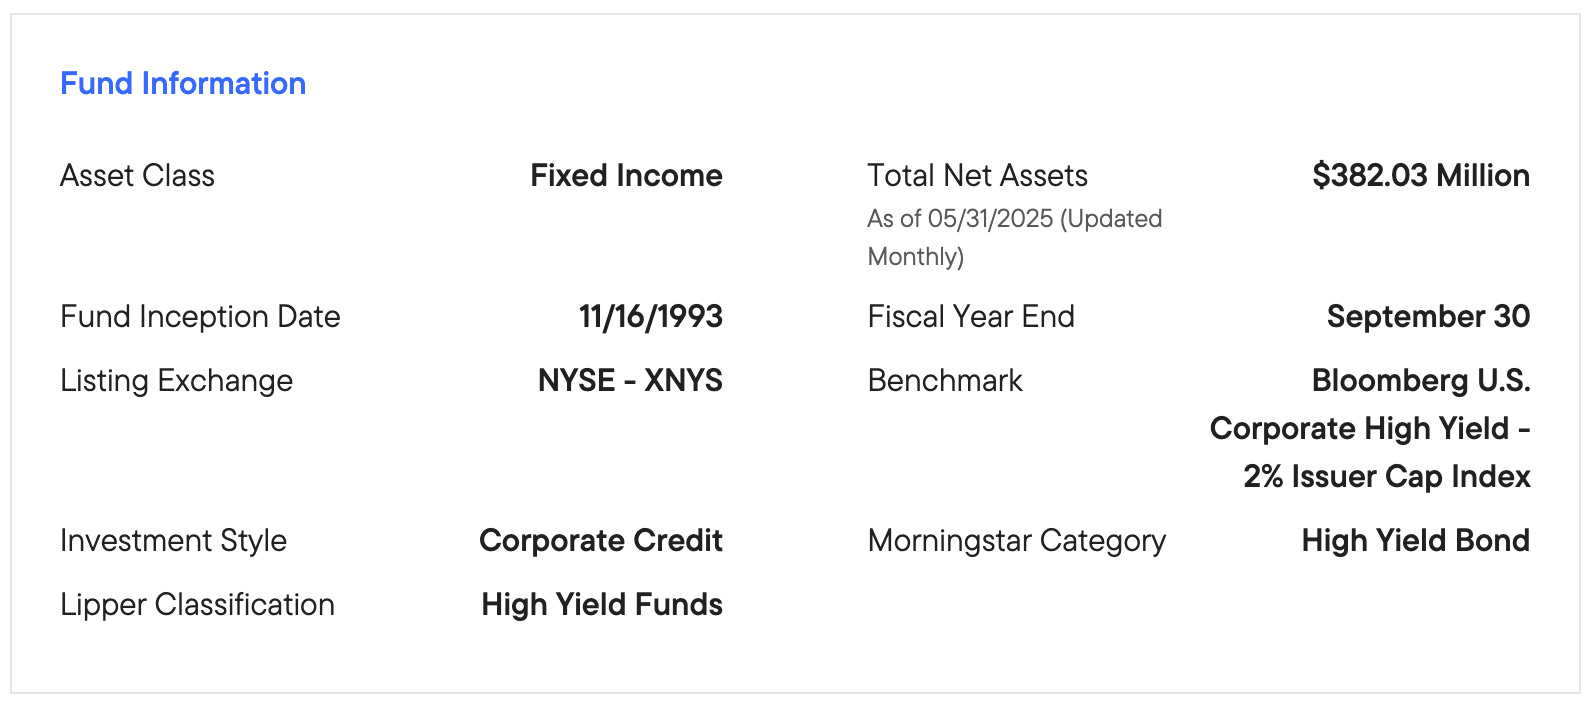
As mentioned above, HIO’s advantage may be in its simplicity. It doesn’t utilize costly leverage (its total expense ratio is under 1%, a rarity in the closed-end fund space) and it focuses on security selection to generate alpha. No specific sector, region or credit quality focus. Just trying to pick winners. Whether the fund has been successful in that endeavor is up for debate, but its approach to investing in high yield bonds is a sound one.
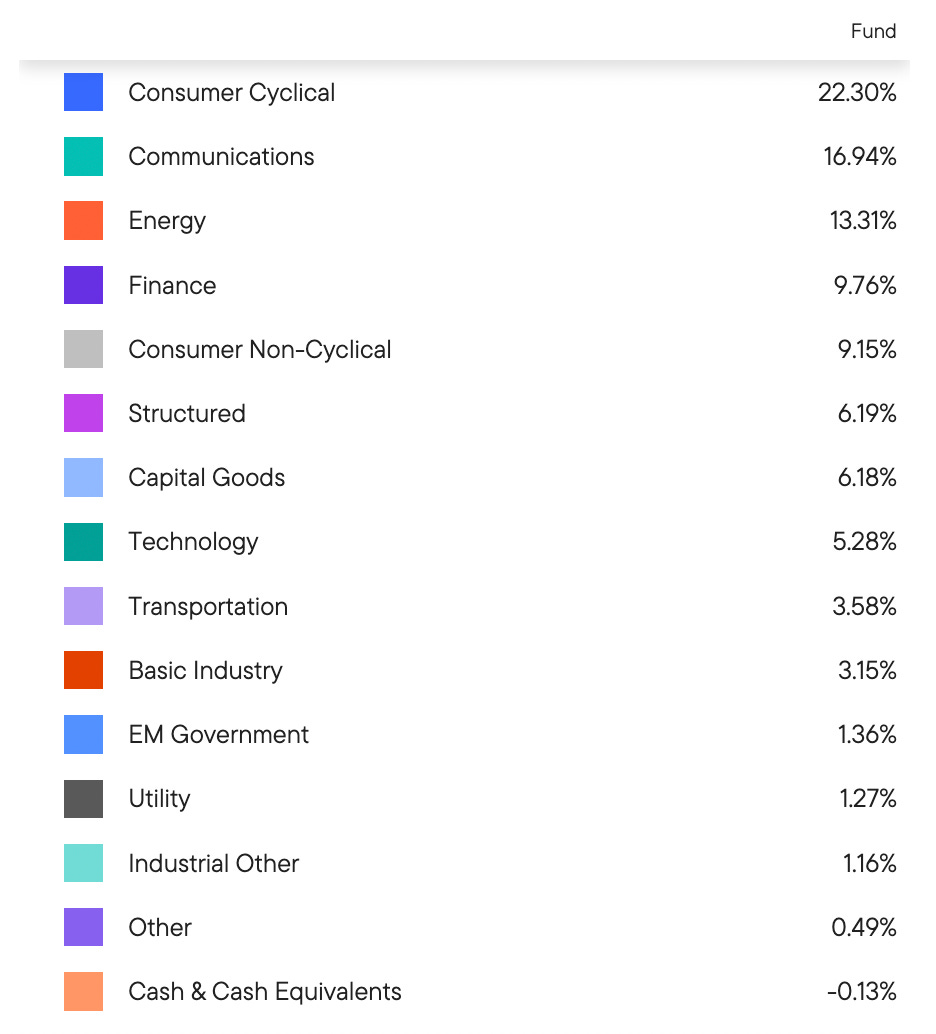
HIO is fairly well-diversified. It does, however, have an unquestionable cyclical and economically-sensitive tilt. The top 3 sectors accounting for more than half of the fund’s assets does make it a bit top-heavy, but I like the fact that the next five sectors all receive 5-10% allocations. There’s enough variety here that idiosyncratic risk is limited, but I am a little concerned that this fund could take a hit during economic downturns.
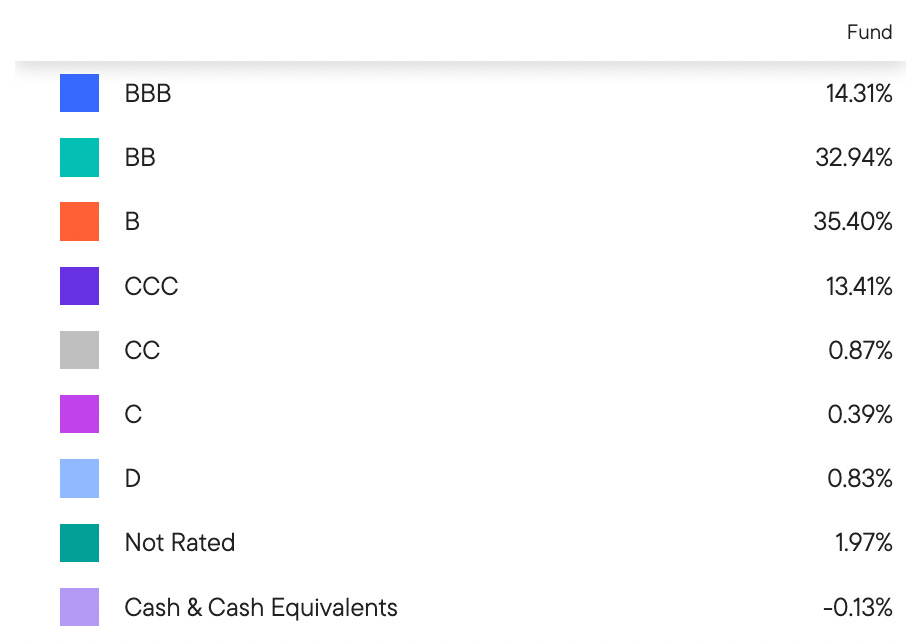
HIO does go pretty deep into the lower credit tiers. Half of the portfolio is in single-B rated securities or worse, which is the point where default risk really starts to increase. The 14% allocation to investment-grade bonds is a bit of a counterbalance, but the fact that it’s all in BBB-rated notes means the risk profile probably isn’t a whole lot different than that of the upper levels of the junk bond universe.
Special Announcement

The Infrastructure Capital Small Cap Income ETF (SCAP) –– Monthly Distributions* – Targeting Smaller Companies with Strong Earnings and Dividends
Income and High Yield – SCAP invests in Small Cap Companies that seek to pay dividends and high-yielding preferred stocks of Small Cap Companies and can utilize modest leverage in an effort to deliver attractive yields.
Value Investing – Stock selection is based on a multi-factor proprietary approach that focuses on profitable companies trading at attractive valuations relative to both the sector and the small cap universe as a whole. We believe an emphasis on value investing is important when investing in small companies to limit risks inherent in investing in unprofitable, development stage companies.
Differentiated Small Cap ETF – SCAP utilizes active management, covered call writing, and broad sector diversification with an income focus.
Small Company Exposure– SCAP invests at least 80% of its assets in securities of small-capitalization companies and defines small-capitalization (“Small Cap”) companies as those companies with a market capitalization that is within or below the range of companies in the Russell 2000®.
Fixed Monthly Dividend* – Plan for the future with stable and recurring dividends you can anticipate and potentially capture value through monthly dividend.
Sector Diversification – SCAP aims to diversify Small Cap risk by investing across major sectors, while maintaining reasonable position sizes. For example, unlike many of its peers, SCAP is currently underweight the Healthcare, Pharmaceuticals, Biotechnology sectors, which can have higher relative risk profiles with respect to smaller companies.
Performance from Inception – Please see the fact sheet or fund’s web site for performance.
DISCLOSURE
The information presented represents our subjective belief and opinions and should not be construed as investment advice. Past performance does not guarantee future results. *Infrastructure Capital Advisors expects to declare future distributions on a monthly basis. Distributions are planned, but not guaranteed, for every month. For more information about each Fund’s distribution policy, its 2025 distribution calendar, or tax information, please visit the Fund’s web site for more information. The Russell 2000 Index is a small-cap U.S. stock market index that makes up the smallest 2,000 stocks in the Russell Index; it measures the performance of the small-cap segment of the US equity universe.
FUND RISKS
Investors should consider investment objectives, risks, charges, and expenses carefully before investing. For a prospectus with this and other information about the Infrastructure Capital Small Cap Income ETF, please visit each respective fund page here www.infraCapfund.com/scap. Please read the prospectus carefully before investing. For more information about the Funds, Funds’ strategies or InfraCap, please reach out to Craig Starr at 212-763-8336.
SCAP Exchange Traded Fund (ETF): Investing involves risk, including possible loss of principal. An investment in the Fund may be subject to risks which include, among others, investing in equities securities, dividend paying securities, utilities, small-, mid- and large-capitalization companies, real estate investment trusts, master limited partnerships, foreign investments and emerging, debt securities, depositary receipts, market events, operational, high portfolio turnover, trading issues, active management, fund shares trading, premium/discount risk and liquidity of fund shares, which may make these investments volatile in price. Foreign investments are subject to risks, which include changes in economic and political conditions, foreign currency fluctuations, changes in foreign regulations, and changes in currency exchange rates which may negatively impact the Fund’s returns. Small and Medium-capitalization companies, foreign investments and high yielding equity and debt securities may be subject to elevated risks. The Fund is a recently organized investment company with no operating history. Dividends are not guaranteed and may fluctuate. Please see prospectus for discussion of risks. Diversification cannot assure a profit or protect against loss in a down market. SCAP is distributed by Quasar Distributors, LLC.
DISCLAIMER – PLEASE READ: This is sponsored advertising content for which Lead-Lag Publishing, LLC has been paid a fee. The information provided in the link is solely the creation of Infrastructure Capital. Lead-Lag Publishing, LLC does not guarantee the accuracy or completeness of the information provided in the link or make any representation as to its quality. All statements and expressions provided in the link are the sole opinion of Infrastructure Capital and Lead-Lag Publishing, LLC expressly disclaims any responsibility for action taken in connection with the information provided in the link.
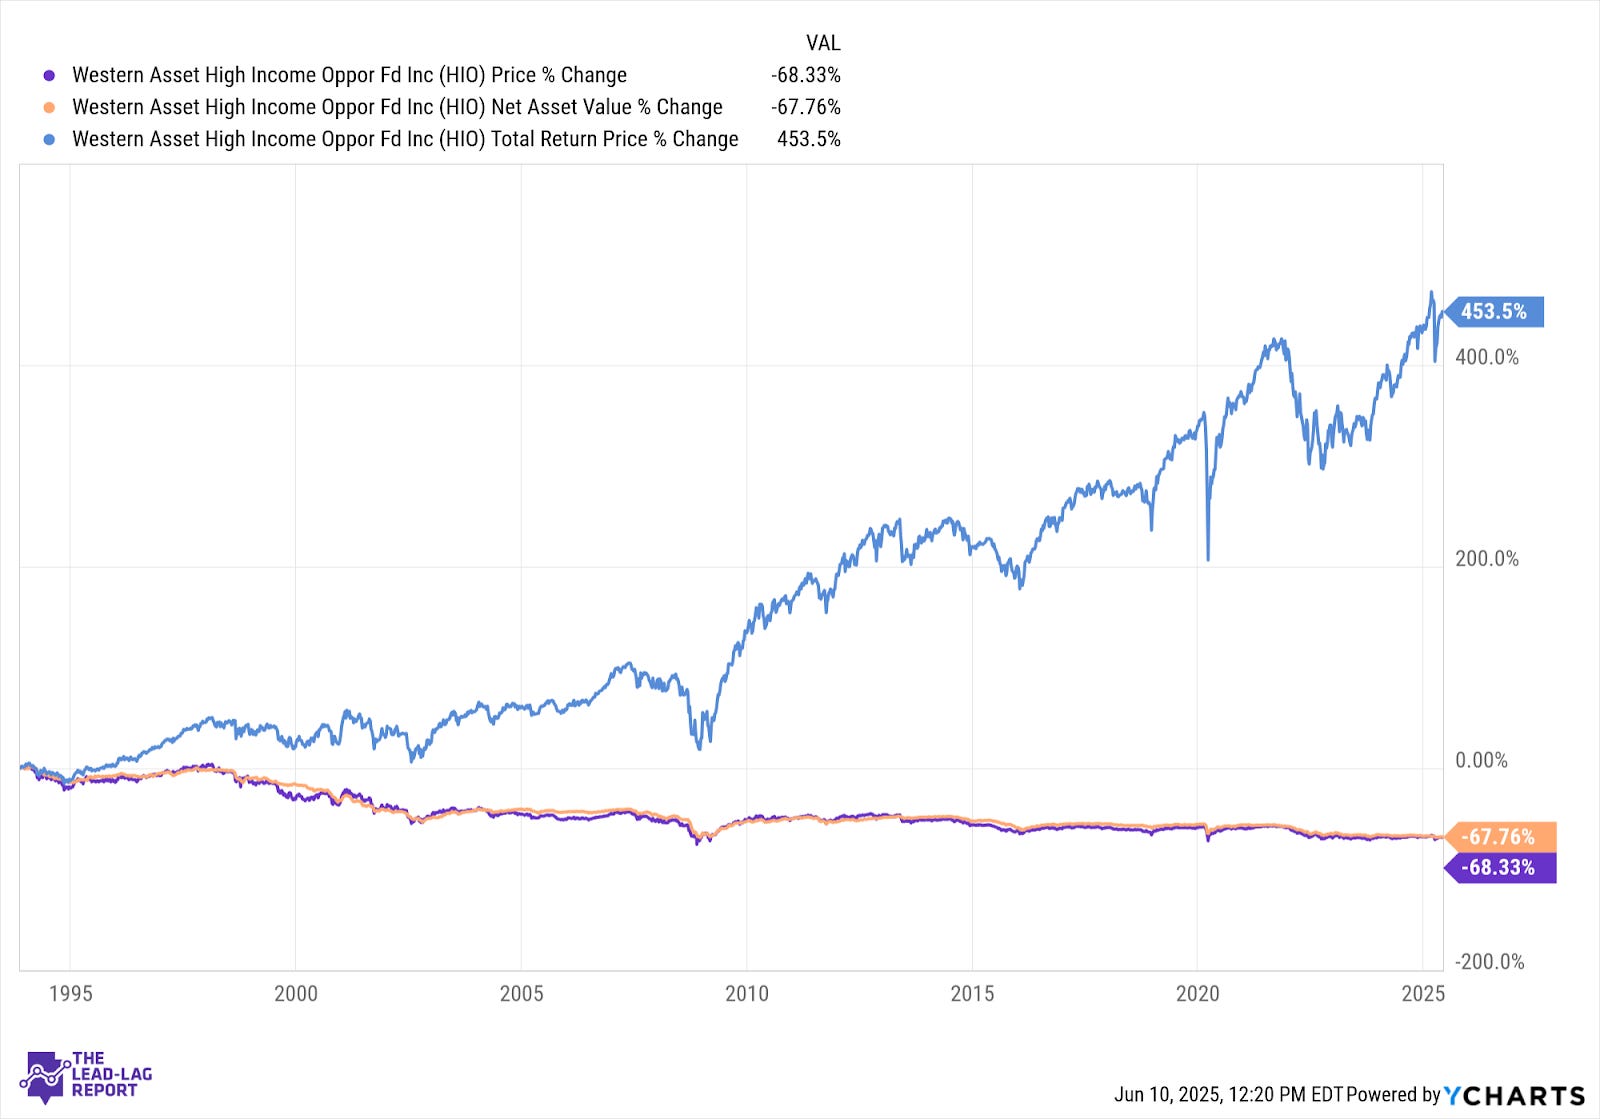
Since its inception in November 1993, HIO has generated a total return of 453%. That translates to an average annual return of around 5-6%.
There are a couple things to point out in this chart. Given its 30+ year history, the total return appears smoother than it actually is. In reality, HIO has experienced several significant corrections over its lifetime. It saw 20% declines during the tech bubble, 2015-2016 and 2022. It saw a 30% decline in 2001-2022 and the COVID pandemic as well as a 50% decline during the financial crisis. If you’re going to take a chance on HIO, be prepared for a potentially bumpy ride.
The other is the near-70% degradation in the fund’s NAV. As we’ll see in a moment, this very much looks like a case of overdistribution that ends up eroding the NAV over time and impacting total returns.
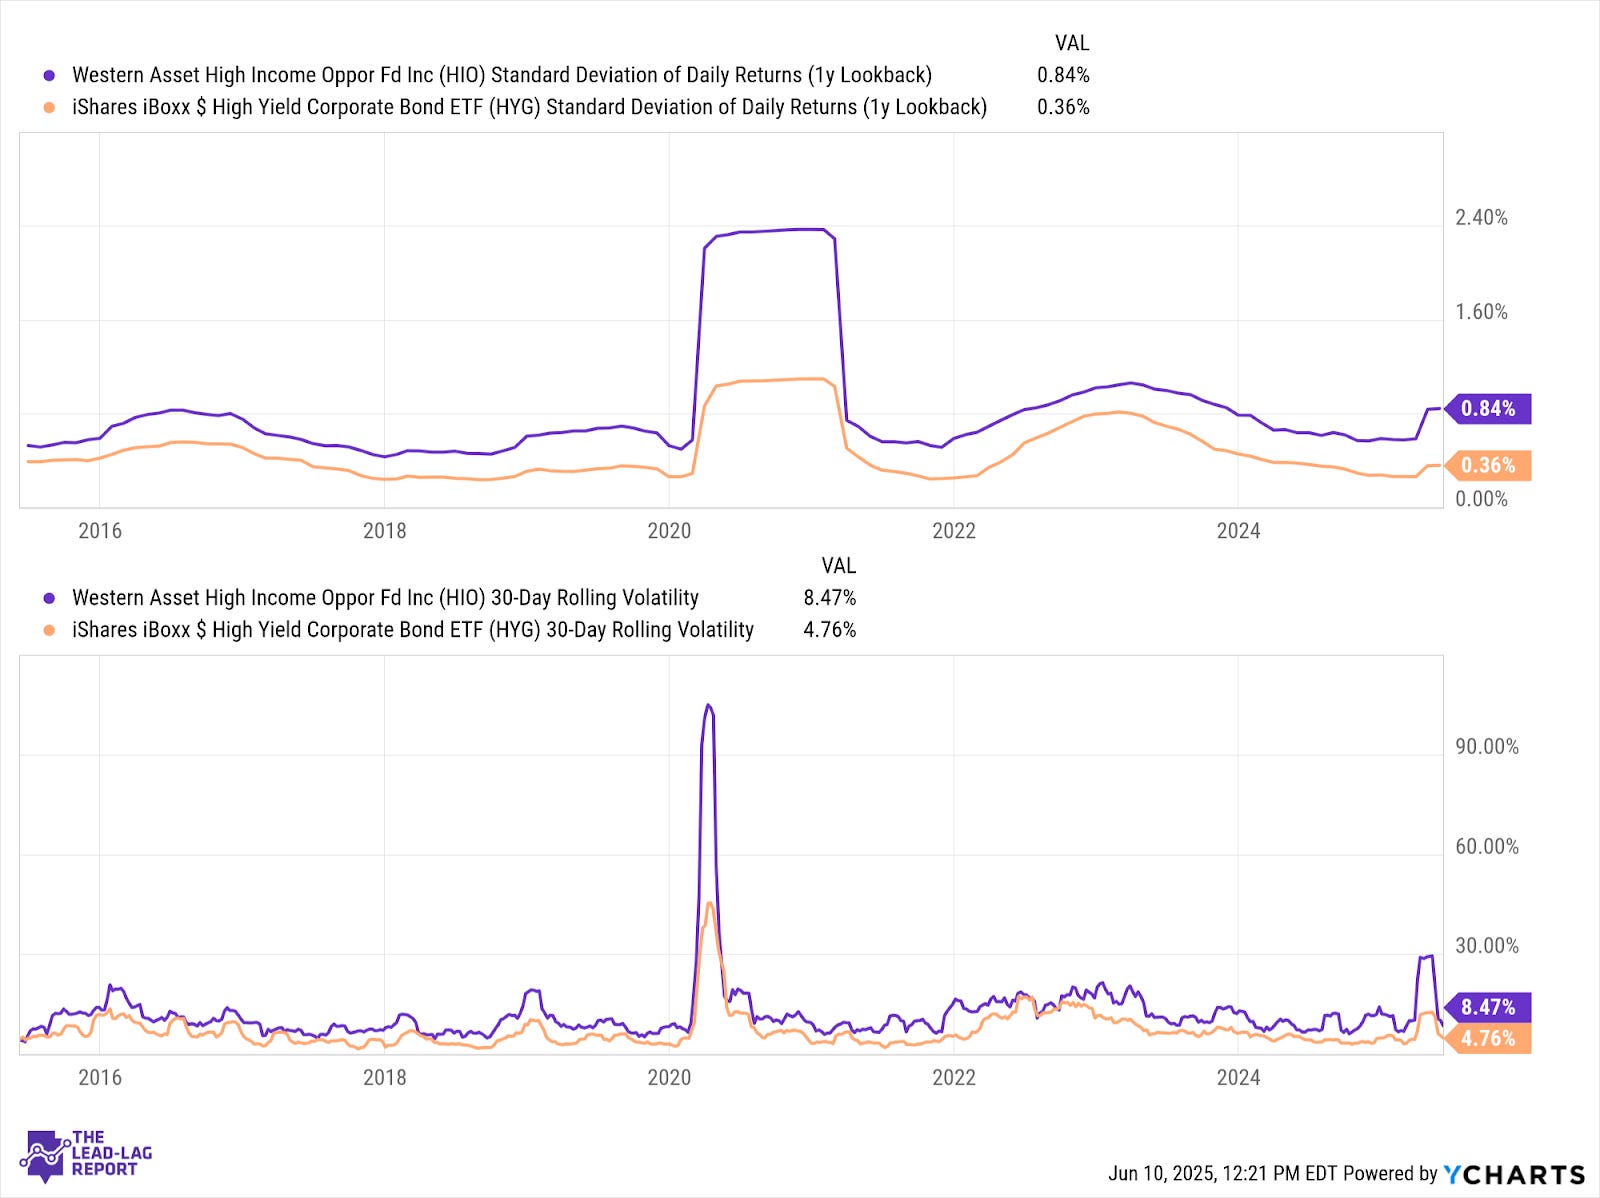
The one thing that is relatively consistent, however, is the fund’s volatility level. While there have been clear fluctuations over time, it’s routinely been about twice as volatile as a standard junk bond index. Credit quality is likely a contributor to this given its comparatively poorer profile, but so too is the movement in the fund’s discount to NAV.
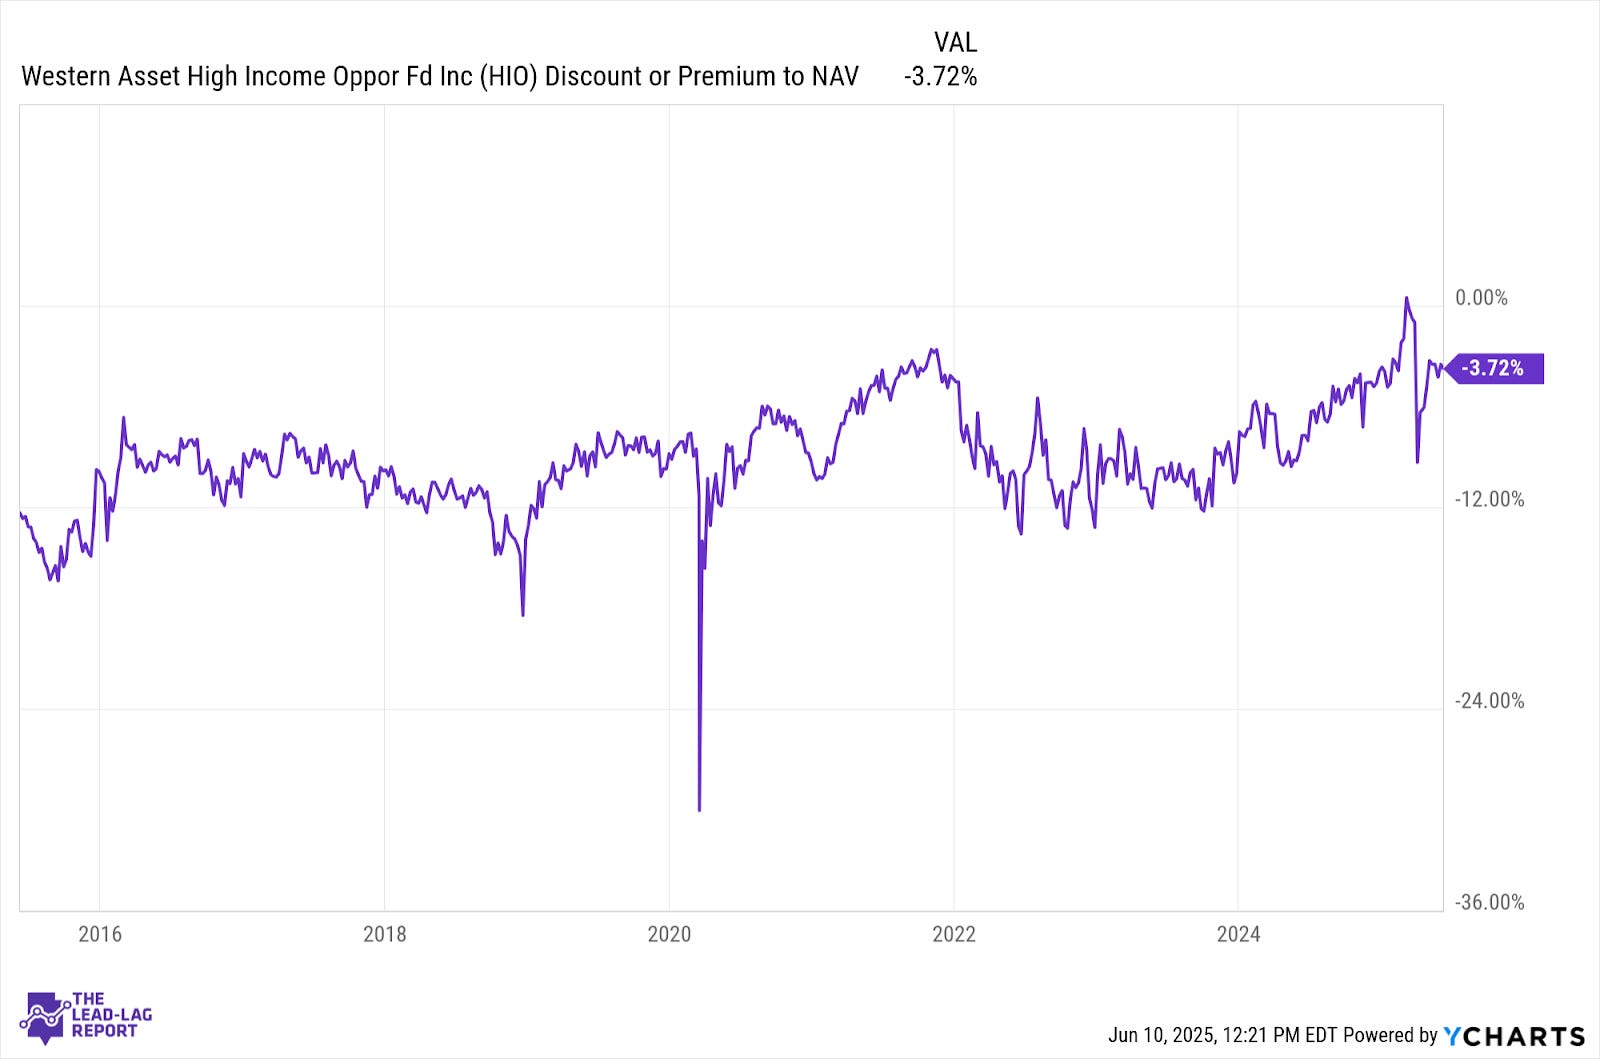
Over the long-term, the discount has remained relatively range-bound, but the frequent ups and downs have reduced the odds of generating above average risk-adjusted returns over time. HIO is a 2-star Morningstar fund as it is. If it requires taking on twice the risk to capture below average returns, it doesn’t make for a strong investment case.
Macro Environment
The environment for junk bonds has appeared to improve since the Liberation Day bottom. The Trump tariffs raised concerns about slowing global growth and higher inflation risk. As a result, bond investors finally began pricing some level of credit risk into the market. Still not necessarily a level that fully reflects that outstanding risk against historical benchmarks, but enough that it finally put a dent in junk bond performance.
Flash forward a couple of months and priced in credit risk has largely returned to where it was before. A cooler tone on the trade front, a delay in some of the more extreme tariffs and a desire to come to the table and negotiate has brought volatility back down to normal levels and restored a level of confidence back into risk asset prices.
From a macro point of view, it looks like recession risk is lower today than it was a couple months ago. The contraction in Q1 GDP that resulted from a rush of imports to get ahead of tariffs looks more likely to correct itself in Q2 and prove to be an aberration more than a trend. If tariff risks can be contained going forward, there’s a very reasonable chance that the U.S. economy can continue to expand and avoid a recession. Given current credit conditions and risks from places like Japan, that’s far from a sure thing, but it’s definitely not outside the realm of possibility.
While I’m still not a fan of the overall risk/reward tradeoff in junk bonds, I do have to acknowledge that there’s room for further outperformance here. The market has been more than comfortable visiting the lower tiers of the credit spectrum and that may not change quickly.
Distribution Policy
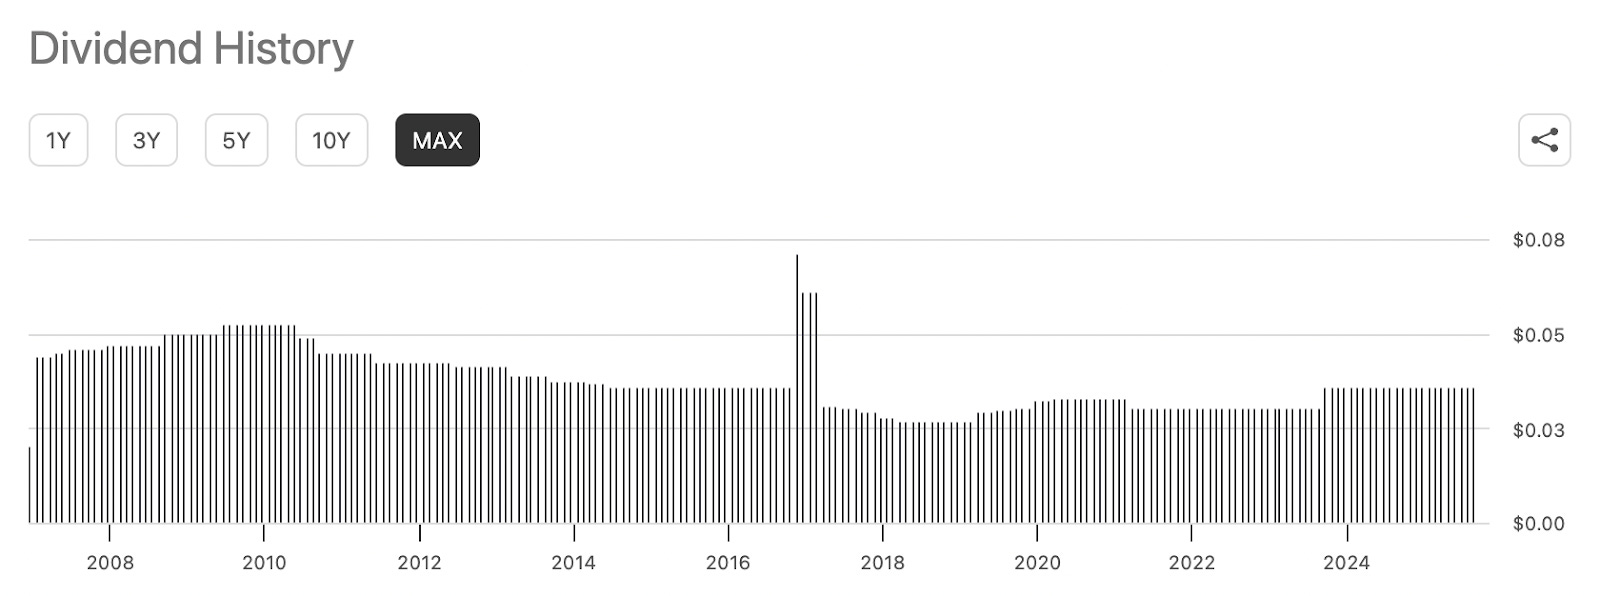
HIO maintains a fixed distribution policy that currently pays $0.0355 per share monthly or $0.426 per share annually. At current share prices, that translates to an annualized yield of 11.0%.
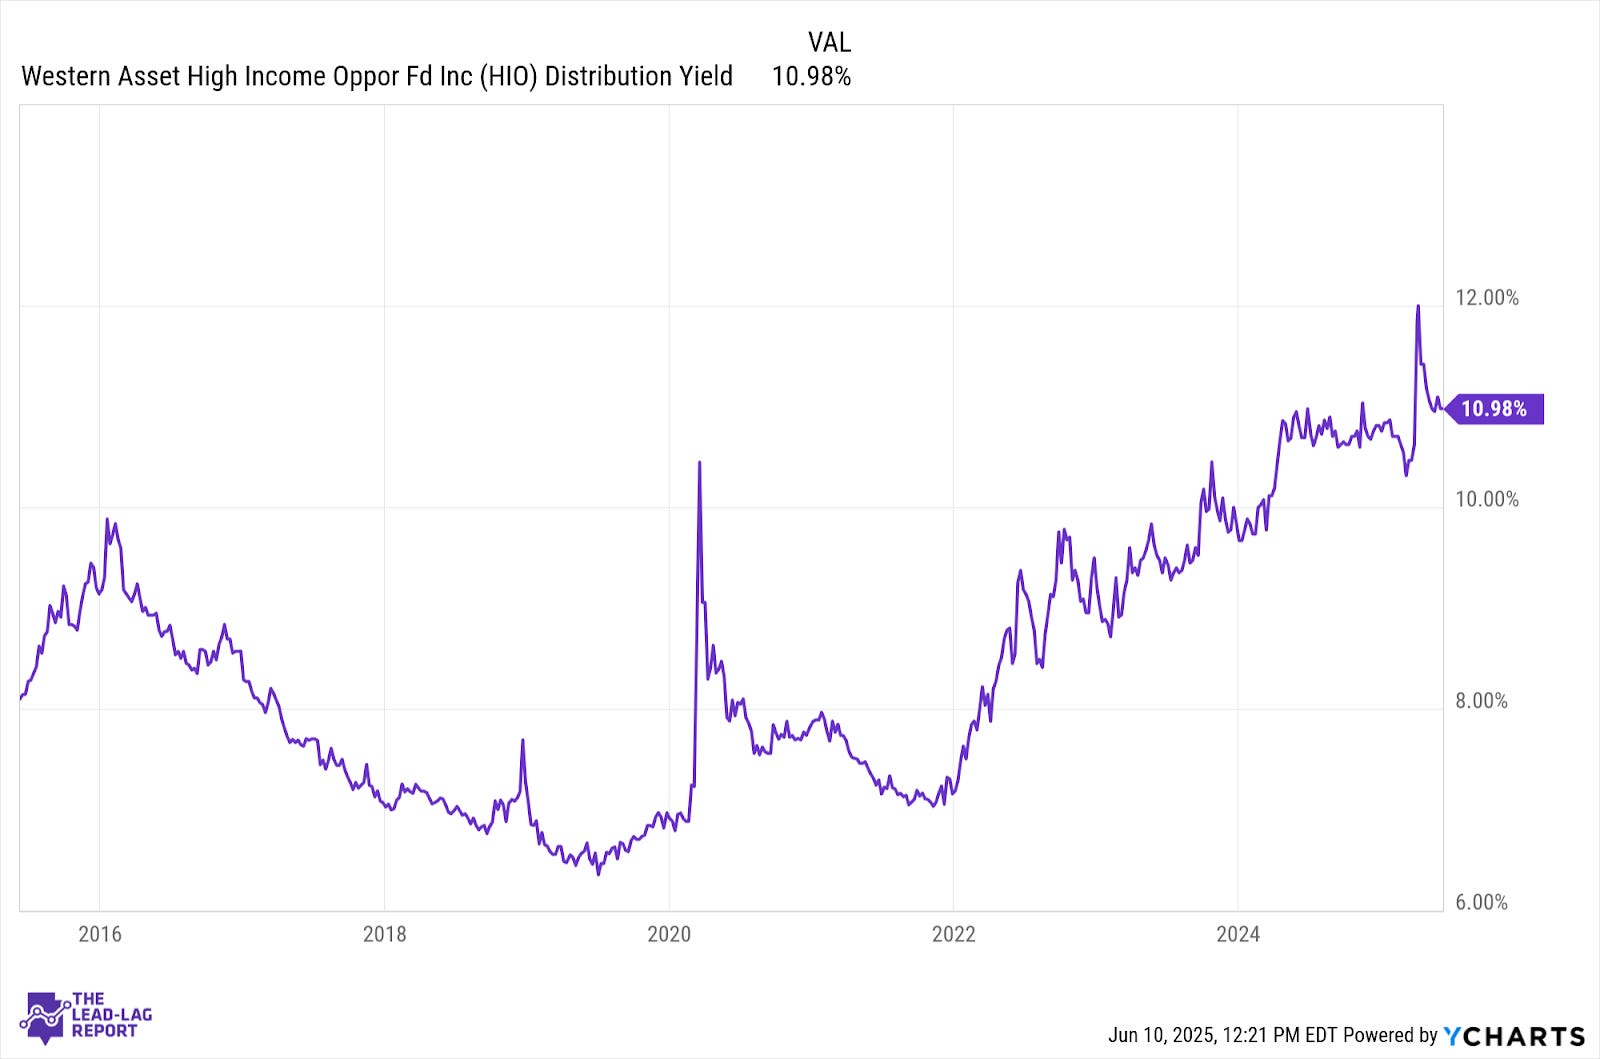
HIO has been able to maintain this payout level for nearly two years, but I’m skeptical that it can maintain it much longer. Roughly ⅓ of the current distribution is categorized as return of capital and an earnings coverage ratio of around 74% indicates that the monthly payouts are far from fully funded.
With the NAV still decaying, I suspect that the fund is likely to make a distribution cut in the not so distant future. HIO’s distribution schedule has been able to enjoy some sustainability for a while, but the current yield of 11% is far above what junk bonds as a whole are currently paying.
Advantages
Without the use of leverage, HIO has one of the lower expense ratios within its peer group.
The fund’s strategy, which is to simply use fundamental research to identify attractive bonds, is a positive. Many funds target deeply low quality bonds or certain sectors. HIO just tries to pick winners.
Disadvantages
The fund’s track record is below average and risk-adjusted returns are even worse.
HIO looks primed for a distribution before too much longer.
50% of the portfolio is in bonds rated single-B or worse, presenting a fair amount of credit risk.
Final Thoughts
Most investors who use CEFs target them for their yields. HIO’s 11% yield is certainly attractive (and it’s probably a big reason why the discount to NAV has shrunk), but it won’t matter much if it gets cut. Given that it seems like that’s more likely than not to happen, I don’t think HIO is nearly as attractive.
Even without that, HIO doesn’t have the track record or the risk-adjusted returns that would justify not looking for better opportunities elsewhere.
The Lead-Lag Report is provided by Lead-Lag Publishing, LLC. All opinions and views mentioned in this report constitute our judgments as of the date of writing and are subject to change at any time. Information within this material is not intended to be used as a primary basis for investment decisions and should also not be construed as advice meeting the particular investment needs of any individual investor. Trading signals produced by the Lead-Lag Report are independent of other services provided by Lead-Lag Publishing, LLC or its affiliates, and positioning of accounts under their management may differ. Please remember that investing involves risk, including loss of principal, and past performance may not be indicative of future results. Lead-Lag Publishing, LLC, its members, officers, directors and employees expressly disclaim all liability in respect to actions taken based on any or all of the information on this writing.