
Three Round Numbers and a Memorial Day Airstrike
Dow 50,000. Nikkei 65,000. KOSPI 8,000. NVDA prints the best quarter in semiconductor history — and U.S. jets struck Iran, Bitcoin ETF flows went sharply negative, and gold confirmed a 15% correction.

Special Announcement
A Conversation on the AI Trade Most Portfolios Are Missing — Monday June 1 @ 2pm ET
The AI conversation has fixated on the same six names for two years.
Matt Tuttle thinks the more interesting layer sits one step beneath the hyperscalers — in the **physical infrastructure** that AI cannot exist without.
On Monday, June 1 at 2:00 PM ET, Matt joins the Lead-Lag team for a 60-minute conversation on the **Heavy Assets, Low Obsolescence (HALO)** lens — a way of thinking about businesses with physical assets (mines, railroads, energy companies, and power utilities, for starters) that are unlikely to be disrupted by the next model release.
We’ll discuss:
- What “heavy asset, low obsolescence” actually filters for as a screen
- Why the AI capex cycle may rotate from compute toward heavy assets, infrastructure and materials over the coming years
- Sector-level implications for advisor portfolios
- Live Q&A with Matt Tuttle, Michael Gayed (Lead-Lag), xx, and zz [two RIA partners; will insert names and firm names]
**1.0 hour of CFP CE credit available** (Investment Planning, Intermediate).
📅 Monday, June 1, 2026
🕑 2:00 PM ET
🎥 Live on Zoom
**Register:** https://us06web.zoom.us/webinar/register/WN_FDWhyy9MTMy_wsGO2Tukyw
Hosted by Tuttle Capital Management and Lead-Lag Publishing, LLC. This webinar is educational; no specific product is being marketed.
Disclaimer:
This is sponsored advertising content for which Lead-Lag Publishing, LLC has been paid a fee. The information provided is solely the creation of Tuttle Capital Management. Lead-Lag Publishing, LLC does not guarantee accuracy or completeness. All statements are the sole opinion of Tuttle Capital Management. Past performance does not guarantee future results. Investing involves risk including possible loss of principal. Nothing in this webinar should be construed as a recommendation to buy or sell any security or as personalized investment advice.
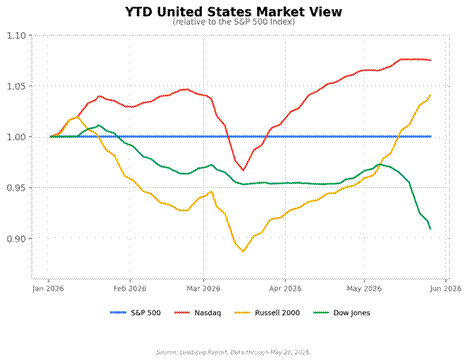
Let me lead with the contradiction. The Dow Jones Industrial Average reclaimed 50,000 on May 20 — first breached in February 2026 but surrendered during the early Iran war selloff — and extended to 50,461.69 by May 26. The S&P 500 closed at 7,519.11 on Tuesday. The Russell 2000 surged +4.56% over the two-week window — the standout performer of 2026 so far in any two-week stretch — as the 10-year Treasury pulled back from its 16-month high of 4.70% down to 4.50%. Risk assets were ripping. The institutional narrative was euphoria. And yet. The same week that the Dow retook 50,000, the U.S. Central Command conducted airstrikes on Iranian missile launch sites and mine-laying vessels inside the Strait of Hormuz. Front-month ICE Brent settled at $99.58 on May 26, a 3.58% jump on the strikes. WTI closed near $92.86. The Strait remains on Day 86 of its effective closure to commercial traffic — still the largest oil supply disruption in modern history. The Bitcoin ETF inflow streak of $2.7 billion in consecutive sessions broke definitively: the week ending May 24 produced $1.47 billion in net outflows, the worst weekly withdrawal of 2026. Gold settled at $4,500.40 on COMEX — confirmed 15% below its January all-time high. The bifurcation between equity euphoria and risk-asset stress has never been cleaner.
The Russell 2000’s +4.56% surge is the mechanical explanation for the week’s optimism. The 10-year yield peaked at 4.70% on May 20 — its highest print in 16 months — as markets digested the prior week’s hot CPI and PPI data stacking into the new trading session. Then the diplomatic signals out of Tehran briefly softened the oil picture, WTI pulled toward $91.61 midweek, and Treasury yields retraced sharply. That 20-basis-point round trip — 4.70% to 4.50% in four sessions — is the largest two-week rate-relief window in 2026. Small caps, which are the most rate-sensitive major index and which had been the biggest casualty of the rate rout in prior weeks, snapped back violently. The math is straightforward: Russell 2000 companies carry floating-rate debt at far higher proportions than S&P 500 constituents. When the 10-year falls 20 basis points, the rate-relief trade goes immediately to the index that had been crushed by the rate spike. That is exactly what happened. The Dow’s May 26 close at 50,461.69 is well back above the 50,000 line that was first crossed in February and then lost during the Iran war drawdown — but it is the Russell that tells you more about the macro environment’s current posture.
NVIDIA reported Q1 FY2027 on May 20: revenue $81.62 billion, +85.2% year-over-year, beating a consensus range of roughly $78.4–79.0 billion by $2.6–3.2 billion. EPS $1.87, up 140% year-over-year, against a $1.78 estimate. Data center revenue $75.2 billion — 92% of total revenue. Q2 guidance $91 billion, $4.5 billion above consensus. By any historical measure, the best quarter ever reported by a semiconductor company. The stock fell 1.77% the next day. By May 26, NVDA was 4.64% below its May 15 pre-earnings level. Sell the beat, four consecutive quarters running. Kevin Warsh was sworn in as the 17th Federal Reserve Chair on May 22, pledging a “reform-oriented Federal Reserve” — balance sheet reduction, fewer FOMC meetings, reduced dot-plot reliance, fewer Fed speakers. Markets read this as structurally hawkish but not immediately disruptive. VIX fell to 16.76 the day after the swearing-in. But the June 16-17 FOMC meeting is Warsh’s first, and rate hike risk is explicitly on the table — FOMC members discussed it in the days before Memorial Day. The Flash Manufacturing PMI hit 55.3, a 48-month high. Jobless claims: 209,000. Consumer Confidence: 93.1. The economy is not softening fast enough to create room for cuts. And Brent at $99.58 after the May 26 airstrikes is a persistent inflation headwind that Warsh has no policy tool to address.
(Continued for paid subscribers)
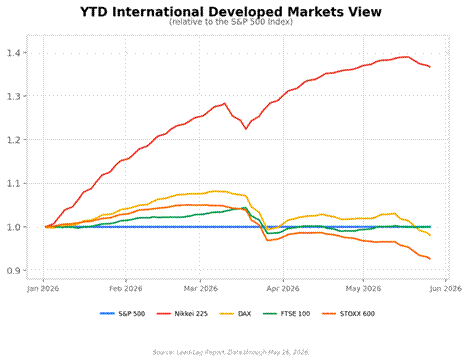
The international developed market story this week is a case study in the same bifurcation playing out across three different policy regimes. The Nikkei 225 broke above 65,000 for the first time in its history on May 25, closing at 65,158.19, before settling back to 64,996 on May 26 — still a +5.8% gain from the May 15 baseline. The Japanese megabanks reported extraordinary earnings: MUFG net income up 30% to ¥2.4 trillion, SMBC up 34%, Mizuho up 41% — all record fiscal years. Nintendo surged 52% on Switch 2 momentum. But the yen is at 159.30 — approaching the 160 level that triggered MOF intervention in April — and the Bank of Japan faces a genuine policy dilemma. Governor Ueda’s remarks at the BOJ-IMES Conference on May 26-27 were pointed: “Japan’s experience shows that oil price shocks are never just oil price shocks — they are tests of the entire inflation regime.” OIS markets are pricing a 70% probability of a 25-basis-point hike at the June 15-16 meeting. The BoJ’s own trend inflation gauge came in at +2.8% YoY for April — above target. Yet Ueda declined to pre-commit. The Nikkei’s record breach above 65,000 sits against a backdrop of a structurally weak yen at 159.30 and a central bank waiting on the May 30 Tokyo CPI print to decide whether to become the first major central bank to hike explicitly into an oil shock this cycle.
