
Three Weeks Aligned
Every intermarket signal stays on offense for a third straight week. Trend, rotation, commodities, and Treasury behavior remain unanimously aligned with risk.

Special Announcement
Income while staying fully invested in equities.
TappAlpha S&P 500 Growth & Daily Income ETF (TSPY)
TappAlpha Innovation 100 Growth & Daily Income ETF (TDAQ)

Investors have always had to choose: generate income or stay fully invested. TSPY and TDAQ do both—adding tax-efficient income potential to the S&P 500 and Nasdaq-100.
A tax-efficient alternative to traditional income strategies. Growth + Income — with the TappAlpha Growth & Daily Income ETFs.
Disclosures:
Investors should carefully consider the investment objectives, risks, charges and expenses of the ETFs identified on this site. This and other important information about the Fund are contained in the prospectus, which can be obtained by visiting tappalphafunds.com or by calling (844) 403-2888. The prospectus should be read carefully before investing.
ETFs are subject to additional risks that do not apply to conventional mutual funds, including the risks that the market price of an ETF’s shares may trade at a premium or discount to its net asset value, an active secondary trading market may not develop or be maintained, or trading may be halted by the exchange in which they trade, which may impact a Fund’s ability to sell its shares. Shares of any ETF are bought and sold at market price (not NAV) and are not individually redeemed from the Fund. Brokerage commissions will reduce returns.
The Fund invests in options contracts that are based on the value of the Index, including SPX and XSP options for TSPY and XND and NQX options for TDAQ. This subjects the Fund to certain of the same risks as if it owned shares of companies that comprised the Index, even though it does not own shares of companies in the Index. The Fund will have exposure to declines in the Index. The Fund is subject to potential losses if the Index loses value, which may not be offset by income received by the Fund. To the extent that the Fund invests in other ETFs or investment companies, the value of an investment in the Fund is based on the performance of the underlying funds in which the Fund invests and the allocation of its assets among those ETFs or investment companies. The Fund may incur high portfolio turnover to manage the Fund’s investment exposure. The Fund is classified as “non-diversified” under the 1940 Act.
As of the date of this prospectus, the Fund has no operating history and currently has fewer assets than larger funds. Like other new funds, large inflows and outflows may impact the Fund’s market exposure for limited periods of time. This impact may be positive or negative, depending on the direction of market movement during the period affected.
Due to the short time until their expiration, 0DTE options are more sensitive to sudden price movements and market volatility than options with more time until expiration. Because of this, the timing of trades utilizing 0DTE options becomes more critical. Even a slight delay in the execution of 0DTE trades can significantly impact the outcome of the trade. 0DTE options may also suffer from low liquidity, making it more difficult for the Fund to enter into its positions each morning at desired prices. The bid-ask spreads on 0DTE options can be wider than with traditional options, increasing the Fund’s transaction costs and negatively affecting its returns. These risks may negatively impact the performance of the fund.
Distributor: Foreside Fund Services, LLC
DISCLAIMER – PLEASE READ: This is sponsored advertising content for which Lead-Lag Publishing, LLC has been paid a fee. The information provided in the link is solely the creation of TappAlpha. Lead-Lag Publishing, LLC does not guarantee the accuracy or completeness of the information provided in the link or make any representation as to its quality. All statements and expressions provided in the link are the sole opinion of TappAlpha, and Lead-Lag Publishing, LLC expressly disclaims any responsibility for action taken in connection with the information provided in the link.
SIGNAL SUMMARY
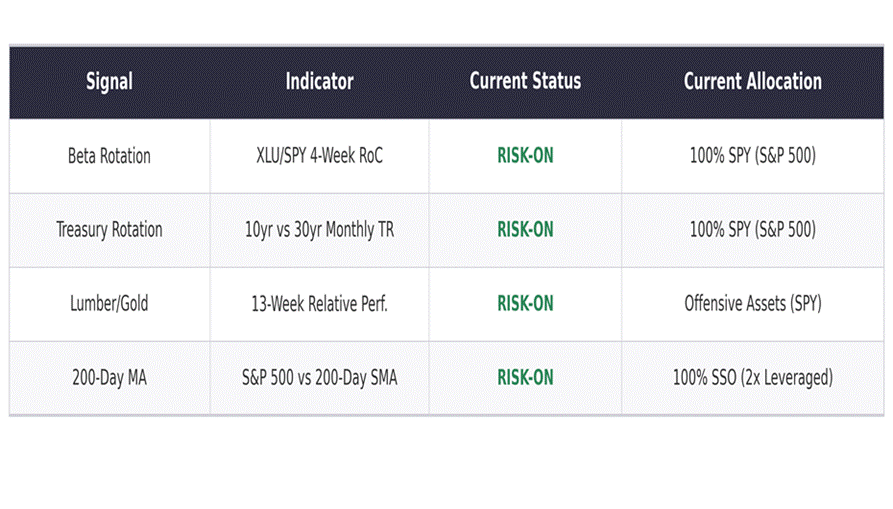
Key Takeaways:
• Signal 1 (Beta Rotation) remains Risk-On for a third consecutive week, with the XLU/SPY 4-week RoC at -5.97%. The S&P 500 continues to outperform Utilities by a wide margin as risk appetite strengthens. The negative RoC widening week over week confirms money is moving decisively out of defensive equity sectors and into the broad market.
• Signal 2 (Treasury Rotation) is now Risk-On on the fresh April month-end reading. TLT returned -1.23% in April versus IEF at -0.48%. Long-duration bonds underperformed intermediate maturities once again — a classic risk-appetite indicator. The signal will hold this reading through the end of May.
• Signal 3 (Lumber/Gold) has flipped back to Risk-On as lumber stabilized while gold consolidated. Lumber’s 13-week return of 2.86% now exceeds gold’s -11.85% decline, with all 7 sub-strategies rotated back to offensive positioning. Gold’s record run above $4,600/oz has paused, while lumber’s bounce off the $570 level reflects firming demand expectations.
• The S&P 500 at 7,473.48 sits +10.4% above its 200-day SMA of 6,771.47, firmly in Risk-On territory. The index closed at a new all-time high, with breadth, volatility, and trend all aligned. Signal 4 remains Risk-On, maintaining the allocation to SSO (2x leveraged S&P 500).
MARKET COMMENTARY
The framework reads 4-0 Risk-On this week, a clean sweep across all four intermarket indicators for the second straight week. Beta Rotation, Treasury Rotation, Lumber/Gold, and the 200-Day Moving Average all favor offensive positioning. The S&P 500 closed at 7,473.48 on May 15, with the index sitting +10.4% above its 200-day moving average of 6,771.47. The unanimous offensive posture persists as Lumber/Gold widens further in favor of cyclical risk and the broad-market bid continues to crowd out defensive rotation.
The week of April 27 to May 1 saw the equity rally extend to fresh highs as the macro backdrop turned increasingly supportive. The S&P 500 added approximately 1% on the week to close at 7,473.48, with breadth strong across most sectors. The April employment report on Friday came in roughly in line with expectations, neither too hot to revive inflation fears nor weak enough to signal recession. Treasury yields drifted modestly lower across the curve as the soft-landing narrative regained traction. The 10-year yield finished the week below 4.20%, a multi-week low, while the 2-year held near 3.75%. The dollar weakened slightly, supporting risk assets globally. Earnings season has continued to deliver positive surprises, with the bulk of S&P 500 reporters beating estimates and forward guidance broadly stable.
At 7,473.48, the index sits +10.4% above its 200-day SMA of 6,771.47, a comfortable margin that solidifies the bullish trend signal. The April monthly close at $7,209 confirmed the breakout from the early-year consolidation range, and price action through the first trading day of May has carried that momentum higher. Volatility remains contained, with the VIX hovering near multi-month lows. Small caps and high-beta segments participated in the advance, indicating that risk appetite is not concentrated in a narrow leadership group. The technical setup — price above a rising 200-day MA, breadth confirming the move, volatility subdued — is the textbook definition of a healthy bull trend.
The Beta Rotation signal remains firmly Risk-On with the XLU/SPY 4-week Rate of Change at -5.97%. Utilities continue to be sold relative to the broad market, with the negative RoC widening week over week. This is one of the strongest offensive readings of the year, and the signal is firmly allocating to SPY. Defensive equity rotation — typically a tell that institutional money is bracing for trouble — is conspicuously absent. The persistence of this signal across multiple weeks is more meaningful than any single reading: trend in the rotation series itself confirms the broad equity bid.
The Treasury Rotation signal has been refreshed with April month-end data and is now Risk-On. TLT returned -1.23% in April versus IEF at -0.48%, with the long bond underperforming the intermediate — a classic risk-appetite signature. The yield curve’s message is consistent with the equity tape: investors are not stampeding into duration as they would if recession concerns were rising. The signal will hold this April reading through the end of May before it can update again, providing a stable foundation for the framework’s offensive tilt over the next four weeks.
The Lumber/Gold signal has flipped back to Risk-On as lumber’s stabilization caught up to gold’s pause. Lumber’s 13-week return of 2.86% now exceeds gold’s -11.85% return. Gold’s relentless rally above $4,800/oz earlier this month has consolidated into a sideways pattern around $4,600, while lumber bounced off the $570 level on firming housing demand expectations. All seven Lumber/Gold sub-strategies have rotated back to offensive positioning. The signal is not declaring that the gold story is over — the metal remains in a structural uptrend — but the relative dynamic has flipped, and the framework treats relative performance as the operative variable.
The 4-0 reading is significant because it represents the rarer end of the framework’s distribution. Historically, clean-sweep Risk-On readings tend to cluster during the strongest phases of bull markets. They are not signals to chase higher, but they are clear instructions to lean into existing offensive allocations rather than fade strength. The current setup — trend confirmed, rotation supportive, commodities cooperating, yield curve constructive — is the configuration the framework is designed to identify and exploit. Risk management still applies, and traditional risks (geopolitical shock, inflation re-acceleration, earnings disappointment in a heavyweight name) can disturb the picture quickly. But absent those, the path of least resistance remains higher.
SIGNAL 1: BETA ROTATION
Based on: “Opposing Behavioral Forces: Beta Rotation” (SSRN 2417974)
Target Investor: Self-directed investors who want to capture relative strength between equity market segments. This signal uses the 4-week rate of change of the Utilities-to-S&P 500 price ratio to determine whether the market favors offense (broad equity) or defense (Utilities).
CURRENT INDICATOR: RISK-ON
XLU/SPY 4-Week Rate of Change: -5.97%
Current Allocation: 100% SPY (S&P 500)
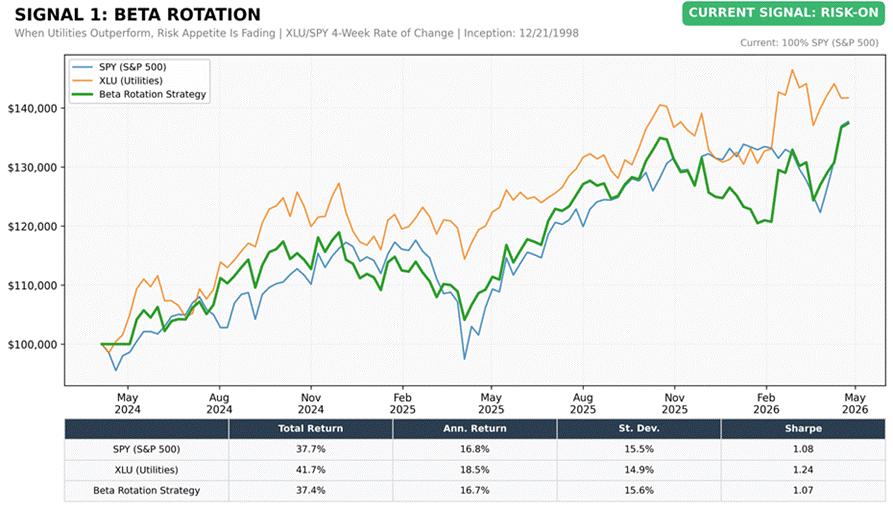
Growth of $100,000 | YTD from January 3, 2025 | Data: Lead-Lag Publishing, LLC
SIGNAL 2: TACTICAL RISK ROTATION
Based on: “A Quantitative Approach to Tactical Asset Allocation” (SSRN 2431022)
Target Investor: Conservative to moderate investors seeking a tactical overlay between equities and long-duration Treasuries. This signal compares the prior month total return of 10-year versus 30-year Treasury bonds to identify shifts in the yield curve’s risk appetite signal.
CURRENT INDICATOR: RISK-ON
30yr Treasury (TLT) March Return: -1.23%
10yr Treasury (IEF) March Return: -0.48%
Current Allocation: 100% S&P 500 (SPY)
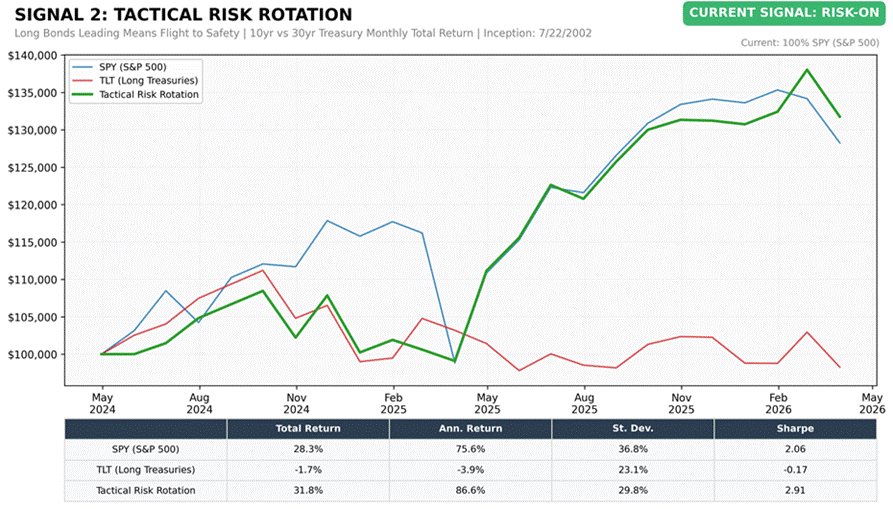
Growth of $100,000 | Monthly Data from January 2025 | Data: Lead-Lag Publishing, LLC
SIGNAL 3: LUMBER/GOLD RATIO
Based on: “Lumber: Worth Its Weight in Gold” (SSRN 2604248)
